
Abstract
Patients with persisting concussion symptoms (PCS) frequently have computer screen intolerance (CSI), a syndrome that implies impaired tolerance for electronic screens, including computers, cell phones and television screens. This study included 47 patients with PCS including CSI: 34 (73%) females and 13 (27%) males of median age 39 (31–52) and median number of previous concussions 2.5 (1–4.5). A cross-over, single-blind, randomized approach was used with each patient exposed to the flicker screen first followed by the flicker-free screen or vice versa. The patients completed the SCAT3 symptom questionnaire before and after screen use, and after viewing a short video. No significant differences in symptom number (p = 0.501) or symptom severity (p = 0.053) were found after reading between the screens. However, a subanalysis of elicited visual symptoms showed that reading on the flicker-free screen caused significantly lower symptom severity (p = 0.014). No significant differences were found between screens after total exposure (i.e., reading plus video task). This is the first study to evaluate the use of a flicker-free screen for preventing CSI in patients with PCS and suggest that a flicker-free screen may benefit some patients with CSI.
Keywords
Introduction
Extended screen time may cause individuals without a history of concussion to experience vision symptoms, and this has been described as computer vision syndrome (CVS) 1 or digital eye strain. 2 Indeed, nonconcussed individuals spending two or more hours of uninterrupted screen time have a greater risk of developing CVS, 3 which may include headache, eye strain, dry eye, blurred vision, and even diplopia. 1 In contrast, patients with persisting concussion symptoms (PCS) experience computer screen intolerance (CSI), a persisting concussion syndrome we previously reported in 2018. 4 We have defined CSI as concussion symptoms induced in patients with PCS after exposure to electronic screens including computers, cell phones, tablets and TV screens. Screens can exacerbate PCS 5 and specific vision symptoms including headache, photophobia (light sensitivity), cognitive fatigue, nausea, blurred vision and eye strain.6–8 Thus, CSI differs from CVS by causing a greater number of more severe symptoms, which can be triggered within minutes after screen exposure. Importantly, many concussed office workers, professionals, and students are required to use computer screens for several hours per day, and thus, CSI can impede return to work or school.
While the exact pathophysiology of CSI remains unknown, several theories have been postulated.6,9–11 One theory is that after a concussion, the brain or the retina may undergo changes that impair the ability to fuse incoming flickers of light. Critical flicker fusion frequency (CFFF) is defined as the lowest frequency at which a flickering light is perceived as nonflickering or “steady.” 12 Patients with CSI frequently work in schools and offices under fluorescent lights, which utilize an alternating current (AC) that induces flicker. 13 Although this theory has not been proven in patients with PCS, if these patients perceive flickering at higher frequencies than healthy individuals, the perception of a flickering screen may exacerbate CSI and the other symptoms described above. Also, conventional computer screens regulate brightness through pulse width modulation of an AC, which turns the voltage on and off at a high frequency. However, at lower levels of brightness, pulse width modulation induces more flicker, 14 which can exacerbate symptoms because these individuals tend to lower the screen brightness to alleviate the symptoms aggravated by bright light. Thus, if the CFFF hypothesis is correct, concussion-induced perception of flickering could explain why CSI occurs.
Our first study of CSI compared a conventional liquid crystal display (LCD) screen to a non-LCD screen after a 30-min reading task in patients with PCS. 4 The non-LCD screen had no flicker, no backlight, and a refresh rate lower than conventional screens (<60 Hz). We found that the non-LCD screen produced significantly fewer symptoms than the LCD screen. However, the non-LCD screen had several shortcomings including lack of scrolling ability, small screen size, lack of color, and high cost. Additionally, a potential confounding factor was that patients could not be blinded to the type of screen used, because the external appearances of the LCD and non-LCD screens could not be made identical. To eliminate these shortcomings, the present study compared identically appearing flicker and flicker-free screens, both manufactured by the same company. The flicker-free screen uses direct current to regulate brightness by producing a constant stream of light at any brightness level, which eliminates the flicker. 14 This screen was larger (27′′), multifunctional and more affordable than the screen previously used. For example, users can read online articles, scroll, and view high-quality motion videos. Indeed, many manufacturers now offer flicker-free screens. The aim of the current study was to determine if a commercially available flicker-free screen alleviates CSI in patients with PCS. We hypothesized that these patients experience a lower total number and severity of symptoms after performing tasks on a flicker-free screen compared with a conventional flicker screen.
Methods
Study inclusion and exclusion criteria
Patients were included if they met the following inclusion criteria: sustained a concussion between 1 month and 5 years prior to their first study visit; had PCS (i.e., diagnosis of concussion in patients with ≥3 symptoms persisting for ≥1 month and normal neuroimaging) 15 ; had CSI; spoke English well enough to provide consent and comprehended intake questionnaires and test intervention tasks; and were between 18 and 65 years old. Patients were excluded if they had a history of any severe neurological condition (i.e., stroke, seizures) or brain injuries more severe than a concussion, had a severe psychiatric disorder (i.e., schizophrenia, bipolar disorder), or any major pre-existing visual disorders (i.e., cataract, glaucoma, partial blindness) before sustaining a concussion. If patients required glasses or contact lenses, they were asked to bring them to the study session, and were asked to wear them for all study tasks. The study was approved by the Research Ethics Board of the University Health Network (22-5525).
The patient recruitment process was conducted between October, 2022 and March, 2024 and is outlined in Figure 1. A total of 150 patients were contacted by telephone to participate in this study: 27 declined to participate because they lived too far away from the hospital, did not have time, or felt they were too symptomatic to come, 35 did not respond, and 88 patients stated interest on the phone. Of these 88 patients, 20 did not follow up to book after being sent the consent form, 13 patients did not come to their appointment or asked to reschedule but then did not confirm new dates, and eight were excluded because they did not meet the study inclusion criteria when they were screened. The final sample size comprised 47 patients. All patients were seen at the Canadian Concussion Centre (CCC), Toronto Western Hospital, and had a clinical diagnosis of concussion, based on the International Consensus on Concussion in Sport Group. 16 In this study, patients were diagnosed with PCS if they had at least three symptoms that persisted for more than 1 month and had no imaging evidence of a more severe brain injury (i.e., intracranial hemorrhage, contusion). 17

Patient recruitment process.
Assessment measures
Pre-Test Questionnaire
This questionnaire was verbally administered and recorded by a trained graduate student prior to the intervention to collect the demographic data shown in Table 1, and the clinical data such as average time per day using a screen shown in Table 2. We created this questionnaire for this study, and it has not been validated.
Demographic Data of Study Participants (n = 47)
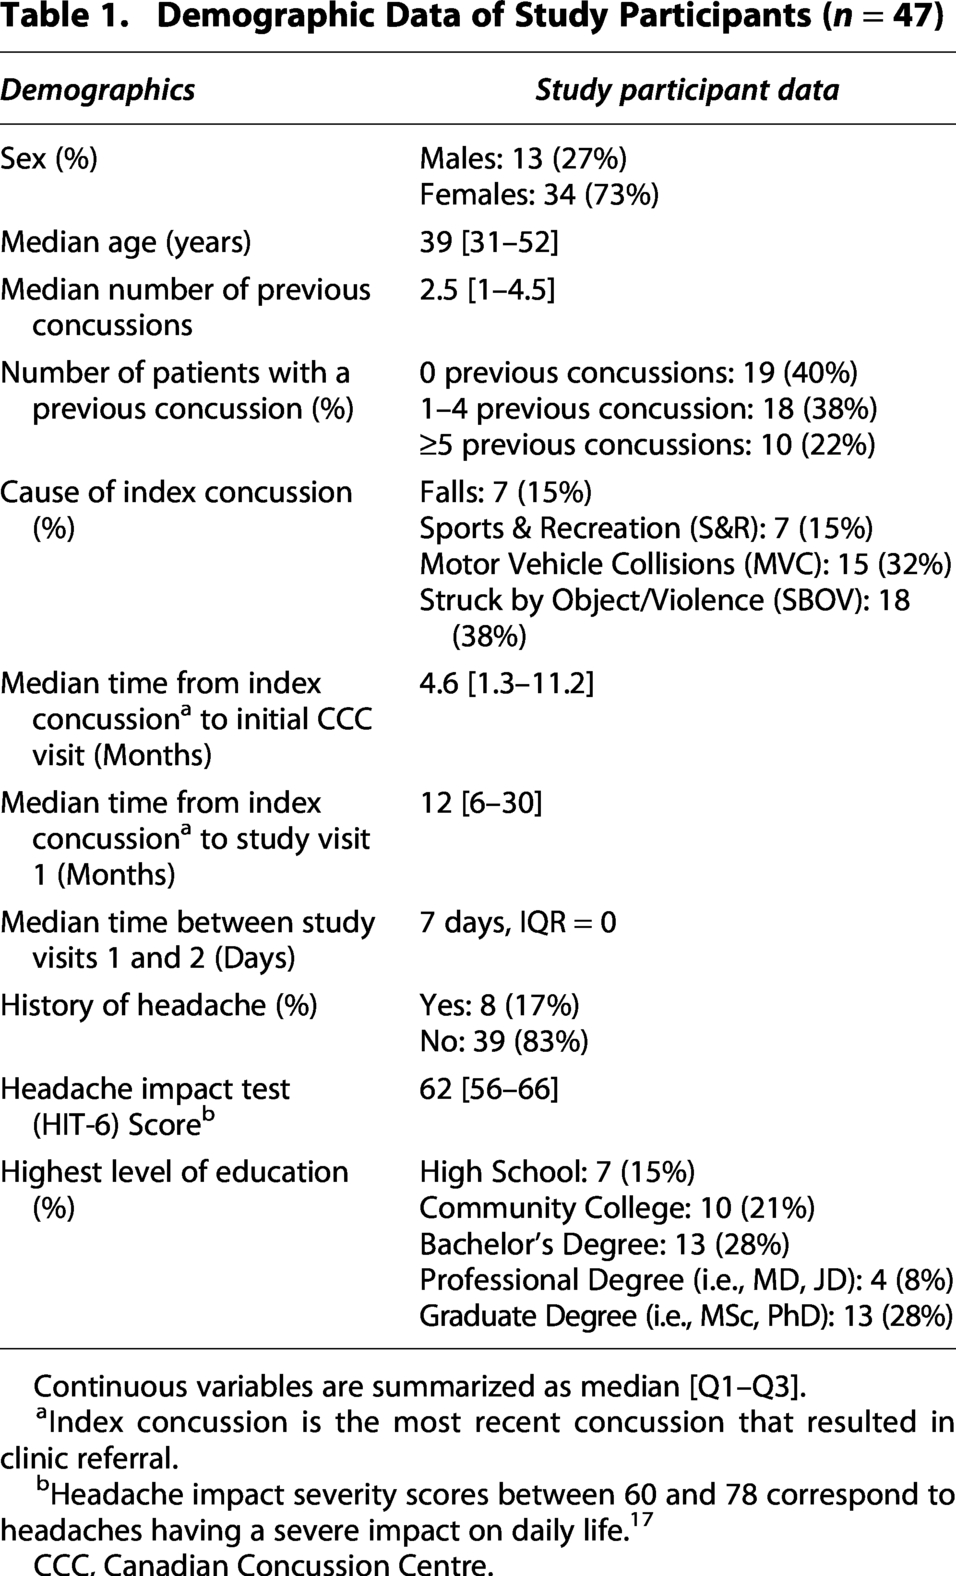
Continuous variables are summarized as median [Q1–Q3].
Index concussion is the most recent concussion that resulted in clinic referral.
Headache impact severity scores between 60 and 78 correspond to headaches having a severe impact on daily life. 17
CCC, Canadian Concussion Centre.
Questionnaire Data obtained Prior to Testing: A) Concussion Symptoms Experienced in Response to Screens, B) Aggravating Light Sources, C) Average Screen Time Per Day, and Reported Level of Discomfort from Screens and D) Return to Work Status in 47 Participants at a median time of 12 months after concussion

Other types of light sources comprised glare or bright spots of light, car headlights when night driving, blue LED Christmas lights, shadows outside, flicking lights in the subway, flashlights, streetlights in the night, and skating rink arena lights.
Business occupations included: marketing director, consulting, company CEO, business owner, banking/trading.
Other occupations included: dental hygienist, delivery driver, social worker, artist / digital designer.
Sports Concussion Assessment Tool Version 3
Sports concussion assessment tool version 3 (SCAT3) is a validated and standardized questionnaire comprising 22 symptoms graded by a 0–6 severity scale. 18 SCAT3 was used to evaluate the total number and severity of symptoms at three time points during each visit: (1) at baseline (i.e., before the reading task), (2) after performing a reading task on the screens, and (3) after viewing a video on the screens.
Assessment Tool for CSI
We also developed a new, specialized, and more sensitive Assessment Tool for CSI (Table 6), comprising 17 symptoms: 14 of the 22 SCAT3 symptoms experienced by 50% or more of the patients enrolled in the study (Table 4), and three binary symptoms from our Pre-Test Questionnaire (Table 2A). These 17 symptoms were selected because they were experienced by over 50% of the patients when questioned about computer screen use. The binary questions were converted to the SCAT 0–6 severity scale for consistency. Details of the analysis of the new Assessment Tool for CSI are in the Supplementary Data.
Headache Impact Test Questionnaire
The Headache Impact Test (HIT-6) is a validated tool that measures the impact of headache in both clinical practice and clinical research. 19 This questionnaire was used to gauge the severity of headache. It includes six questions with total scores ranging from 36 to 78 in four severity categories, as follows: little or no impact (49 or less), some impact (50–55), substantial impact (56–59), and severe impact (60–78). Higher scores indicate that headaches significantly impact the participant’s life.
Post-Test Questionnaire
This questionnaire was completed after the intervention to collect data on participants’ subjective responses describing their tolerance of the screen. We created this questionnaire for this study, and it has not been validated.
Experimental protocol
A randomized, single blind, cross-over protocol was created with an online randomization tool. 20 Patients were divided into two groups: Group 1 used the flicker screen (Model: BenQ SW271-B) during Visit 1, and the flicker-free screen (Model: BenQ SW271-B-mod) during Visit 2, and Group 2 used the reverse sequence (Fig. 2). All patient visits were scheduled 3–10 days apart. Both screens were standardized with the same settings for brightness, contrast, and color, the only difference was whether the screens flickered. Patients were blinded to the flicker status of the screen.
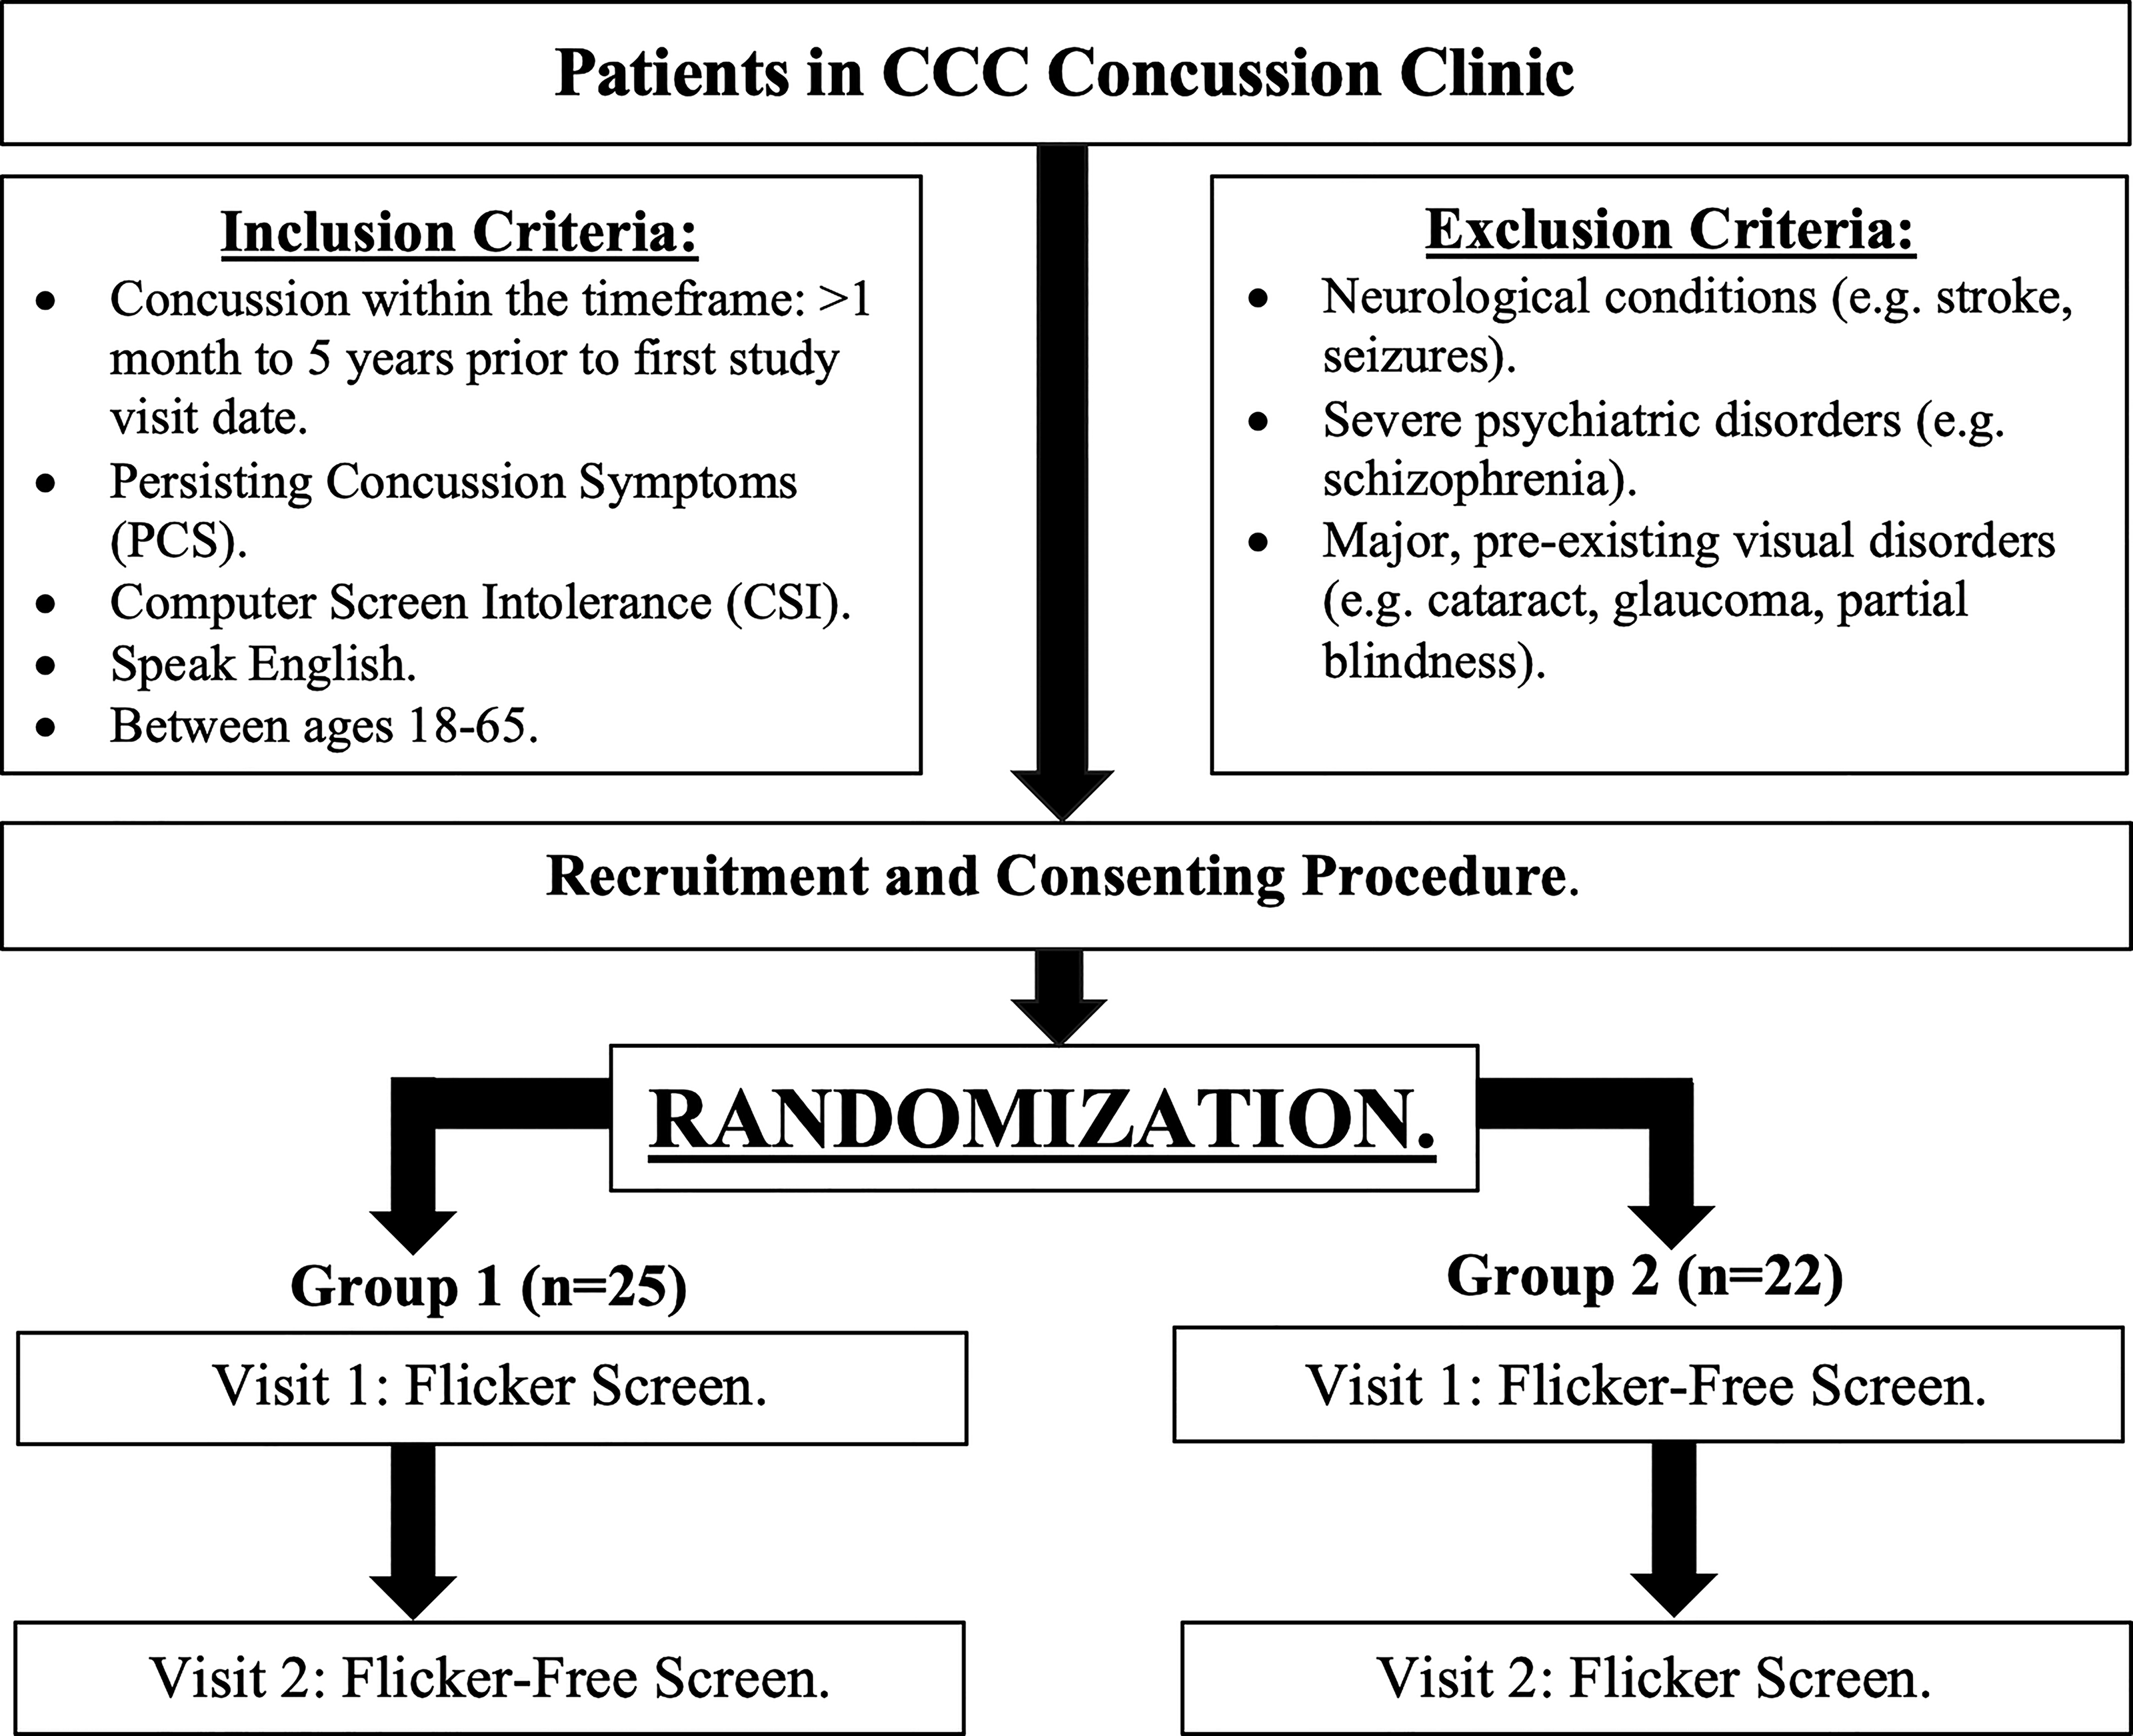
Cross-over design and randomization of patients.
Figure 3 illustrates the experimental pathways. At the start of Visit 1, patients completed the Pre-Test Questionnaire, which was verbally administered before the study tasks. Symptoms were recorded by SCAT3 at baseline (i.e., at the beginning of each study visit, prior to the reading task), after reading the passage, and after viewing the video. For the reading task, patients sat directly in front of the screen at a distance of approximately 47 cm, and were instructed to read excerpts of several short stories on the screen for 20 min. For the video task, the patient’s chair was moved to approximately 145 cm from the screen to simulate the distance for watching TV, and patients were instructed to view a 10-min video that contained clips from different racetracks in the Mario Kart 8 video game with no auditory component. After the intervention, a Post-Test Questionnaire was completed after each visit to evaluate the patients’ subjective responses to the screen.

Experimental pathways.
All patients completed all tests in the same controlled environment, illuminated by low-level incandescent lighting with an orange hue, designed to minimize the risk of exacerbating light induced symptoms. The room had no windows, fluorescent lights, or pot lights.
Statistical analysis
All statistical analyses were performed using Pandas (version 1.3.5) and SciPy (version 1.7.3). The Wilcoxon signed-rank test and the Wilcoxon matched pairs signed-rank test were used to compare the change in symptoms after reading and after total exposure (i.e., reading plus video task) on the flicker screen and the flicker-free screen. The Wilcoxon matched pairs signed-rank test was used to compare the total number and severity of SCAT3 symptoms between the two screens before and after reading, and after total exposure. The Wilcoxon matched pairs signed-rank test was applied to both the primary analysis and the subanalyses (described below). A thematic approach 21 was used for the qualitative analysis to assess the screen. For patients with multiple concussions, the most recent concussion was used for all study analyses. Continuous variables were summarized using the median and the interquartile range (IQR, defined as [Q1–Q3]). p-Values were considered statistically significant when less than 0.05. Methods for the analysis of the new Assessment Tool for CSI are provided in the Supplementary Data. Corrections for multiple comparisons were not applied given the small number of pre-specified comparisons, and the exploratory nature of the analyses.22–24
Results
Patient characteristics
Table 1 shows the demographic features of the 47 patients with PCS and CSI who participated in this study including 34 (73%) females and 13 (27%) males. The median age was 39 [31–52] years old, and the median number of previous concussions was 2.5 [1–4.5]. The causes of concussion were as follows: struck by object or assault including intimate partner violence (SBOV, n = 18, 38%); motor vehicle collisions (MVC, n = 15, 32%); sports and recreation (S&R, n = 7, 15%); and falls (n = 7, 15%). The median time from the date of the index concussion to the patients’ first CCC visit was 4.6 [1.3–11.2] months. The median time from the date of the index concussion to the patients’ first study visit was 12 [6–30] months. The median time between study visits 1 and 2 was 7 days. The majority of patients did not report a history of headache prior to their concussions (n = 39, 83%). After their concussions, headaches had a severe impact on their daily life (median HIT-6 score = 62 [56–66]). 19
Table 2 show the concussion symptoms experienced in response to viewing screens prior to testing. CSI was the most prevalent symptom and was reported by all patients (n = 47, 100%), as it was an inclusion criterion for the study. The next most prevalent symptoms from looking at screens were light sensitivity (n = 45, 96%), headache (n = 43, 91%) and eye strain (n = 40, 85%). Table 2 show the aggravating light sources including computers, cell phones and TV screens that exacerbated symptoms. Patients felt discomfort from other aggravating light sources including fluorescent lighting (n = 44, 94%), flashing or flickering lighting (n = 41, 87%), and indoor lighting in general (n = 36, 77%). Patients spent variable times per day from minutes to several hours on computer, phone, or TV screens. All patients reported that they experienced discomfort on the computer, 8 (17%) reported severe discomfort, 29 (62%) reported moderate discomfort, and 10 (21%) reported mild discomfort. The majority of patients had moderate to severe computer discomfort. Fourteen (30%) reported that the average time per day spent on a computer ranged from 6 to 10 h. Compared with computer screens, patients had better tolerance for TV screens: there was mild discomfort in 17 (36%) and 14 (30%) did not experience discomfort when watching TV. Table 2D displays the return-to-work status: at the time of the first visit, 33 (70%) patients had already returned to work, 26 (55%) of whom had returned at a reduced workload. The occupations of the patients varied, although almost all had jobs requiring them to use a computer screen for many hours per day at work.
Computer screen tolerance of flicker-free versus flicker screens
Table 3 shows the total number and severity of symptoms recorded via SCAT3 on the flicker screen (Table 3A), flicker-free screen (Table 3B), and compares the difference between both screens (Table 3C). Reading on the flicker screen caused a significant increase in the total number (p = 0.0021) and severity (p < 0.001) of symptoms (Table 3A). The number and severity of symptoms after total exposure (i.e., after reading plus video task) on the flicker screen was also significant (p < 0.001). Further, reading on the flicker-free screen also caused a significant increase in the total number (p = 0.0033) and severity (p = 0.0056) of symptoms (Table 3B). The number and severity of symptoms after total exposure (i.e., after reading plus video task) on the flicker-free screen were also significant (p < 0.001). When both screens were compared (Table 3C), there were no significant differences in the number (p = 0.752) or severity (p = 0.736) of symptoms at baseline (i.e., before the reading task). However, after reading, the total number and severity of symptoms were greater on the flicker screen than on the flicker-free screen, although this difference was not significant (p = 0.0534; Table 3C). No significant differences were found after total exposure (i.e., after reading plus video task).
Screen Intolerance After Reading and Total Exposure Tasks Measured by SCAT3 (n = 47)

Subanalyses and development of the new assessment tool for CSI (n = 47)
We examined the effectiveness of the SCAT3 as an assessment tool by determining if the inclusion of less relevant symptoms in the 22-symptom SCAT3 questionnaire may have affected the primary results (Table 3C). To do this, we created a new questionnaire including only the 14 symptoms that were elicited in 50% or more of the patients after reading on the flicker screen (Table 4). Thus, 8 of the 22 SCAT3 symptoms were excluded from the subanalysis (Table 5A) because <50% of patients experienced them, and these were: dizziness, nausea or vomiting, sadness, noise sensitivity, confusion, drowsiness, and trouble falling asleep. With the subanalysis based on the 14 SCAT3 symptoms experienced by at least 50% of participants (Table 4), we found a reduction in symptom severity following reading on the flicker-free screen (p = 0.0420; Table 5A).
Number of Participants Who Reported Each SCAT3 Symptom After Reading on the Flicker Screen (n = 47)

Experienced by <50% of participants, and therefore excluded from the subanalysis in Table 5.
Subanalyses: Wilcoxon Matched Pairs Signed-Rank Test Comparing Total Number and Severity of Symptoms with >50% Prevalence on the Flicker versus Flicker-Free Screens (n = 47)

Also, to further analyze the responses to the flicker and flicker-free screens we then created another tool more specific to CSI by adding three more symptoms—nausea, eye strain, and eye pain—based on (1) the “50% or more” criterion for inclusion of SCAT symptoms, and (2) the addition of other symptoms not on the SCAT3 that were experienced by 50% or more of the 47 patients with PCS based on the Pre-Test Questionnaire they completed at their first visit describing their symptoms from computer use (Table 2A). Although nausea was already in SCAT3, it was listed as “nausea or vomiting.” However, the Pre-Test Questionnaire data indicated that only 6% of CSI patients experienced vomiting in response to using a screen, while 55% of patients experienced nausea (Table 2A). However, reading on the flicker screen caused nausea or vomiting in only 43% of patients after reading on the flicker screen (Table 4), which did not meet our criterion of 50%. Thus, because few patients experienced vomiting, but >50% experienced nausea, we refined the way this symptom is listed in the new, more specific tool for CSI.
We then applied the new Assessment Tool for CSI (Supplementary Data) in a subanalysis based on these 17 symptoms found that reading on the flicker-free screen produced a lower symptom severity score after reading on the flicker-free screen (p = 0.014, Table 5B), although there was no significant difference in number of symptoms between the two screens after reading or after the video task (Table 5).
Time interval to produce severe CSI symptoms
All patients experienced symptoms within 20 min of reading or within 10 min of viewing the video. However, if patients felt they were too symptomatic to read or watch the video for the allotted task time, they were able to stop, and the time they stopped was recorded. During the reading task, 11 (23%) could not read for 20 min on the flicker screen, and 9 (19%) on the flicker-free screen. During the video task, 10 (21%) could not view the video for 10 min on the flicker screen, and 7 (14%) on the flicker-free screen. The shortest time to onset of CSI while reading on the flicker screen was 1 min and 30 sec. The shortest time to onset of CSI while reading on the flicker-free screen was 3 min. The shortest time to onset of CSI while viewing the video was 30 sec on both screens.
Subjective responses to the screens including qualitative analysis
After each visit, the Post-Test Questionnaire was administered, and patients rated the screen on a scale from 1 to 10. The worst screen ever used was scored as 1, and the best screen ever used was scored as 10. There was no significant difference between the flicker and flicker-free screen (5.93 vs. 6.06, respectively, p = 0.711, Supplementary Table S1). However, overall, the flicker-free screen was scored as more tolerable than the flicker screen by 54% of patients, while 40% favored the flicker screen, and 6% said they were equal (p < 0.001, Supplementary Table S1).
Reading experience and eye strain
The flicker-free screen resulted in a more comfortable reading experience with reduced eye strain: “the screen was soothing on my eyes; it helped with concentration, and I had more energy to read,” and “my eyes felt less strained while reading.” In comparison, the flicker screen was found to be more aggravating, resulting in an uncomfortable reading experience: “my eyes felt pain as if I was staring into the sun,” and “the screen was too sharp, my eyes felt strained.”
Aggravation of concussion symptoms
The flicker-free screen did not cause major changes to symptom severity: “the screen did not cause any extreme changes in my symptoms,” and “the screen seemed easier to tolerate than the screen I use at home.” However, six patients (12%) reported “headache,” but when three of these patients compared the flicker-free screen to their home computer, they indicated that they felt “less nauseous” and had “less headache.” Meanwhile, the flicker screen aggravated symptoms: “my symptoms got worse after using the screen, especially while reading,” and “this screen was uncomfortable and caused an increase in my symptoms.”
Screen settings, size and clarity:
After using both the flicker and the flicker-free screens, most patients reported that the screens were “too bright.” Additionally, after using both screens, patients indicated that their “home computer is better” because it had been “adjusted” to their preferred settings. For example, patients preferred to reduce the screen brightness and use assistive technologies such as dark mode (which alters the screen to a black background with white text) or nighttime mode (which changes the screen to an orange hue). In contrast, positive responses for both screens included the following: “I liked the screen size,” and “the screen was clear, and quality was good.”
In summary, many patients did not perceive a difference between the screens. However, although both screens elicited symptoms, more patients reported that the flicker-free screen reduced eye strain compared to the conventional flicker screen. Both screens were regarded as having good quality and clarity, although patients found them too bright and expressed a preference for testing the screens with their preferred settings, especially at reduced brightness.
Discussion
Main findings
Lack of knowledge of the exact pathophysiology of CSI has impaired the discovery of ways to treat this condition. This is the first study to evaluate a flicker-free screen as a potential treatment for alleviating CSI in patients with PCS. Several computer manufacturers now offer flicker-free screens, claiming they reduce eye strain. Additionally, this is the first formal clinical trial to evaluate a flicker-free screen in any population of patients with any neurological condition producing vision symptoms. We studied alleviation of CSI by a flicker-free screen in patients with PCS, and demonstrated that reading a passage on the flicker screen triggered a greater severity of SCAT3 symptoms in comparison to the flicker-free screen, although the difference was not statistically significant (Table 3C). However, we found that SCAT3 contains eight symptoms not experienced by at least 50% of patients with CSI. Indeed, SCAT3 was created for patients with sports-related concussions to assess symptoms in the acute phase. In the present study, sports and recreation were one of the least prevalent causes of injury in our patient population, and none of the 47 subjects were in the acute phase (Table 1). Patients completed the SCAT3 based on our verbal instruction to indicate “how you are feeling right now,” and thus, symptoms such as trouble falling asleep, were not relevant for CSI, and may be why the primary analysis did not achieve a statistically significant result. CSI has only recently been identified as a sequela of concussion 4 and is often unrecognized by most practitioners during clinical examinations for concussion because they are unaware of this syndrome. Unfortunately, there are no specific questionnaires for measuring the presence or severity of CSI.25–28 Although SCAT3 includes two vision symptoms related to concussion (light sensitivity and blurred vision), it does not include other frequent vision symptoms, such as eye strain or eye pain (Table 2A). We are aware of other vision assessment tools such as the Brain Injury Vision Symptom Survey, 27 which was created for patients with a broad spectrum of traumatic brain injuries, most of whom had injuries more severe than concussion, are not sufficiently specific to CSI, and does not include symptoms related to screen use. Thus, we have created a new tool described below.
Creation of a new specific assessment tool for CSI
The tool was based on three criteria: (1) the 14 SCAT3 symptoms elicited in at least 50% of patients after reading on the flicker screen, as this screen was the most aggravating for patients with PCS. The 50% threshold was selected as a data-driven criterion with no external validation performed to identify symptoms most consistently elicited during screen exposure while minimizing infrequent symptoms. Thus, we removed the eight symptoms with less than 50% endorsement by patients with PCS, and our subanalysis based on the remaining 14 symptoms showed that symptom severity was reduced after reading on the flicker-free screen compared to the flicker screen (p = 0.042, Table 5A). (2) The second criterion was from the qualitative evaluation of the initial questionnaire, which revealed additional symptoms frequently experienced by these patients including eye strain and eye pain, which are not included in SCAT3. (3) The third criterion relates to the fact that in SCAT3 the combination of nausea and vomiting are listed as one symptom. In our view, this leads to the underreporting of nausea when vomiting is absent. In contrast, our pre-questionnaire indicated that, in fact, very few of our patients experienced vomiting (Table 2A), whereas >50% experienced nausea. Thus, nausea is listed alone in our new Assessment Tool for CSI, which is shown in Table 6. The tool incorporates the 14 SCAT3 symptoms plus three additional symptoms—eye strain, eye pain, and nausea. With the new tool, the subanalysis showed that the flicker-free screen reduced symptom severity caused by reading (Table 5B, p = 0.014). We recommend this new tool for CSI assessment in patients with PCS, and have begun to validate it as shown in the Supplementary Materials. This tool is intended to be completed by patients based on how they feel in response to using a screen, in the presence of a health-care professional.
New CSI Assessment Tool for Computer Screen Intolerance: Derived from 14 SCAT3 and 3 Pre-Test Questionnaire Symptoms with >50% Prevalence
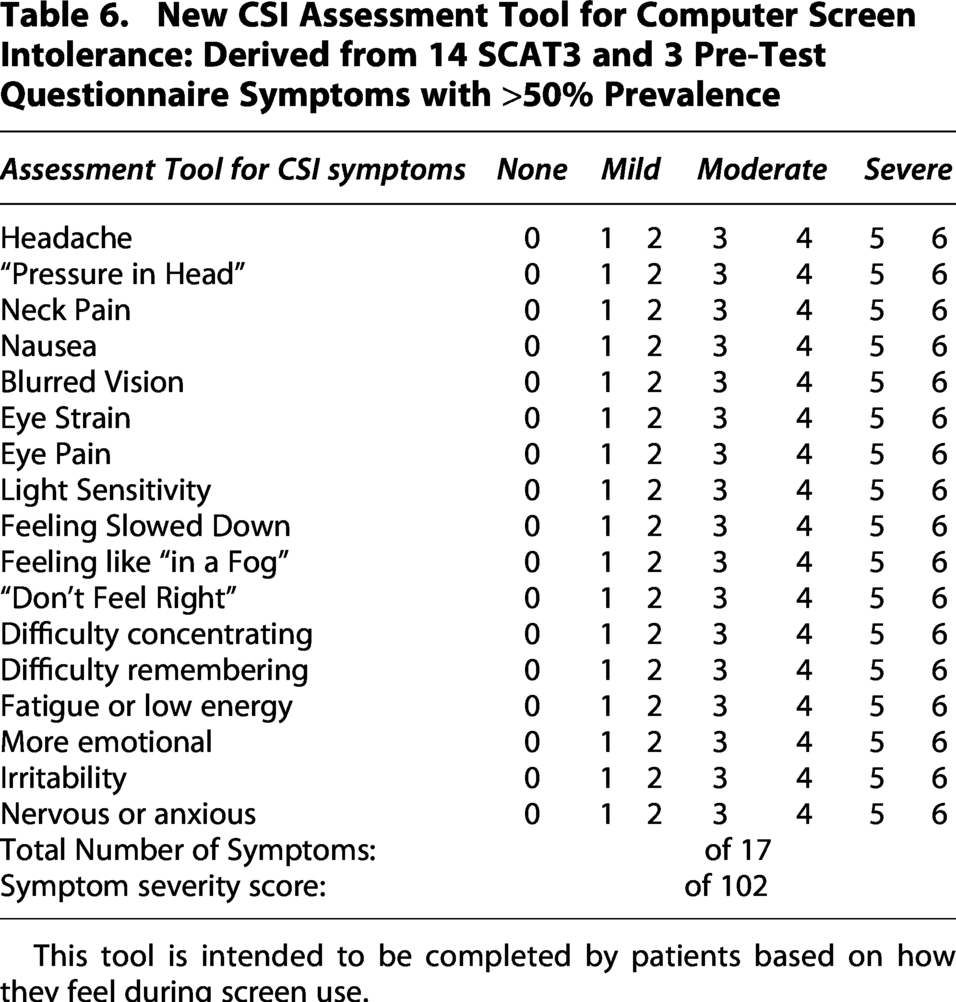
This tool is intended to be completed by patients based on how they feel during screen use.
Written passage versus video viewing
In contrast to the written passage as a test, we found no significant differences between the screens based on viewing the video. This suggests that cognition or attention may be required for eliciting CSI symptoms, since reading requires attention, concentration and retention.29,30 Thus, the requirement for a cognitive component for reading may have triggered CSI in patients with PCS. In contrast, watching a video is passive and does not require cognition or attention. 31 For example, if patients played a strategic video game that requires intense focus and cognition, it might have triggered more symptoms. Cognitive effort may have played a role when patients reported the types of electronic screens that caused the most discomfort (Table 2B): computer screens were the most aggravating, and TV screens were the least aggravating. Also, factors other than cognition, such as screen size and distance from the screen may be important for eliciting CSI. It should be noted that we may have placed the screens too far from the patient during the video task to simulate home TV viewing distance. This may have blunted the advantage of the flicker-free screen.
Reading on a screen versus reading on paper
In the present study, we did not include a comparison of reading on paper versus reading on a screen because we performed that experiment in our initial study of CSI. 4 We essentially simulated “reading on paper” by having patients read on an e-reader screen, which closely resembles reading on paper, and is an appropriate surrogate test for reading on paper. We found that patients with CSI had minimal discomfort when reading on the e-reader screen in comparison with major discomfort from reading on the usual computer screen. Thus, in our view, we have already established that reading on paper is better tolerated than a computer screen, and therefore, in the present study, we did compare reading on paper versus a screen.
The effect of sex and age on CSI
In the present study, 73% of the 47 patients were female (Table 1), which is similar to our previous CSI study 4 that included 27 patients, of which 79% were female. Possible explanations for the sex differences in our sample is that females may be more willing to participate in research studies, or that CSI may be more prevalent in females. For example, in another study from our center comprising a cohort of 600 PCS patients, 341 patients (57%) reported suffering from light sensitivity, and of those patients 210 (62%) were female. 23 Indeed, light sensitivity and CSI almost always persist together in our patient population. Also, there is evidence supporting that females take longer to recover from a concussion than males,5,32,33 and headache is more frequent in females. 34 When we investigated whether there is a difference in the total number and severity of symptoms based on SCAT3 between males and females, we found no significant differences between the screens after reading (Supplementary Table S2A) or after viewing the video (Supplementary Table S2B). Further, we performed sex-stratified analyses using the change from baseline for both females (n = 34) and males (n = 13) between the flicker and flicker-free screens. No significant differences were found with respect to the change in number or severity of symptoms for the reading task (all p ≥ 0.153) or for total exposure (after reading plus video; all p ≥ 0.542). Thus, the overall findings were unchanged when sex-based comparisons were performed on baseline-referenced change scores. Therefore, sex was not a factor with respect to which screen type was better tolerated in patients with PCS.
In contrast, we found a difference between patient age and symptom severity on the flicker-free screen after reading: patients over 40 years of age had more severe symptoms than those under 40 years of age (p = 0.031, Supplementary Table S3A). The age of 40 was selected for this comparison because the median age of patients in the sample was 39 years [31–52] (Table 1), which provided two groups of patients of similar sample size to permit the comparison (Supplementary Table S3). Other studies, including our own, showed that older individuals take longer to recover from concussions.5,35–37
Severity of CSI and relationship to patient occupation, and daily computer usage
Our cohort of patients may not have been at their peak level of symptoms because the inclusion criteria included patients concussed between one month and five years from the date of their first study visit, and the median time was 12 months [6–30] (Table 1). It is likely that at a shorter time interval from their concussion, patients would have been even more symptomatic. However, it should be emphasized that our cohort was a significantly burdened group: only 31% were able to return to their preinjury workload (Table 2D), the median HIT-6 score was 62 indicating that their headaches had a severe impact on daily life (Table 1), and 94% reported discomfort from fluorescent lighting (Table 2B). Most patients (79%) in this sample population reported moderate to severe computer discomfort when working on a computer screen (Table 3C), and almost all had occupations that required extensive computer time at work (Table 3D). However, 70% had already returned to work (Table 3D) before their first study visit, which occurred at a median time of 12 months after their index concussion (Table 1). Although 55% returned at a reduced workload (Table 3D), 30% of the patients in this study reported that they still worked on their computer for an average of 6–10 h a day (Table 3C). Thus, many patients in this study were still significantly symptomatic from CSI but were back at work pushing through their symptoms. It is uncertain whether “working with symptoms” affects long-term overall recovery. One study demonstrated that avoiding screen time during the acute phase can shorten the duration of concussion symptoms. 38 Our study demonstrates that patients can experience CSI within minutes of using a screen, and certainly indicates the difficulties many workers experience in managing persisting CSI, emphasizing the need for additional strategies related to computer screens that facilitate early return to work.
Limitations
Our study has several limitations. Of the 150 patients with CSI in our clinic whom we attempted to recruit, only 47 agreed to enroll (Fig. 1). Although the enrollment rate from our clinic was low, there was no selection bias with respect to those who participated because all patients were given the opportunity to enroll. Our clinic serves patients throughout Ontario, a large geographic area. Table 1 lists the demographic features of the 47 patients, which comprised different sexes, ages, number of previous concussions, levels of education, and occupations (Table 2D). In our view, the enrolled patients were representative of those with CSI, and there was no selection bias. Reasons for declining participation included long travel distances, the requirement for two research study visits, and risk of exacerbating PCS.
It has been established that at lower brightness, screens utilizing AC induce more flickering, 14 which is the reason we avoided setting screen brightness too low. However, during testing many patients reported that the screen was “too bright,” and thus, the brightness may have been set too high in our study. The optimal level of screen brightness for patients with PCS remains unknown, and therefore, future studies should examine how screen brightness affects CSI.
Another limitation is that we did not pursue the effect of the color of the screen images on the incidence and severity of CSI. Future studies should evaluate the severity of symptoms produced after using computer screens that alter the color of the images such as the use of assistive technologies like flux, 39 which gives images an orange hue in comparison with the abundant blue light emitted from conventional screens without assistive technology but with standard screen settings.
The sequence of tests may also have affected our results. For example, all patients read the passage first and then viewed the video, rather than randomizing the sequence of these tasks. In addition, the reading task lasted 20 min, while the video task was only 10 min. Perhaps both should have been the same duration. Also, if duration of engagement is important for symptom production, perhaps 10 min was not long enough to elicit symptoms when viewing the video. Also, the video task did not require active attention, whereas the reading task required focus and attention. If we had asked patients to play a video game involving cognition or attention the results for the video task may have been different. Also, as noted above, we may have erred by testing the video at a “television-like” viewing distance.
Although we screened participants for visual impairments prior to enrolling them in the study, and excluded those with severe vision disorders (including glaucoma, cataract removal, and macular degeneration), we did not collect information about other vision changes such as convergence insufficiency, accommodative dysfunction, presbyopia, myopia, or hyperopia. Future studies should examine the relationship between vision changes (i.e., myopia, hyperopia, etc.) and screen tolerance, ideally examining those with preinjury conditions as well as injury-induced conditions to better understand how different tasks affect screen tolerance.
Conclusions
This is the first study to evaluate a multifunctional flicker-free screen as a potential treatment to alleviate CSI in patients with PCS. The initial analysis demonstrated that reading a passage on the flicker screen caused a greater severity of symptoms than they experienced with the flicker-free screen (Table 3C), although these differences were not statistically significant possibly due to the shortcomings of SCAT3 as an outcome measure to assess CSI. In the absence of definite knowledge of the pathophysiology of CSI, the assessment of CSI is based on patients’ subjective responses to questionnaires containing a list of symptoms. However, we found that SCAT3 includes some symptoms not relevant for the study of CSI, such as trouble falling asleep, balance, and noise sensitivity. Future CSI studies should consider using the more specific assessment tool we developed (Table 6). With this new tool as an outcome measure, we found that symptom severity caused by reading on the flicker-free screen was significantly reduced (Table 5B, p = 0.014). Thus, we recommend that concussed patients should trial a flicker-free screen. We also found that the video we tested may have failed to elicit CSI because it did not require cognitive engagement or because it was placed too far away from the subject. We also recommend the use of the new assessment tool for CSI in future studies of the pathophysiology and treatment of this condition.
Transparency, rigor, and reproducibility summary
This study was approved by the University Health Network Research Ethics Board (22-5525). Written informed consent was obtained from all patients prior to study enrollment. No power analysis was performed for this study, because we based it on the previous study, which required only 29 patients with CSI to show a significant difference between the two tested screens. Data was acquired between October 2022 and March 2024. Data were collected by a trained graduate student who could not be blinded to the treatment because they needed to make sure the two screens were correctly placed for each patient. However, all participants were blinded to the type of screen (i.e., flicker vs flicker-free) they used during study visits. All information collected was confidential, and patients were given a unique study ID so their names were not associated with any information collected. All questionnaires used in this study will be made available by request from any qualified investigator. The inclusion criteria and primary outcome questionnaire (i.e., SCAT3) are established standards. The methods section explains the nature of the statistical tests used. One of our co-authors is a statistician who remained blinded to the screen type (i.e., flicker vs flicker-free screen) during the formal data analysis. All authors have agreed to publish the article using Mary Ann Liebert. Inc. “Open Access” option, and with the appropriate license it will be freely available upon publication.
Authors’ Contributions
C.B.: Conceptualization, methodology, investigation, data curation, formal analysis, writing original draft, review, and editing. C.T.: Conceptualization, methodology, and writing, review and editing. I.J.: Conceptualization, writing, review and editing. K.D.: Conceptualization, writing, review and editing. M.R.: Conceptualization, writing, review and editing. M.H.: Formal analysis. C.T.: Conceptualization, methodology, study supervision, writing, review and editing.
Footnotes
Acknowledgments
The authors thank BenQ for donating the flicker and flicker-free monitors to the Canadian Concussion Centre for this study.
Author Disclosure Statement
The authors have no competing interest to disclose.
Funding Information
IJ was supported in part by funding from Natural Sciences Research Council (NSERC RGPIN-2024-04314), CIHR (#519474), Canada Foundation for Innovation (CFI #225404, #30865), Ontario Research Fund (RDI #34876, RE010-020), Krembil Foundation and Ian Lawson van Toch Fund. The funders had no role in study design, data collection and analysis, decision to publish, or preparation of the manuscript.
Supplemental Material
Supplemental Material
Supplemental Material
Supplemental Material
Supplemental Material
Supplemental Material
Abbreviations Used
References
Supplementary Material
Please find the following supplemental material available below.
For Open Access articles published under a Creative Commons License, all supplemental material carries the same license as the article it is associated with.
For non-Open Access articles published, all supplemental material carries a non-exclusive license, and permission requests for re-use of supplemental material or any part of supplemental material shall be sent directly to the copyright owner as specified in the copyright notice associated with the article.