
Abstract
This study examines long-term rainfall variability, extremes, and drought risks across 14 districts of Kerala, India (1951–2020) using a suite of climatological and statistical approaches. Monthly rainfall data were analyzed to construct district and state-level climatology curves, revealing the characteristic double monsoon regime with a dominant Southwest Monsoon (June–September) and a secondary Northeast Monsoon (October–December) peak. Annual and decadal trends were assessed using linear regression (mm/decade) and anomaly analysis (baseline 1951–1980). Results indicate a statistically significant decline in Wayanad (–163 mm/decade, p < 0.001) and consistent downward trajectories in Thrissur and Trivandrum, while Idukki and Ernakulam exhibit marginal, nonsignificant increases. Kerala-wide anomalies reveal a transition toward frequent rainfall deficits since the 1980s, accompanied by increased interannual variability in recent decades. Extreme rainfall analysis employed 95th percentile thresholds and Weibull return-period estimation, revealing a reduction in extreme months after 2000, although rare high-magnitude events continue to have a significant impact (e.g., the 2018 flood). Drought risk, quantified using the Standardized Precipitation Index (SPI-12), highlights southern and midland districts (Trivandrum, Thrissur, Kottayam, Ernakulam) as particularly vulnerable. A composite risk index integrating extremes and droughts identifies Idukki, Malappuram, Ernakulam, Thrissur, and Palakkad as the most climate-sensitive districts. The study demonstrates that Kerala faces dual water risks, structural drying in several districts, and persistent exposure to episodic flood extremes. Embedding rainfall-based drought and extreme weather indices into climate adaptation policy is crucial for strengthening water security, agricultural resilience, and disaster preparedness in Kerala.
Keywords
Background
Rainfall is widely recognized as a major determinant of water availability, agricultural productivity, and ecological stability in monsoon-dependent regions in India. Kerala, a southern state in India, is highly dependent on the monsoon, as it receives 70 percent of its annual rainfall during the Southwest Monsoon (SWM) from June to September, with a substantial secondary contribution from the Northeast Monsoon (NEM) between October and December (Guhathakurta and Rajeevan, 2008; Rajeevan et al., 2010). The distinctive double-monsoon climatology enables Kerala to meet the water needs of its population, as well as those of its agricultural and power sectors. Nonetheless, variability in rainfall, changes in monsoon onset and withdrawal, and increased frequency of extreme events pose significant challenges for water resource management, disaster preparedness, and climate adaptation in the state (Krishnan et al., 2020).
The concerns about extremes and deficits in rainfall have increased recently as Kerala experienced severe droughts (e.g., 1983, 1987, 2002, 2016) as well as devastating floods (notably in 2018 and 2019). Studies suggest that while the all-India monsoon has shown modest declining trends, rainfall variability has intensified regionally, with western coastal districts and the Western Ghats emerging as hotspots of change (Saha et al., 2014; Singh et al., 2014). Kerala has become such a hotspot since it covers 40 percent of the Western Ghats. The simultaneous occurrence of declining mean rainfall in some regions, frequent droughts, and occasional catastrophic floods underlines the complexity of rainfall risk in Kerala.
Despite Kerala’s strong reliance on rainfall for its agricultural activities, power generation through hydropower, and livelihoods, a thorough evaluation of long-term rainfall variability at the district level over several decades (1951–2020) has not been conducted. While the India Meteorological Department (IMD) and various national studies have offered valuable insights into the state’s monsoon patterns, there is still a lack of comprehensive integration at the district level, especially when it comes to merging various aspects of rainfall variability. A complete understanding necessitates a simultaneous evaluation of long-term climate patterns and trends, seasonal rainfall anomalies and decadal changes, extreme rainfall events classified by percentile thresholds, and drought impact using standardized measures such as the SPI-12 index. However, these aspects have usually been examined separately, creating notable gaps in understanding how rainfall fluctuations are experienced differently across Kerala’s varied geographical regions. Moreover, policy planning frequently lacks a focus on district-specific priorities. In the absence of solid empirical foundations outlining rainfall variability, extremes, and drought frequency, adaptation strategies may remain reactive, disjointed, and insufficient to tackle localized vulnerabilities. Considering Kerala’s recent encounters with both severe floods and extended droughts, it is essential to shift from state-level averages and create assessments that focus on district characteristics to inform effective climate adaptation and water management strategies.
Review of Literature
Rainfall fluctuations in Kerala have been a key subject of climatological and environmental studies for many years, primarily because the state heavily relies on seasonal monsoon patterns. These rainfall dynamics are crucial for supporting agriculture, maintaining freshwater supplies, and sustaining the hydropower systems that are vital to Kerala’s energy requirements. The unique geographic and climatic characteristics of the region render it particularly vulnerable to changes in monsoon behavior. Kerala’s rainfall is mainly influenced by two significant monsoonal systems: the SWM (June–September) and the NEM (October–December). Collectively, these systems account for more than 70 percent of the state’s yearly rainfall, highlighting their essential role in the region’s environmental and socioeconomic resilience (Gadgil and Gadgil, 2006). Generally, the SWM is the primary source, delivering widespread and intense rainfall throughout the state, while the NEM adds additional, often more erratic precipitation, particularly in the southern and southeastern areas.
Earlier research has highlighted the unique dual-monsoon climate of Kerala, setting it apart from many other regions in India that usually rely on a single monsoon season. This dual monsoon system leads to complex patterns of rainfall in terms of timing and spatial distribution, marked by notable fluctuations in intensity, duration, and coverage. Analyzing a 141-year time series, Mini et al. (2016) discovered that Kerala’s rainfall demonstrates considerable interannual variability with a significant amplitude. It was observed that a year with significantly above-normal rainfall is typically succeeded by a year of significantly below-normal rainfall, illustrating a biennial oscillation pattern. Research conducted by Soman and Kumar (1990) and Guhathakurta and Rajeevan (2008) has emphasized the significant spatial variation in rainfall distribution across the state’s diverse physiographic regions. Coastal areas usually experience more plentiful and consistent rainfall due to their proximity to the Arabian Sea, while inland and mountainous regions, such as the Western Ghats, often encounter pronounced differences in precipitation levels influenced by orographic effects and localized weather patterns.
The climatic conditions have led to a growing body of research that not only examines long-term trends and irregularities in rainfall but also their impact on agriculture, water resource management, and disaster preparedness (Goswami et al., 2006; Singh et al., 2014; Vittal et al., 2013). Variations in precipitation, influenced by natural climate cycles and human intervention, pose significant challenges for planners and policymakers who must ensure climate resilience in a region highly vulnerable to both droughts and floods. Numerous studies have highlighted persistent rainfall trends throughout India, particularly in Kerala. National assessments indicate a general reduction in the SWM in recent decades, with more significant declines observed in peninsular India (Wagholikar et al., 2014; Dash et al., 2007). At the regional level of Kerala, research shows a decline in rainfall in Western Ghats districts such as Wayanad and Idukki, while some central districts display relative stability (Ajayamohan and Rao, 2008). These findings imply a regional divergence in the rainfall patterns across Kerala.
Investigations into rainfall anomalies and long-term shifts indicate an increase in variability since the 1980s. More recently, Rajeevan et al. (2012) revealed that Kerala has faced a higher occurrence of dry years alongside sporadic extreme wet events, including the devastating floods of 2018, highlighting the dual challenges of drought and flooding. Research on extreme rainfall events presents mixed outcomes. While studies based on IMD data by Vittal et al. (2013) and Roxy et al. (2017) report a drop in the incidence of moderate rainfall events and an increase in high-intensity, short-duration extremes, Kerala seems to experience both trends: a decrease in widespread extreme months, but a continued incidence of uncommon, high-magnitude floods. Studies on return periods by Goswami et al. (2006) stress that such extreme events, despite their rarity, play a crucial role in causing flood disasters.
Research on drought using the Standardized Precipitation Index (SPI) has become increasingly prevalent for capturing precipitation deficits across multiple temporal scales. Studies in South India by Mishra and Desai (2005) and Pai et al. (2016) indicate an increasing occurrence of extended droughts, with the southern and midland districts of Kerala being especially susceptible. Assessments based on SPI identify Trivandrum, Thrissur, and Kottayam as consistent hotspots for drought, aligning with evidence of agricultural distress and reduced groundwater recharge (Krishnakumar et al., 2019). Moreover, integrated frameworks that amalgamate extremes, droughts, and trend analyses into composite risk assessments are still scarce in Kerala. While broader studies such as those by the Indian Network on Climate Change Assessment offer vulnerability indices at the state level, there is a dearth of district-specific analyses (Indian Network for Climate Change Assessment, 2010).
While prior research on Kerala’s rainfall has primarily concentrated on state-level or seasonal trends, trend analysis, or separate evaluations of floods and droughts, it rarely merges these aspects at a district-level scale over an extended multi-decadal timeframe (1951–2020). Much of the current literature either highlights monsoon climatology, all-India trends, or particular extreme occurrences such as the floods in 2018, but it lacks a cohesive framework that incorporates climatology, trends, anomalies, extremes, and droughts in a single analysis. This study fills that void by delivering a thorough district-level risk evaluation, integrating rainfall anomalies, percentile-based extremes, return-period analysis, and SPI-12 drought metrics into a composite risk ranking. Unlike previous studies that fall short of providing actionable prioritization, this research converts statistical results into district-specific risk rankings and a visual “rainfall risk dashboard,” thus directly aiding climate adaptation, water management, and disaster preparedness efforts in Kerala.
The primary objective of this study is to provide a comprehensive district-wise assessment of rainfall variability and risks across Kerala over the period 1951–2020. Specifically, the study seeks to characterize the seasonal and interannual rainfall climatology and identify long-term changes in trends and anomalies, with particular focus on the SWM and NEM regimes. A second objective is to evaluate the nature of hydro-climatic extremes, including both high-rainfall episodes and prolonged droughts, through a combination of percentile-based thresholds and standardized drought indices. Finally, the study aims to synthesize these insights into a comparative risk profile for districts, thereby providing an evidence-based framework for informing water security, agricultural planning, and climate adaptation policy in Kerala.
Data and Methodology
This study utilizes monthly rainfall data for the 14 districts of Kerala covering the period 1951–2020, obtained from the IMD. The IMD applies standardized quality-control procedures and homogenization practices in the preparation of long-term climatological datasets, ensuring the reliability and comparability of rainfall observations across stations and time. The dataset was structured to facilitate both Kerala-wide and district-level analyses, thereby capturing spatial contrasts across the coastal plains, midland regions, and the Western Ghats highlands.
To characterize the seasonal cycle of rainfall, long-term monthly averages were computed for the entire study period. Particular attention was given to Kerala’s two principal monsoon systems: the SWM (June–September) and the NEM (October–December). Kerala-wide climatology was obtained by averaging monthly rainfall across all districts, while district-level climatology was calculated by averaging monthly rainfall totals within each district. This approach enabled comparison of rainfall regimes across the state’s major physiographic zones.
Long-term rainfall trends were examined using annual rainfall totals derived by aggregating monthly rainfall values for each district. Temporal trends were estimated using Ordinary Least Squares (OLS) regression, expressed as:

For ease of interpretation, the estimated slope was converted into millimeters per decade. Statistical significance of the trend estimates was evaluated using p values associated with the regression coefficient.
To reduce short-term fluctuations and highlight long-term structural changes in rainfall regimes, decadal averages were also computed using
Although nonparametric techniques such as the Mann–Kendall trend test and Sen’s slope estimator are frequently used in hydro-climatic studies, OLS regression was employed in this analysis because it provides a direct estimate of the magnitude of rainfall change in millimeters per decade. This metric facilitates clearer interpretation and policy communication of long-term rainfall shifts across districts.
Rainfall anomalies were calculated relative to a baseline climatological period of 1951–1980, which is consistent with standard climatological practice. Annual rainfall anomalies were computed as

Kerala-wide anomalies were obtained by averaging anomalies across all districts, while district-level anomalies provided localized insights into spatial variability. This framework allowed the detection of shifts in rainfall patterns before and after the 1980s, a period often associated with emerging climate variability signals.
Extreme rainfall was analyzed using the 95th percentile threshold of monthly rainfall totals, computed for each district based on the 1951–1980 baseline period. Monthly rainfall exceeding this percentile threshold was classified as an extreme rainfall event. The frequency of such events was calculated on a decadal basis in order to evaluate changes in the occurrence of extremes over time.
To estimate the recurrence intervals of annual rainfall extremes, the Weibull plotting position method was applied:

It should be noted that percentile-based thresholds derived from historical climatological baselines implicitly assume stationarity in rainfall distributions. Under conditions of climate change, however, rainfall distributions may evolve over time. Consequently, thresholds based on earlier periods may not fully capture shifts in the behavior of extreme events. Therefore, the results should be interpreted as relative changes with respect to the historical climatological baseline, rather than as absolute measures of future extreme rainfall risk.
Drought conditions were assessed using the SPI with a 12-month accumulation window (SPI-12). Rolling 12-month rainfall totals were standardized against the historical rainfall distribution to obtain standardized z-scores. Drought conditions were classified according to commonly used SPI thresholds:
Mild drought:
Moderate drought:
Severe drought:
For each district, the number of drought months at each threshold was counted. A Weighted Drought Burden Index (WDBI) was then constructed to capture both drought frequency and severity.

Finally, a composite climate risk ranking was developed by integrating two dimensions:
Post-1980 extreme rainfall frequency, measured relative to the historical 1951–1980 thresholds, and SPI-based drought burden index.
Districts were ranked separately according to extreme rainfall exposure and drought burden. The average of the two ranks was then used to identify districts exhibiting the highest combined climate risk. To summarize statewide patterns, a Kerala-wide climate risk dashboard was constructed. This dashboard presents the five districts with the highest extreme rainfall exposure, the five districts with the highest drought burden, the statewide SPI-12 time series, and the proportion of districts experiencing extreme rainfall months each year.
Results and Discussions
Analysis of rainfall variability
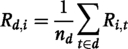
The long-term climate data on rainfall for Kerala from 1951 to 2020 (see Fig. 1) showcases the region’s unique bimodal monsoonal pattern, which is characteristic of its tropical monsoon climate. The cycle of annual rainfall is distinctly highlighted by two main peaks that correspond to the two primary monsoon systems affecting the area. The first peak occurs between June and August, driven by the SWM, responsible for the majority of the annual rainfall in the state. This period is noted for heavy and widespread precipitation, often representing more than half of the total yearly rainfall. After this, a second peak can be observed in October and November, linked to the NEM. While typically less severe than the SWM, the NEM still plays a vital role in total rainfall, especially in the southern districts. In contrast, the dry season spanning January to March records consistently low rainfall amounts, indicating a climatologically stable dry period across all districts.
Kerala rainfall climatology (1951–2020, 14 districts). Source: Authors’ work using IMD data.
When examined at the district scale (see Fig. 2), rainfall climatology curves highlight substantial regional variation in both the magnitude and distribution of rainfall across Kerala. Coastal districts such as Kozhikode, Kannur, Alappuzha, and Thiruvananthapuram show a clear dominance of SWM rainfall, with sharp, narrow peaks centered around June to August. These areas receive high rainfall volumes over a shorter period, influenced by proximity to the Arabian Sea and low-lying coastal topography, which facilitates the direct impact of SWM winds and moisture-laden clouds. In contrast, districts located in the Western Ghats, including Wayanad, Idukki, and Palakkad, exhibit higher total seasonal rainfall and a more prolonged monsoon season. These districts experience not only substantial SWM precipitation but also significant contributions during the NEM period, resulting in a more evenly distributed rainfall pattern from June through November. The orographic lifting effect of the Western Ghats plays a critical role here, enhancing rainfall during both monsoon phases and contributing to higher cumulative rainfall totals.

District-wise rainfall climatology (1951–2020). Source: Authors’ work using IMD data.
Moreover, there are noticeable temporal differences in the onset and intensity of the monsoon throughout the state. The northern districts of Kerala, including Kasargod and Kannur, generally experience an earlier arrival of the SWM, which can be linked to their geographical location closer to the entry point of the monsoon over the Indian subcontinent. In contrast, the southern districts, such as Thiruvananthapuram and Kollam, show a more significant secondary peak during the NEM. This phenomenon is likely due to their increased exposure to easterly wind patterns from the Bay of Bengal, which bring moisture during the post-monsoon period and make these areas more sensitive to NEM dynamics. These regional and temporal differences highlight the intricate rainfall patterns of Kerala, influenced by various monsoonal systems, topographical diversity, and latitudinal variations. Grasping these trends is crucial not only for academic studies in climatology but also for practical uses in agricultural development, management of water resources, emergency preparedness, and climate adaptation strategies at both the state and district levels.
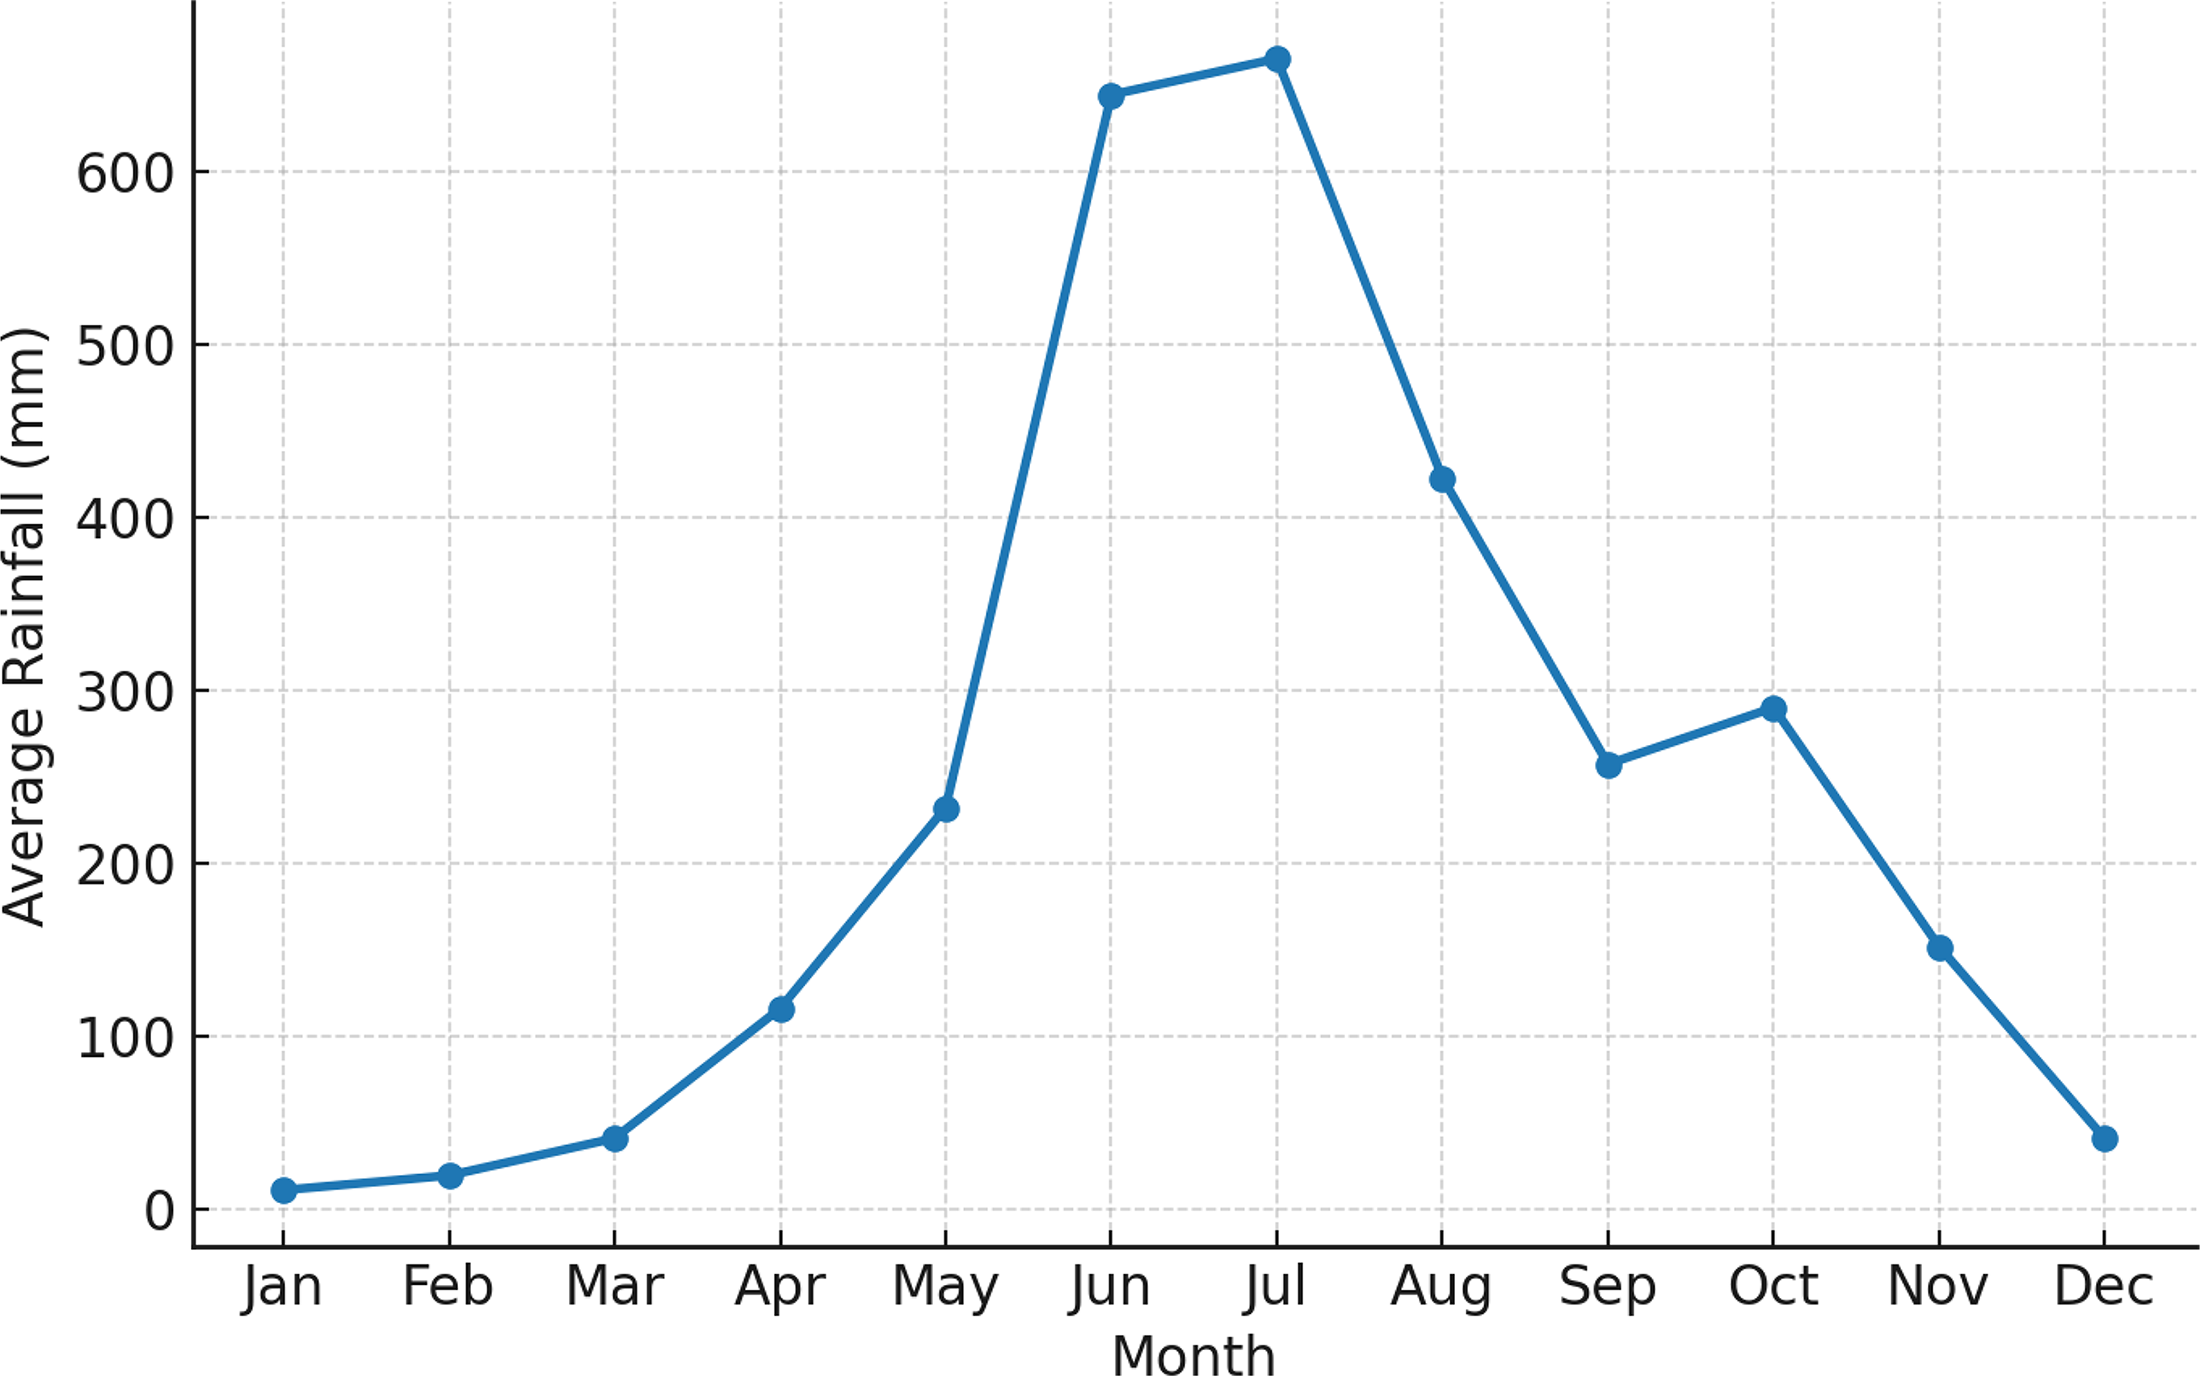
The trend analysis presented in Table 1 and Figure 3, covering the period from 1951 to 2020, reveals a distinct and compelling pattern of spatial divergence in rainfall trends across the state of Kerala. This divergence indicates that changes in precipitation are not uniform throughout the region but rather vary significantly between districts. Among all the districts analyzed, Wayanad stands out with the most pronounced and statistically significant decline in rainfall. The district has experienced a marked decrease in annual precipitation, with a trend of approximately 163 mm per decade, a result that is highly significant (p < 0.001). This sharp decline underscores the heightened vulnerability of the ecologically sensitive Western Ghats region to long-term reductions in monsoonal rainfall, potentially affecting both local ecosystems and water resources.
District-wise annual rainfall trends (1951–2020). Source: Authors’ work using IMD data.
OLS Results

Authors’ estimation using IMD data.
IMD, India Meteorological Department; OLS, Ordinary Least Squares.
Several other districts also demonstrate declining trends, albeit with varying degrees of statistical support. For instance, Thrissur and Thiruvananthapuram (Trivandrum) exhibit notable negative slopes in rainfall over the study period, but these trends fall short of reaching conventional levels of statistical significance (p > 0.05). Nevertheless, the directionality of these changes aligns with the broader pattern of drying. Additional districts, including Kasargod, Kannur, Kozhikode, Kollam, and Alappuzha, show moderate but consistent declines in rainfall. While these decreases may not all be statistically significant on an individual basis, their collective pattern suggests a broader regional tendency toward drying, particularly in the northern and coastal zones of the state. Conversely, a few central districts such as Idukki and Ernakulam display slight increases in rainfall over the same period. However, these upward trends are weak and do not attain statistical significance, indicating that while there may be some signs of stabilization or marginal recovery in certain areas, the evidence is not strong enough to confirm a definitive shift.
Overall, the spatial heterogeneity in rainfall trends points to a fragmentation of Kerala’s rainfall regime. The data suggest that while a number of districts, especially in the north and highlands, are experiencing long-term declines in precipitation, a smaller subset of central districts appears to remain relatively stable or may even be showing the early signs of rainfall recovery. This emerging spatial divergence has important implications for regional water resource planning, agricultural practices, and climate adaptation strategies, as it signals an increasingly uneven distribution of rainfall across the state.
The analysis of decadal average rainfall patterns, as illustrated in Figure 4, provides valuable insight into the long-term structural changes occurring within Kerala’s rainfall regime. By aggregating data over 10-year intervals, this approach effectively smooths out short-term interannual variability, allowing for clearer identification of persistent trends and regime shifts. The results underscore significant spatial and temporal heterogeneity in rainfall behavior across the state over the past seven decades.

District-wise decadal average rainfall (1951–2020). Source: Authors’ work using IMD data.
Among the districts, Wayanad continues to exhibit the most pronounced and consistent decline in rainfall, with a steep downward trajectory that becomes particularly evident beginning in the post-1980s period. This reinforces earlier findings from trend analysis, highlighting Wayanad’s vulnerability to sustained reductions in precipitation, likely linked to broader climatic shifts affecting the Western Ghats region.
Similarly, Thrissur and Thiruvananthapuram (Trivandrum) show persistent declines in rainfall across multiple decades. These declines are especially noticeable from the 1970s onward, indicating that the midland and southern portions of Kerala are undergoing a long-term drying process. The persistence of these reductions suggests a structural change rather than random variability, raising concerns about the reliability of water availability in these regions. Districts in the northern part of the state, particularly Kasargod and Kannur, display more gradual but steady declines in rainfall. Although the rates of reduction are less abrupt compared to Wayanad or Thrissur, the cumulative effect over successive decades points to a slow erosion of rainfall reliability in northern Kerala. These findings are consistent with broader trends of declining monsoonal strength observed across parts of peninsular India.
In contrast, central districts such as Idukki and Ernakulam show relatively stable rainfall patterns over the decades, with some evidence of slight increases in more recent periods. These areas appear to have avoided the more severe reductions seen elsewhere and may represent zones of relative climatic resilience. The broader central Kerala region, encompassing both midland and highland zones, displays a mixed pattern of decadal fluctuations but lacks a clear or consistent long-term downward trend. Taken as a whole, these decadal patterns reinforce a growing spatial contrast in rainfall behavior across Kerala, both in terms of latitude (north–south) and topography (ghat–coastal gradient). The most pronounced and persistent declines are concentrated in the ecologically sensitive Western Ghats and the southern districts, while parts of central Kerala exhibit greater stability and may even be experiencing modest gains. This emerging divergence suggests that future climate adaptation strategies will need to be spatially differentiated, with particular attention to vulnerable zones facing chronic rainfall deficits.
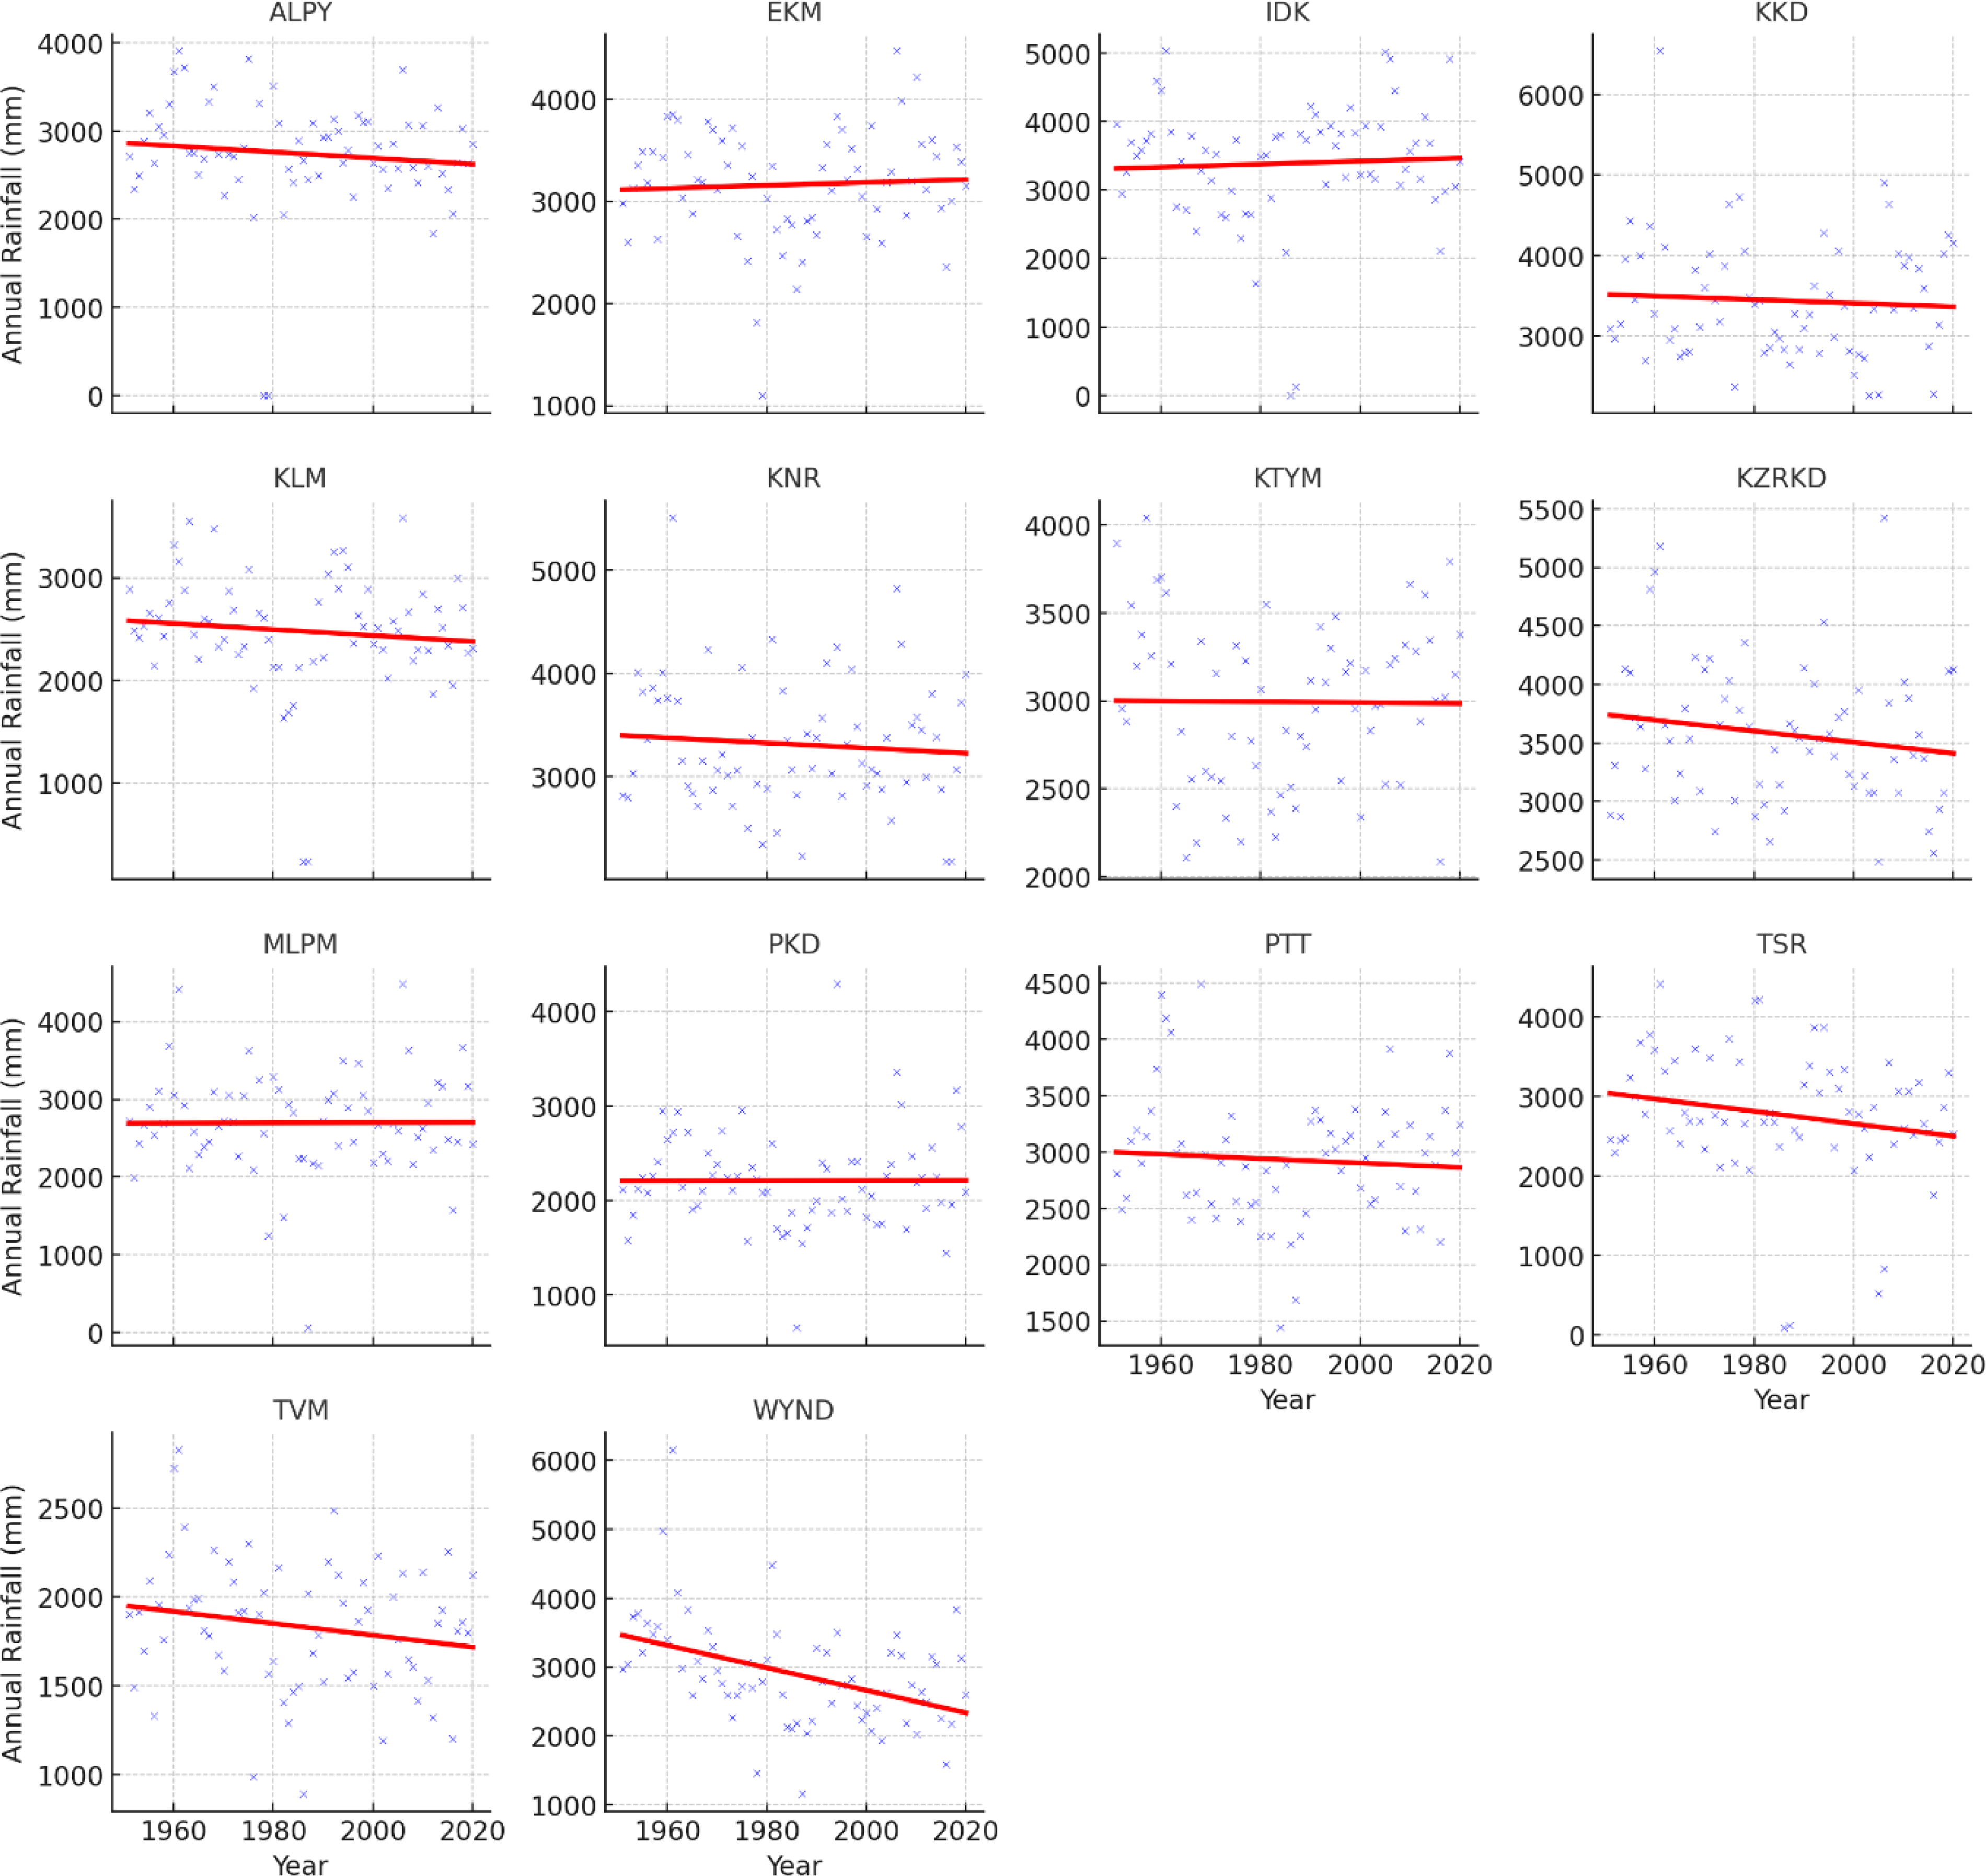
At the state level, the rainfall anomaly series (1951–2020, baseline 1951–1980) reveals a clear shift toward increasing rainfall deficits in recent decades. During the 1950s through the 1970s, most years were near or above the baseline average, suggesting relatively stable conditions (see Fig. 5). From the 1980s onward, however, negative anomalies became more frequent, marking the onset of a drying phase. This tendency strengthened in the 2000s and 2010s, which witnessed repeated drought years interspersed with a few extreme wet years, most notably the 2018 floods. Taken together, the Kerala-wide anomaly series points to rising variability and an overall increase in dry years since the 1980s.
Kerala-wide rainfall anomalies (1951–2020). Source: Authors’ own work.
District-level analyses confirm this divergence. Wayanad, Thrissur, and Trivandrum stand out with strong and persistent downward anomalies after the 1980s, indicating consistent long-term drying (see Fig. 6). Kasargod, Kannur, and Kozhikode also show a declining trajectory, though occasional wet years temporarily interrupt the downward trend. In contrast, Idukki and Ernakulam remain relatively balanced, with anomalies fluctuating around zero, reflecting stable conditions compared to other districts. Coastal southern districts such as Alappuzha and Kollam display more frequent deficits after the 1990s, highlighting emerging rainfall stress in these areas. Meanwhile, central districts including Malappuram, Palakkad, and Kottayam present mixed patterns, with weaker or less consistent downward trends than those observed in Wayanad and the southern districts. Overall, these findings confirm that rainfall deficits have become more frequent and persistent in several districts since the 1980s, particularly in the Western Ghats and southern coastal regions, underscoring their vulnerability to long-term drying.

District-wise rainfall anomalies (1951–2020—Baseline: 1951–1980). Source: Authors’ work using IMD data.
Extremes and droughts
The analysis of extreme rainfall months, defined using the 95th percentile thresholds from the 1951–1980 baseline, reveals important temporal patterns in Kerala’s hydro-climatic extremes (see Fig. 7). The Kerala-wide frequency curve, expressed as the share of districts experiencing at least one extreme month each year, shows clear decadal fluctuations. Extremes were relatively common during the 1960s and early 1970s but have declined in frequency since the 2000s. By the 2010s and 2020s, very few districts experienced months above the 95th percentile, indicating a reduction in widespread extreme events. A time-series graph provides the most effective visualization of these shifts, while detailed counts of extreme months by decade are better suited for supplementary tables.

Kerala-wide frequency of extremes, share of districts that had at least one ≥95th-percentile month each year. Source: Authors’ work using IMD data.
The observed decline in the frequency of extreme rainfall months in Kerala appears to differ somewhat from findings reported at the national scale. Several studies examining all-India rainfall extremes have documented an increase in short-duration, high-intensity rainfall events in recent decades (Goswami et al., 2006; Singh et al., 2014; Vittal et al., 2013). However, these studies primarily focus on sub-daily or daily rainfall extremes aggregated at broader spatial scales. In contrast, the present analysis evaluates monthly rainfall totals at the district level, which capture the occurrence of sustained wet months rather than short-lived high-intensity bursts. Therefore, the decline in extreme rainfall months identified in this study should be interpreted as a reduction in widespread prolonged rainfall extremes rather than a disappearance of intense rainfall events. Indeed, recent catastrophic floods in Kerala, particularly in 2018 and 2019, demonstrate that rare high-magnitude rainfall episodes remain possible despite a decline in the overall frequency of extreme months. These findings therefore suggest a shift toward less frequent but potentially more intense rainfall events, consistent with emerging evidence on changing precipitation regimes under climate variability.
The statewide drought index, computed as the average SPI-12 across all districts, captures the temporal clustering of droughts in Kerala. The SPI series (see Fig. 8) highlights recurrent drought years, including 1983, 1987, 2002, and 2016, interspersed with occasional wet anomalies. Since the 1980s, drought episodes have become more frequent, with prolonged negative SPI periods evident in the 2000s and 2010s. A continuous line graph of the SPI-12 time series effectively conveys this pattern, with drought thresholds (–1.0 and below) shaded to highlight critical periods of rainfall deficit. Tabular presentation is not essential here, as the spatially averaged index is best understood visually.
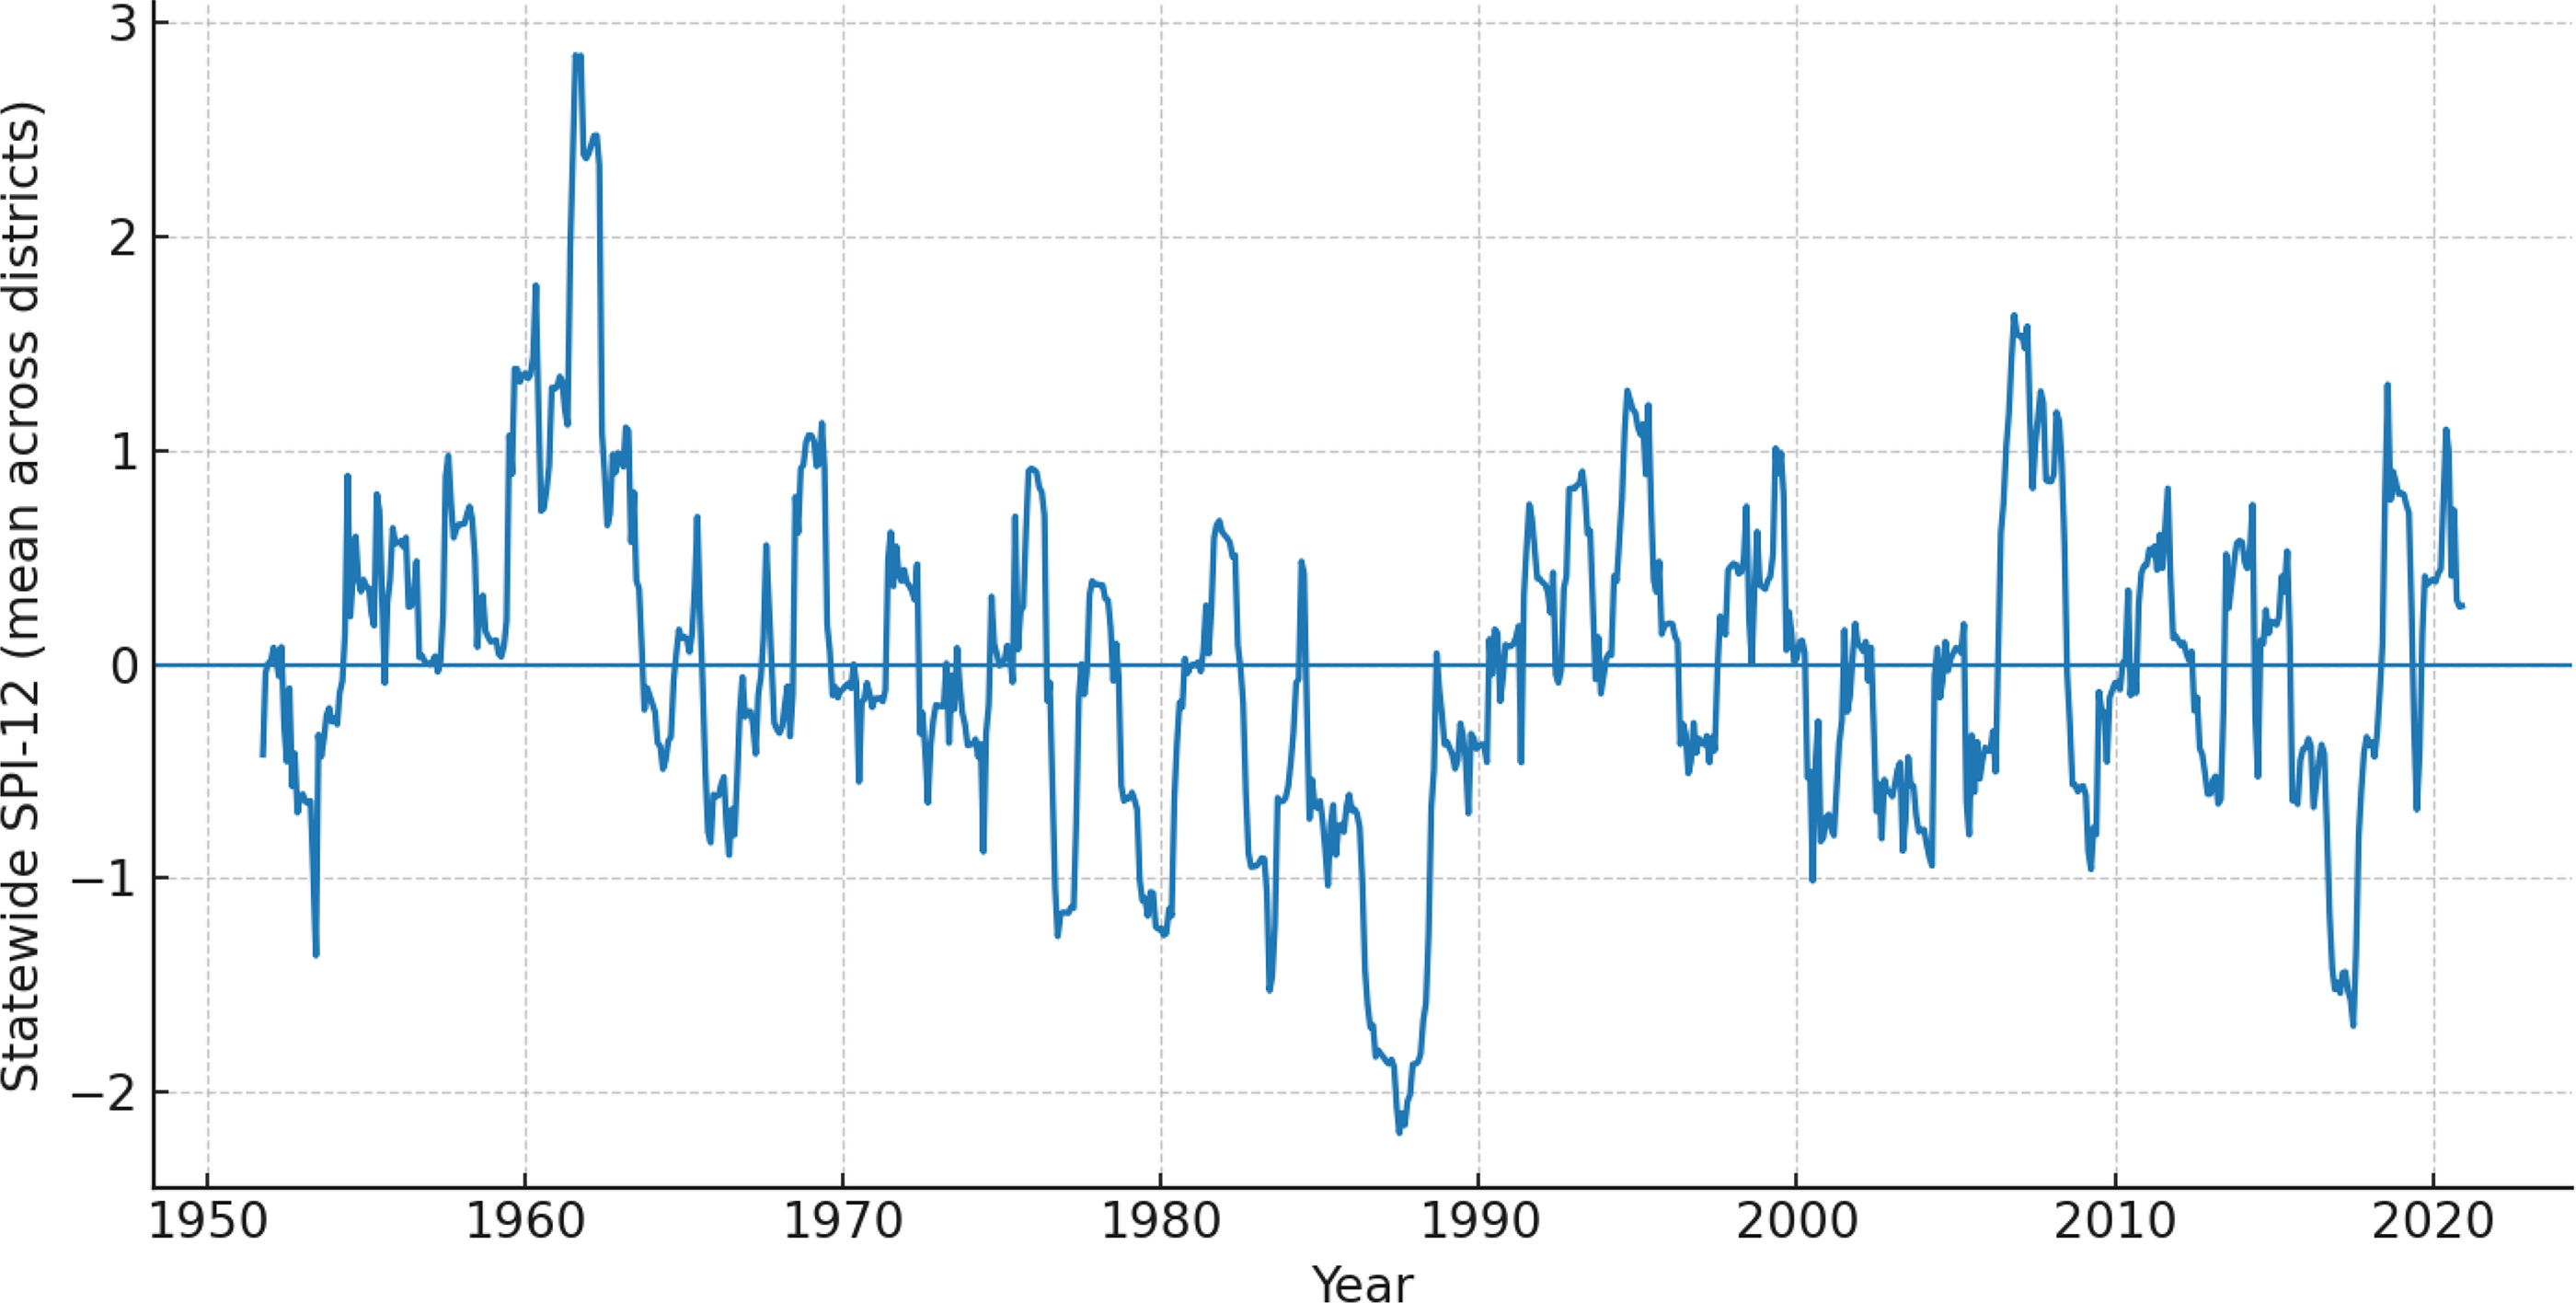
Kerala-wide Drought Index (SPI-12, Standardized—Month Rainfall). Source: Authors’ work using IMD data.
Return-period analysis further illustrates the extremity of rainfall events in individual districts. While the procedure was applied to all 14 districts, the results are presented here for Wayanad, which was selected as a representative case owing to its steep and statistically significant decline in rainfall (–163 mm per decade, p < 0.001) (see Fig. 9). As one of the most rainfall-dependent districts of the Western Ghats, Wayanad illustrates both the vulnerability and hydrological importance of highland regions. In Wayanad, the return-period plot of annual maxima shows that extreme totals such as the 1961 event (>6,000 mm) correspond to recurrence intervals on the order of 70 years. Subsequent high-rainfall years, including 2005 and 2018, fall within the 20- to 35-year return range. The fitted curve on log–linear scale indicates that, although the frequency of annual extremes has reduced in recent decades, their potential magnitude remains substantial. Taken together, these analyses show a dual signal: Widespread extreme months have declined since the 2000s, yet rare but very high-magnitude events remain possible, posing significant flood risks. At the same time, prolonged negative SPI trends highlight the intensification of drought frequency and duration, especially since the 1980s.

Return-period plot (Wayanad): Empirical annual maxima vs. return period (log scale). Source: Authors’ work using IMD data.
Drought analysis (SPI-12)
Drought frequency and intensity across Kerala were systematically assessed using the SPI with a 12-month accumulation period (SPI-12), which captures long-term hydrological stress related to cumulative rainfall deficits. This metric is particularly effective for identifying sustained drought conditions, making it a suitable tool for assessing both agricultural and water resource vulnerabilities at the district scale. The district-wise count of drought months—defined here as months with SPI values at or below –1.0—reveals considerable spatial heterogeneity in drought exposure across the state (Fig. 10). Among the districts, Kottayam recorded the highest number of drought months (147), indicating a persistent exposure to subnormal rainfall conditions. This was closely followed by Trivandrum (118 months), Wayanad (112), Pathanamthitta (111), Kasargod (120), and Ernakulam (107). These figures suggest that both southern districts and highland regions of the Western Ghats are recurrently affected by moderate drought conditions. In contrast, Kozhikode (98 months) and Kannur (97 months) recorded the fewest drought months among all districts, highlighting a relatively lower frequency of sustained rainfall deficits in the northern coastal zones.
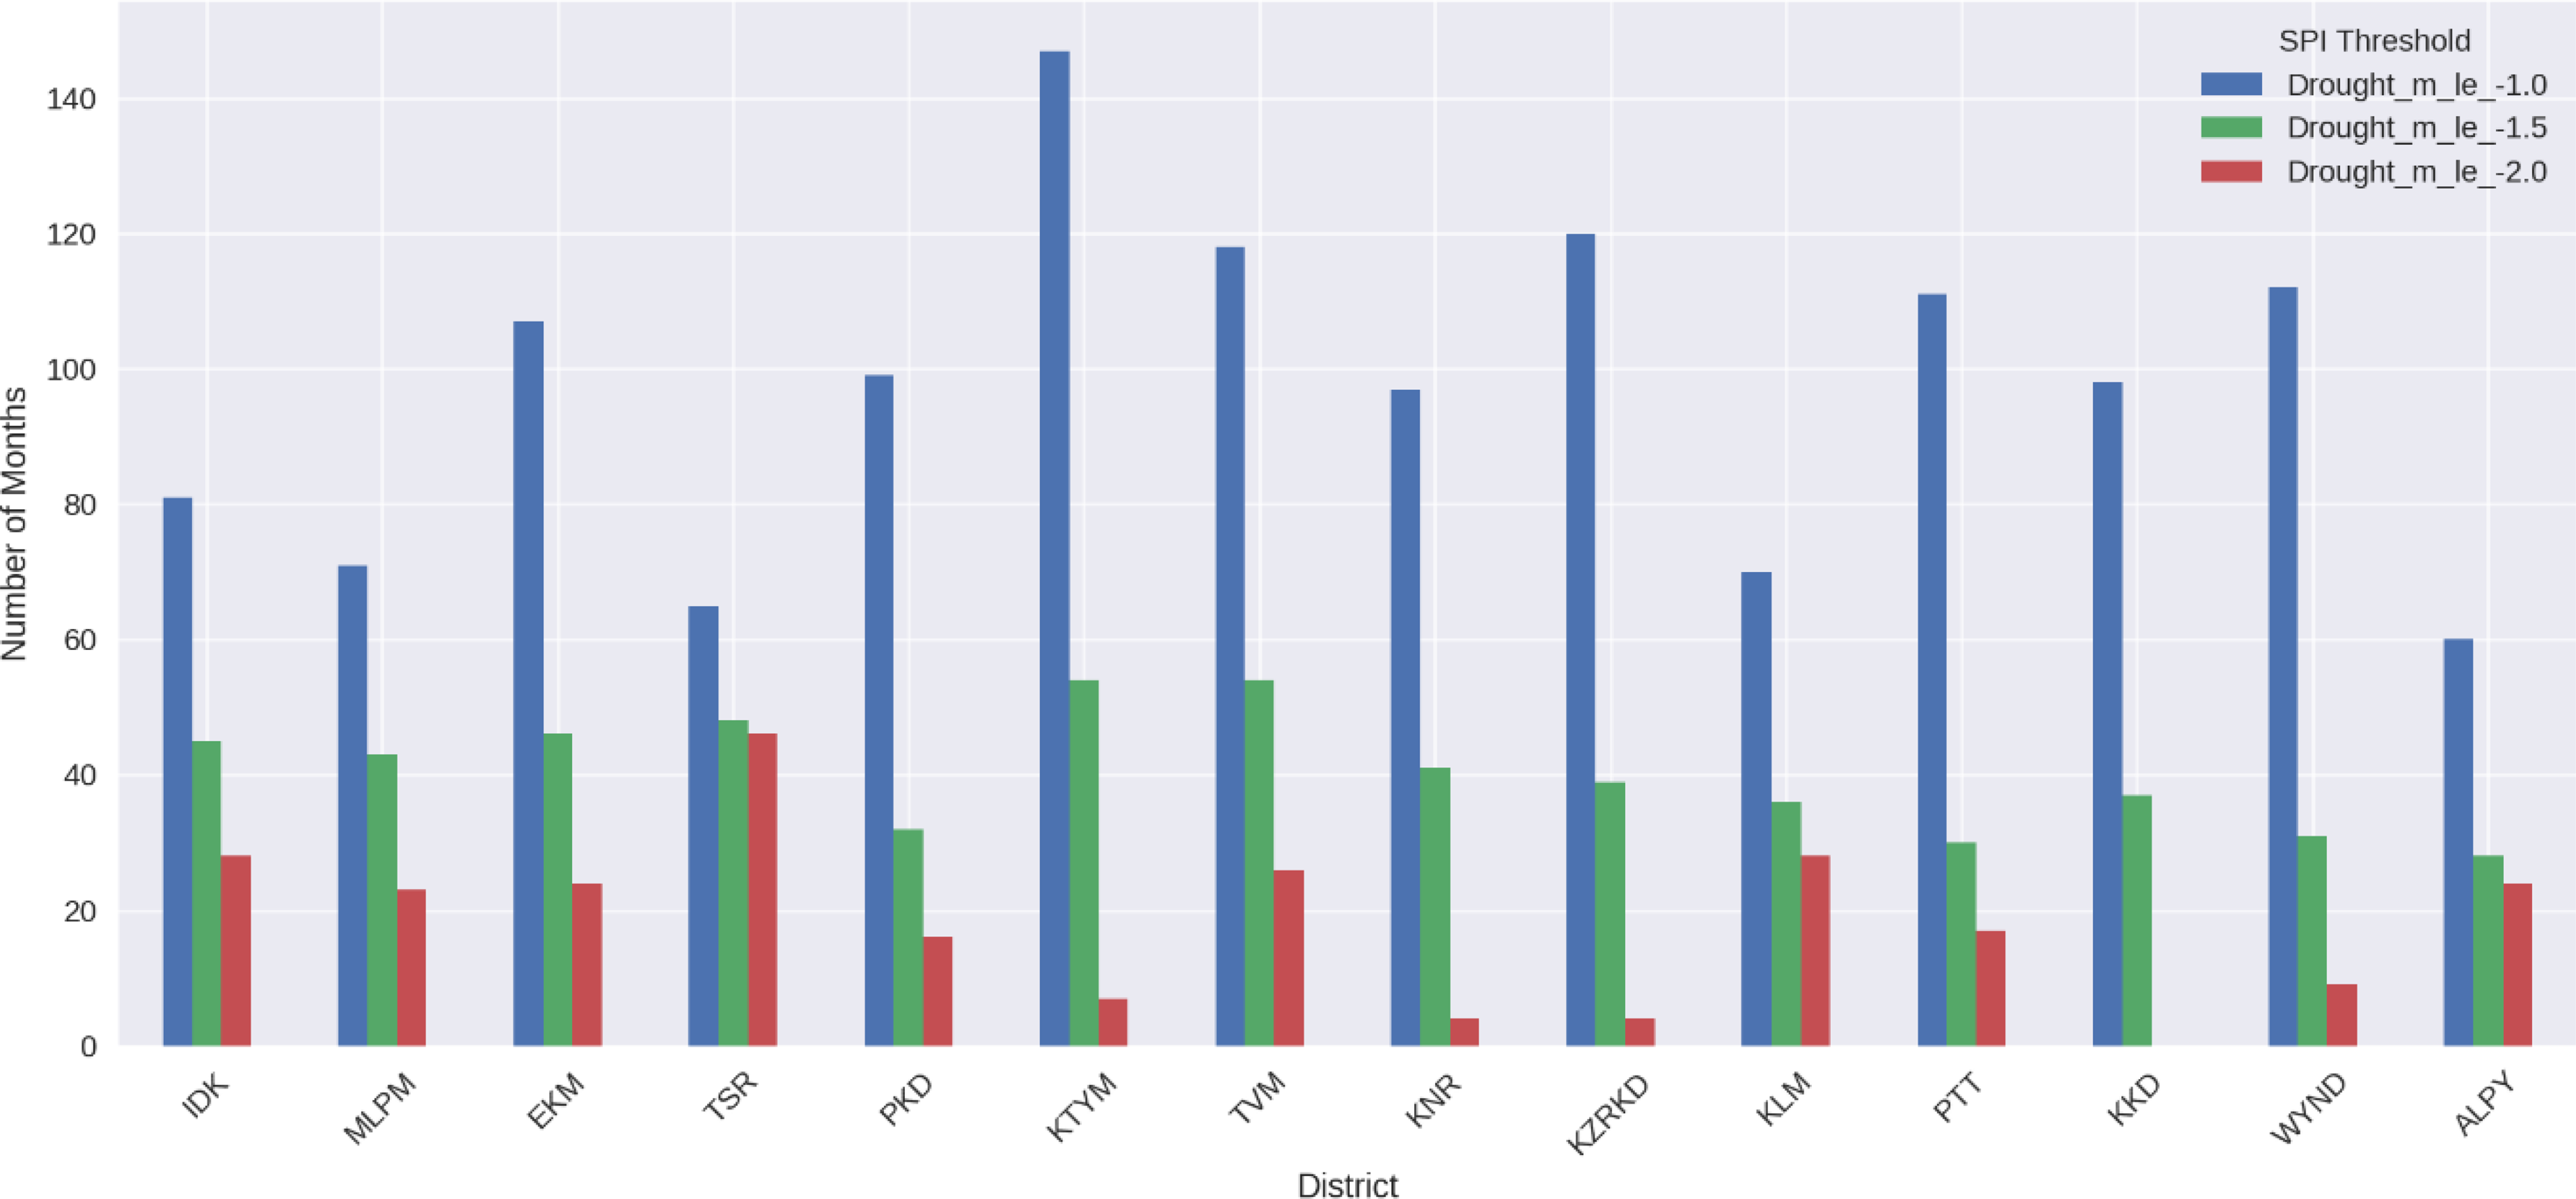
District-wise SPI-12 drought months (1951–2020). Source: Authors’ work using IMD data.
When drought severity is taken into account—defined here as months with SPI values at or below –2.0—distinct patterns of vulnerability become even more apparent. Thrissur stands out significantly, with 46 months of severe drought, the highest among all districts by a wide margin. This suggests an elevated susceptibility to extreme rainfall deficits in the district, which may be linked to specific regional climatic or topographic factors. Other districts with high counts of severe drought months include Trivandrum (26), Ernakulam (24), and Alappuzha (24), further confirming that central and southern regions of Kerala are particularly exposed to more intense drought episodes. In stark contrast, Kozhikode experienced no months of severe drought over the study period, while Kasargod and Kannur each recorded only four such months, reinforcing the relative climatic stability of the northern coastal belt with respect to extreme drought conditions.
To enable a more integrated comparison of both the frequency and severity of droughts across districts, a WDBI was developed and applied (see Fig. 11). This composite index assigns greater weight to more severe drought months, thereby providing a more holistic view of long-term drought vulnerability. The WDBI results reinforce the findings from individual SPI thresholds and further emphasize the spatial disparities in drought burden across the state. The most drought-affected districts, according to this index, are Trivandrum (0.362) and Thrissur (0.356), followed closely by Kottayam (0.329), Ernakulam (0.323), and Idukki (0.304). These districts, spanning both midland and highland terrain, are evidently subject to both frequent and severe droughts.

District-wise weighted drought burden (SPI-12, 1951–2020). Source: Authors’ work using IMD data.
Districts such as Malappuram, Kollam, Pathanamthitta, and Palakkad fall into a moderate drought burden category, with WDBI values in the range of 0.25 to 0.27. These areas may experience periodic drought conditions but with less consistency or severity than the high-burden districts. At the other end of the spectrum, the northern coastal districts—Kozhikode (0.205), Alappuzha (0.224), and Kannur (0.227)—exhibit the lowest weighted index values, indicating relatively lower vulnerability to long-term rainfall deficits. Taken together, the spatial patterns evident in both the SPI-based drought assessments and the WDBI underscore a distinct north–south and ghat–coastal gradient in drought risk across Kerala. Southern and central districts—particularly those located in the midlands and along the Western Ghats—consistently face higher drought frequency and severity, suggesting chronic exposure to hydrological stress. In contrast, northern coastal districts appear to benefit from relatively more stable rainfall regimes, positioning them as less vulnerable to prolonged droughts. This spatial differentiation in drought vulnerability carries direct implications for climate adaptation planning, agricultural risk management, and water resource allocation. Targeted drought preparedness strategies—such as early warning systems, irrigation infrastructure investment, and localized drought contingency plans—will be especially critical for high-burden districts. As climate variability intensifies, recognizing and responding to these regional disparities will be essential to building long-term resilience in Kerala’s water and agricultural systems.
Risk ranking and dashboard
To prioritize districts for climate risk management, a composite rainfall risk ranking was developed by integrating two key indicators: (i) post-1980 extreme-month frequency, defined as the number of months exceeding the 95th-percentile thresholds from the 1951–1980 baseline, and (ii) the WDBI derived from SPI-12. Each district was ranked separately on extremes and droughts, and the composite rank was calculated as the average of the two. This approach ensures that both short-term rainfall surpluses and prolonged deficits are captured within a unified risk framework. The composite results reveal a clear spatial hierarchy of risk. The highest risk districts are Idukki, Malappuram, Ernakulam, Thrissur, and Palakkad, reflecting a combination of frequent extreme events and substantial drought exposure. Moderate-risk districts include Wayanad, Kasargod, Kannur, and Kollam, which face either elevated drought stress or moderate extreme-event frequency. At the lower end of the spectrum, Kozhikode and Alappuzha emerge as the least vulnerable, with comparatively fewer extreme rainfall months and lower drought burdens.
Equal weighting was applied to the extreme-event frequency indicator and the WDBI when constructing the composite risk score. This choice reflects a neutral aggregation strategy in the absence of strong empirical justification for prioritizing one hazard dimension over the other. Both indicators represent distinct but complementary forms of hydro-climatic stress: short-term rainfall surpluses associated with flood risks and prolonged rainfall deficits associated with drought impacts. While alternative weighting schemes could produce minor variations in district rankings, the equal-weight approach provides a transparent and balanced representation of rainfall-related climate risk.
To communicate these findings in an integrated way, a Kerala-wide rainfall risk dashboard was prepared (Fig. 12). The dashboard consolidates the top five districts ranked by extreme-month frequency, the top five by drought burden (SPI-12), the statewide SPI-12 mean series (1951–2020) showing temporal clustering of droughts, the annual share of districts recording ≥95th-percentile rainfall months, and an annotation of the top three districts in terms of composite risk.

Kerala rainfall risk dashboard (1951–2020). Source: Authors’ work using IMD data.
This integrated analytical framework reinforces a critical insight: rainfall-related risks in Kerala are spatially uneven and highly differentiated across districts. Rather than experiencing a uniform climate trajectory, the state faces a dual challenge in which distinct regions are exposed to different, often overlapping, types of hydro-climatic stress. Highland districts such as Idukki, for example, are uniquely vulnerable as they experience both extreme rainfall events—which pose risks of flash floods and landslides—and prolonged droughts, which strain water resources and ecosystems. Meanwhile, central districts such as Thrissur and Palakkad face chronic rainfall deficits and increasingly persistent drying trends, contributing to long-term agricultural vulnerability and groundwater stress.
The district-level risk dashboard developed in this study offers a practical and evidence-based tool for local policymakers, disaster management authorities, and water resource planners. By integrating multiple dimensions of rainfall variability—trends, extremes, drought frequency and severity, and return-period analyses—the dashboard allows for targeted adaptation planning. It supports district-specific prioritization of climate-resilient investments in water infrastructure, agricultural planning, and disaster preparedness. Such a tool is particularly crucial in Kerala’s context, where interdistrict disparities are widening and historical climate assumptions are no longer reliable guides for future risk.
This comprehensive assessment of Kerala’s rainfall dynamics from 1951 to 2020 confirms the underlying structure of the state’s double monsoon climatology, influenced by both the SWM and NEM. However, it also reveals an unmistakable trend toward increased spatial and temporal fragmentation of rainfall. Trend analysis shows a statistically significant and steep decline in Wayanad (–163 mm per decade, p < 0.001), highlighting acute vulnerability in the Western Ghats. Thrissur and Thiruvananthapuram (Trivandrum) also display downward trends, although these are less steep and do not meet conventional significance thresholds. In contrast, Idukki and Ernakulam show slight positive trends, though these increases are weak and statistically insignificant, suggesting localized microclimatic effects or variability rather than a broader recovery.
Decadal rainfall averages and anomaly patterns further reinforce these findings, pointing to persistent drying trends since the 1980s, especially across the Ghats and southern Kerala. The decline in extreme rainfall months (≥95th percentile) after 2,000 marks a notable shift in Kerala’s rainfall regime—fewer districts now experience widespread extreme events. However, return-period analysis for highland districts such as Wayanad shows that rare but high-magnitude rainfall events (e.g., >6,000 mm/year) remain possible, occurring at multi-decadal intervals, and continue to pose severe flood risks. Drought dynamics, assessed through the SPI-12, reveal further layers of risk. Trivandrum, Thrissur, Ernakulam, and Kottayam emerge as districts with the heaviest long-term drought burdens, based on both frequency (SPI ≤ –1.0) and severity (SPI ≤ –2.0). Districts such as Palakkad, Malappuram, and Wayanad fall into a moderate drought vulnerability category but are nonetheless susceptible to prolonged rainfall deficits. The WDBI, which integrates both frequency and severity, supports these findings and confirms the elevated drought risk in southern and central districts.
Bringing together all indicators, trends, anomalies, drought burden, extreme events, and return periods, a composite risk ranking was developed to identify the most climate-vulnerable districts in the state. The analysis identifies Idukki, Malappuram, Ernakulam, Thrissur, and Palakkad as Kerala’s top five high-risk districts, based on their exposure to multiple dimensions of rainfall variability and extremes. Collectively, these findings paint a complex and concerning picture of Kerala’s evolving rainfall regime. The state’s hydro-climate is becoming increasingly variable, less predictable, and more spatially fragmented. The Western Ghats, long regarded as Kerala’s water tower, are experiencing the fastest rates of drying, threatening river flows, groundwater recharge, and ecosystem stability. The southern coastal districts are showing signs of intensifying drought stress, while parts of central Kerala remain comparatively stable, though not immune to long-term changes.
This dual reality of increasing drought frequency alongside episodic but catastrophic flood events poses a significant challenge for sustainable development and climate resilience in the state. It underscores the urgent need for anticipatory, district-specific adaptation strategies that address both ends of the hydro-climatic spectrum. Effective responses will require a combination of early warning systems, climate-smart agriculture, water conservation infrastructure, and integrated disaster risk governance tailored to the unique vulnerabilities of each district. As Kerala continues to face an uncertain climatic future, evidence-based, localized action will be key to safeguarding livelihoods, ecosystems, and long-term water security.
Conclusion
This study provides a comprehensive district-level assessment of rainfall variability, extremes, and drought risks across Kerala over the period 1951–2020. The analysis confirms Kerala’s characteristic double-monsoon climatology dominated by the SWM with a secondary contribution from the NEM. Trend and anomaly analyses reveal increasing spatial divergence in rainfall behavior across districts, with a statistically significant decline observed in Wayanad and weaker downward tendencies in several other districts. Decadal and anomaly analyses further indicate a shift toward more frequent rainfall deficits since the 1980s. Extreme rainfall analysis suggests that the frequency of months exceeding the 95th percentile threshold has declined in recent decades. However, return-period analysis demonstrates that rare but high-magnitude rainfall events remain possible, implying continued exposure to flood risks. At the same time, SPI-12 drought diagnostics highlight persistent drought vulnerability in several southern and central districts.
By integrating extremes and drought indicators, the composite risk assessment identifies Idukki, Malappuram, Ernakulam, Thrissur, and Palakkad as the most climate-sensitive districts. These findings highlight the growing spatial fragmentation of Kerala’s rainfall regime and underscore the need for district-specific climate adaptation strategies focused on water security, agricultural resilience, and disaster preparedness.
Despite providing a comprehensive district-level assessment of rainfall variability, this study has certain limitations. First, the analysis focuses exclusively on rainfall and does not incorporate temperature, evapotranspiration, or soil moisture variables that may influence drought severity. Second, hydrological data such as river discharge and reservoir levels were not included, which may further refine flood risk assessments. Third, although IMD datasets undergo quality control, long-term station density and observational practices may vary across districts and decades. Finally, the use of a fixed historical baseline assumes partial climatic stationarity, which may not fully capture evolving rainfall dynamics under climate change.
Ethical Considerations
Ethical approval was not required, as the study did not involve human participants.
Authors’ Contributions
S.I.: Conceptualization, methodology, formal analysis, and writing original draft. H.K.C. Conceptualization, data acquisition, and writing review of literature. M.K.C.: Conceptualization, formal analysis, and editing original draft.
Footnotes
Acknowledgment
The authors are grateful to Habeebrahman H for his insightful suggestions.
Data Availability
The data that support the findings of this study are available from the corresponding author upon reasonable request.
Author Disclosure Statement
The author(s) declared no potential conflicts of interest with respect to the research, authorship, and/or publication of this article.
Funding Information
The authors did not receive any funding for this research.