
Abstract
The aim of this study is to examine mastery of the percentage concept among Japanese and Finnish lower secondary school students. This research developed from a long-standing collaboration between Japanese and Finnish researchers, reflecting a shared interest in students’ percentage mastery at this educational level. The primary justification for this comparative study design between Finland and Japan is rooted in the curricular differences between the two countries. The questionnaire of the study comprised six problems, based on a theoretical framework that defines the process descriptions required to solve the problems and the various multimodal approaches that students use to present their solutions. The problems were identical for both Japanese and Finnish students. The main findings indicated that students’ proficiency levels increased from grade 7 to grade 9 in both countries. Conversely, significant differences in the proportion of correct answers were observed, reflecting variations in the curricula and treatment of instructional content between the two countries. The typical errors observed in percentage problems common to both countries were primarily attributable to the incorrect identification of the base quantity. In addition, the multimodal skills essential for solving percentage problems were not necessarily sufficient in either country.
Introduction
The aim of this study is to examine mastery of the percentage concept among Japanese (N = 1,132) and Finnish students (N = 1,112). This study stems from a long-standing collaboration between Japanese and Finnish researchers and a shared interest in understanding percentage mastery at the lower secondary school level. A primary justification for this comparative study between Japan and Finland lies in the curricular differences between the two countries.
According to the Japanese curriculum (Japanese MEXT, 2017), the concept of “1%” is introduced in primary school mathematics in the fifth grade. By lower secondary school, students are expected to have already mastered the fundamentals of percentage, which are subsequently applied in tasks involving equations, probability, and statistics. In contrast, the Finnish Core Curriculum introduces the percentage concept between grades 3 and 6 in primary school; however, it is not required for the final assessment at the end of grade 6 (Finnish National Board of Education, 2016). In Finland, the formal teaching of percentage is concentrated in grades 7 to 9, with mastery of the concept emphasized in the end-of-grade assessment criteria for these years.
These differences in the timing of percentage instruction across Japan and Finland raise important questions from a developmental psychology perspective, particularly regarding potential differences in mathematical thinking—such as multimodal expressions of percentages—between students in these two countries. More broadly, comparative studies are valuable in exploring the conditions and limitations of didactic phenomena (Artigue & Winsløw, 2010; Beck Tonnesen, 2024), as they provide insights that are both context-specific and generalizable. The purpose of this international comparison is to enhance our understanding of the similarities and differences in how Japanese and Finnish students express their mathematical thinking in multimodal ways when working with percentages and the closely related concept of ratios. Furthermore, differences in the timing of percentage instruction provide an opportunity to examine how mathematical thinking about percentages is expressed and to assess the role of instructional timing in students’ conceptual understanding at different grade levels.
Parker and Leinhardt (1995) identified four key reasons as to why the percentage concept is challenging to teach and learn. Its meaning has evolved and it has acquired multiple interrelated interpretations. Originally, percentage served as a straightforward practical expression—“so many of this for 100 of that”—but has since developed into a mathematical language encompassing proportional comparisons and rational functions. Over the past century, percentage has also gained significant social relevance. Alongside this development, various computational shortcuts and conversions have emerged, creating the misleading impression that a percentage is merely a decimal or fraction.
The complexity of the percentage concept arises from its multiple meanings, both in mathematics and in everyday life. As mathematical language is highly concise, it does not always align seamlessly with natural language. In the context of percentage, mathematical expressions are often connected to other mathematical domains, such as fractions, decimals, and multiplication, which can make their meanings in natural language and daily life difficult to grasp. Additionally, linguistic expressions such as “more than,” “less than,” “increased by,” and “decreased by” can obscure the multiplicative nature of percentage, further complicating its comprehension (cf. Guerreiro & Serrazina, 2017; Parker & Leinhardt, 1995; Tian & Siegler, 2018).
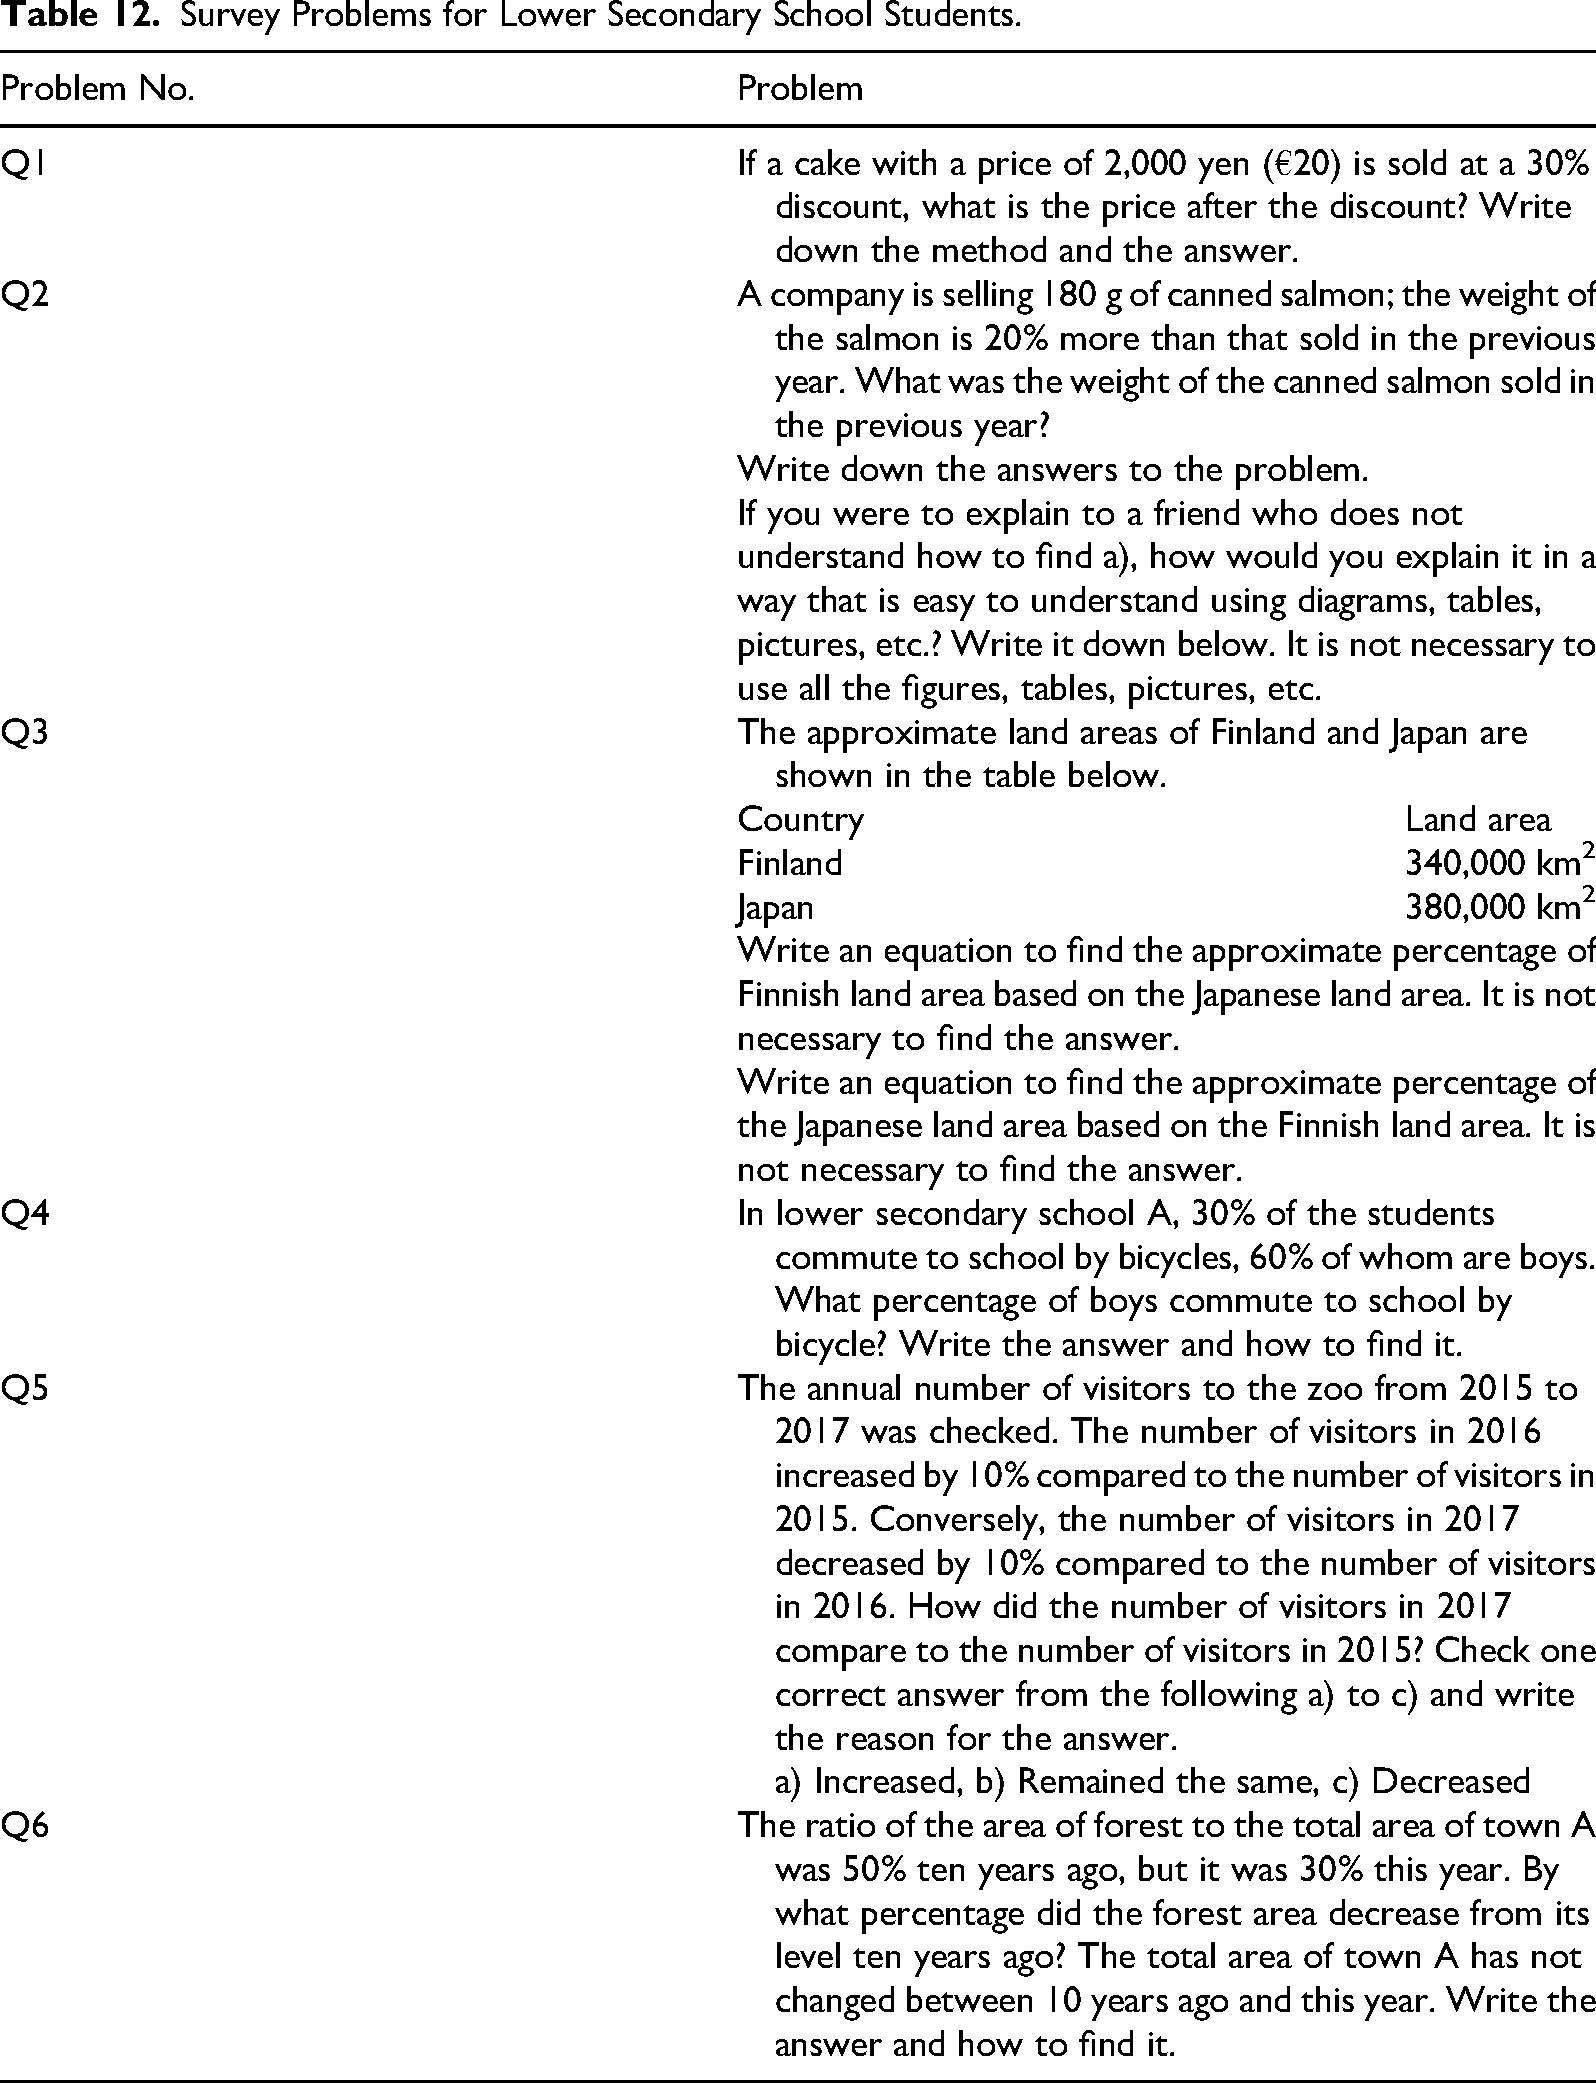
This study aims to investigate how Japanese and Finnish lower secondary school students understand the percentage concept, how they express their solutions to percentage problems, and what types of errors they make when solving problem Q2 of the questionnaire (Table 12, Appendix A). The next section presents the theoretical framework of the study. First, we outline the curricular aspects of percentage instruction in Japan and Finland. Second, we examine the percentage concept in school mathematics, focusing on its mathematical meanings and the difficulties students encountered when solving percentage-related problems.
Core curriculum in Japan and Finland
The educational systems of Japan and Finland are similar (Kumakura, 2013). In Japan, 6 years of primary school and 3 years of lower secondary school constitute compulsory education, while upper secondary school lasts for 3 years. In contrast, in Finland, 9 years of comprehensive school constitute compulsory education, and upper secondary school lasts for 3 years. (However, it should be noted that the 3 years of upper secondary school also became part of compulsory education in Finland from 2021, after the implementation of the survey for this study.)
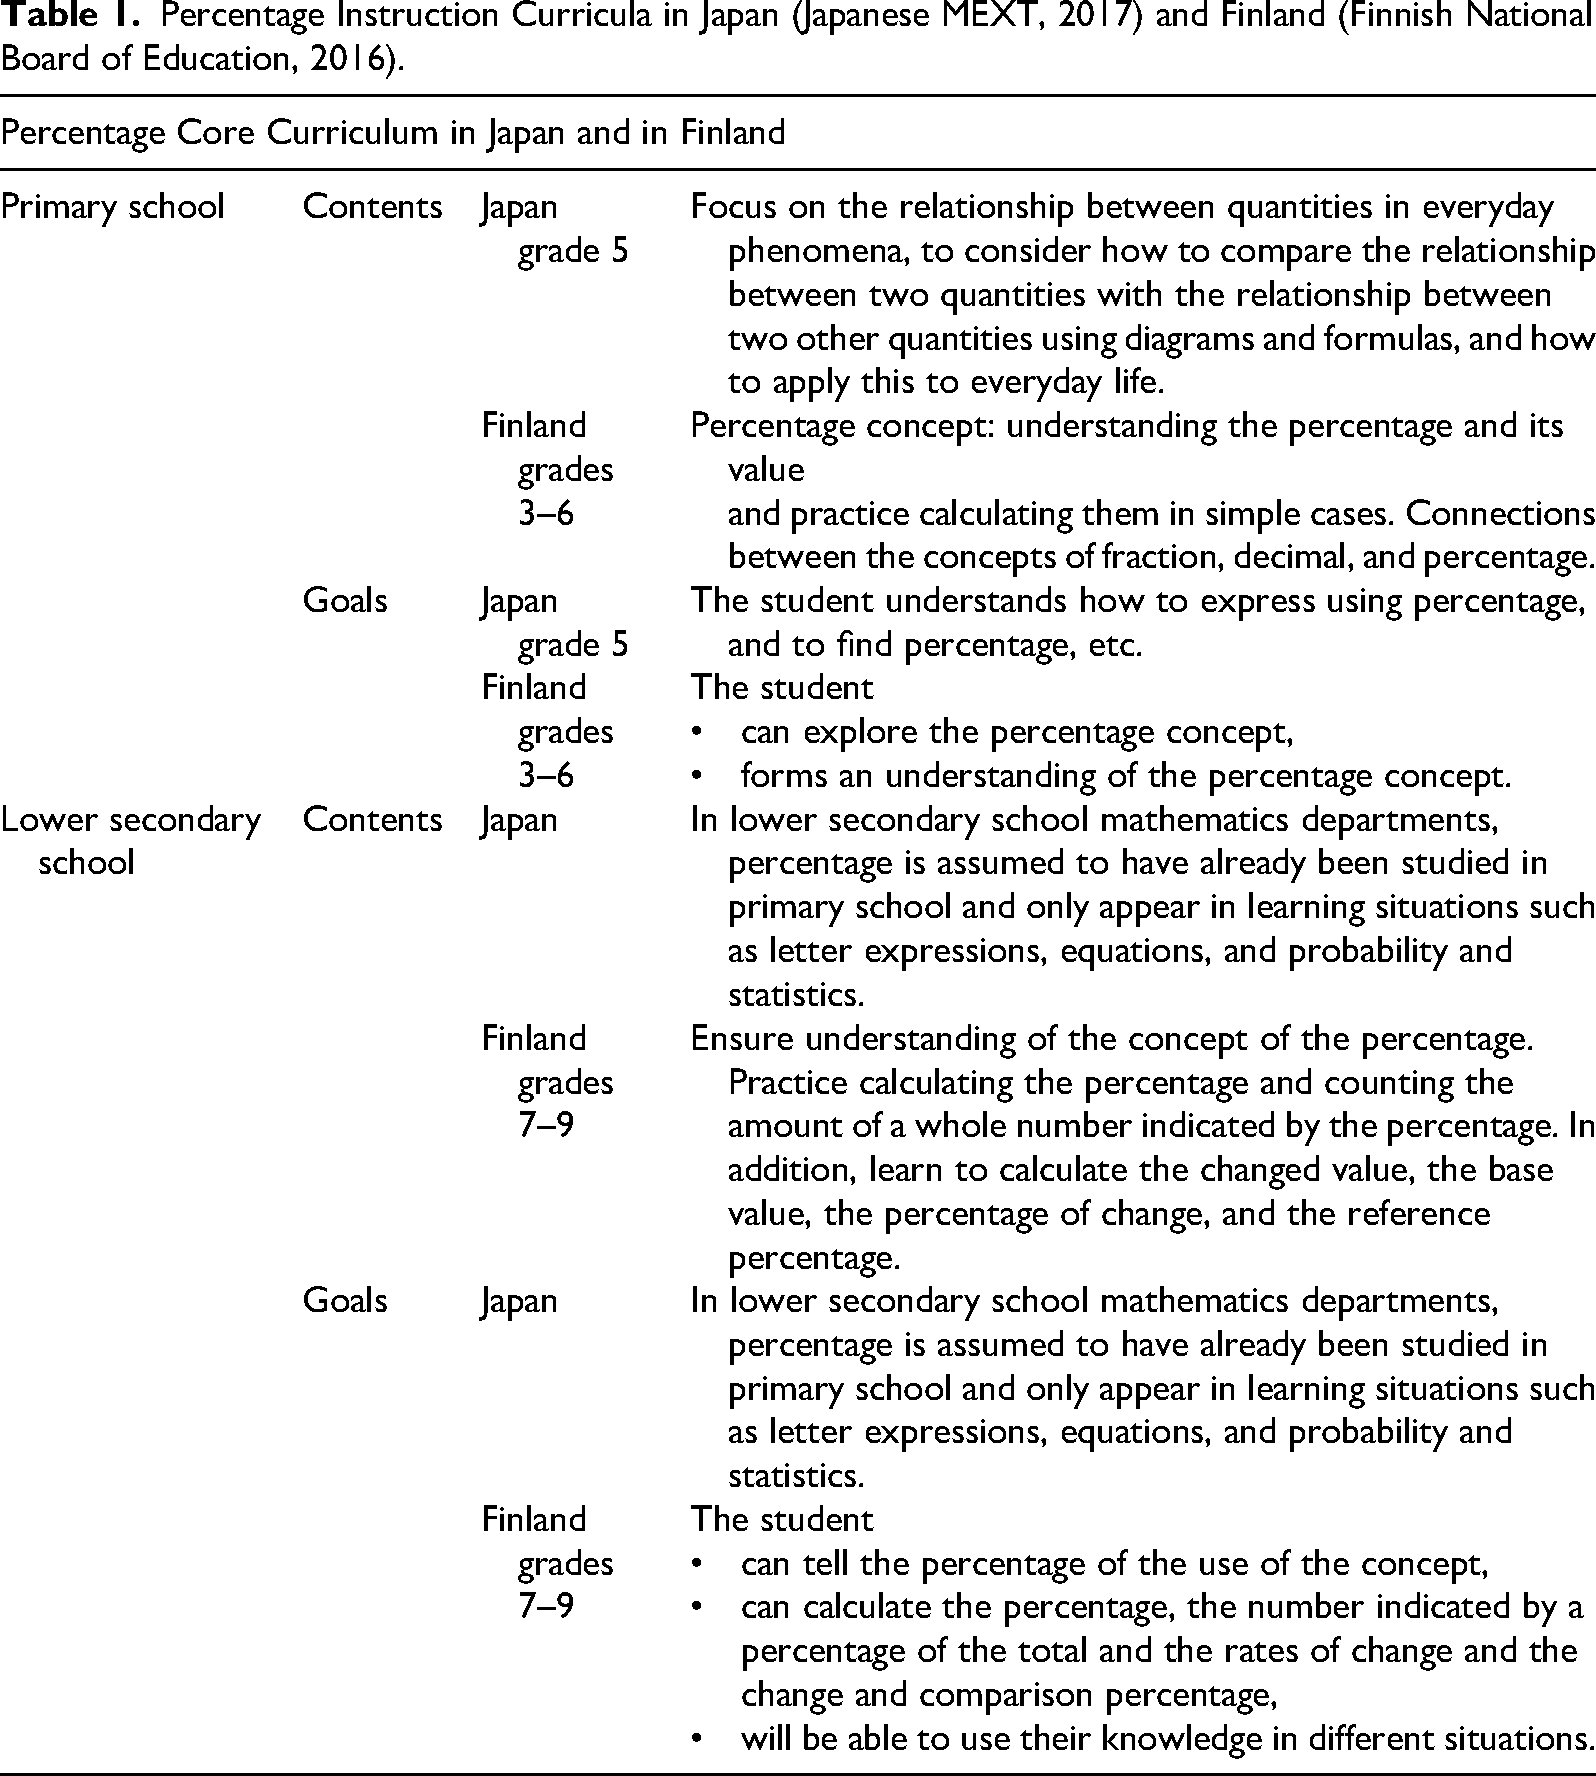
On the other hand, the Japanese and Finnish curricula differ in their approach to teaching the percentage concept. In Japan, before introducing percentage, students are first taught to express the relative magnitude of comparative quantities using whole numbers (grade 4) and decimals (grade 5), with the base quantity regarded as 1 (Japanese MEXT, 2017). According to the Courses of Study published in 2017, percentage instruction is formally introduced in the 5th-grade mathematics curriculum (see Table 1). In lower secondary school mathematics, percentage is assumed to have already been mastered in primary school and is primarily applied in topics such as algebraic expressions, equations, probability, and statistics.
Percentage Instruction Curricula in Japan (Japanese MEXT, 2017) and Finland (Finnish National Board of Education, 2016).
Percentage Instruction Curricula in Japan (Japanese MEXT, 2017) and Finland (Finnish National Board of Education, 2016).
In contrast, in Finland, percentage instruction is integrated into both primary school (grades 3–6) and lower secondary schools (grades 7–9), as outlined in the National Core Curriculum for Basic Education 2014 (Finnish National Board of Education, 2016).
Table 1 provides an overview of the content and learning objectives related to percentage instruction in Japanese (Japanese MEXT, 2017) and Finnish (Finnish National Board of Education, 2016) curricula.
The Japanese curriculum places a strong emphasis on the understanding of mathematical concepts. For example, in teaching the percentage concept, the curriculum first defines “ratio” as a quantity representing how much one quantity corresponds to when the other quantity is regarded as 1, and then defines 1% as 0.01, which represents that ratio (Kumakura et al., 2021).
However, the Finnish curriculum, from preprimary to upper secondary school, places a strong emphasis on the use of multimodal expressions in mathematics education. This approach allows both students and teachers to express mathematical thinking through manipulative or embodied representations, drawings or visualizations, natural language, and the symbolic language of mathematics. For example, the Finnish National Core Curriculum for Basic Education 2014 (Finnish National Board of Education, 2016) emphasizes the importance of students’ abilities to convey their mathematical reasoning and meaning-making through multimodal expressions, particularly in the final assessment of percentages in grades 7–9. The focus is on fostering conceptual understanding and promoting multimodal expressions in mathematical thinking, which contribute to the long-term sustainability of mathematics learning (cf. Joutsenlahti & Perkkilä, 2019).
To provide a more specific comparison of the percentage of core curricula in both countries, we selected one widely used Japanese mathematics textbook (Fujii et al., 2020) and two Finnish textbooks—one for primary (Häkkinen et al., 2020) and one for lower secondary school (Hassinen et al., 2018). Table 2 presents the results of the content analysis, including the chapter titles, number of sections, total page counts, and examples for each textbook.
Textbook Representation of the Curriculum in Japan and in Finland.
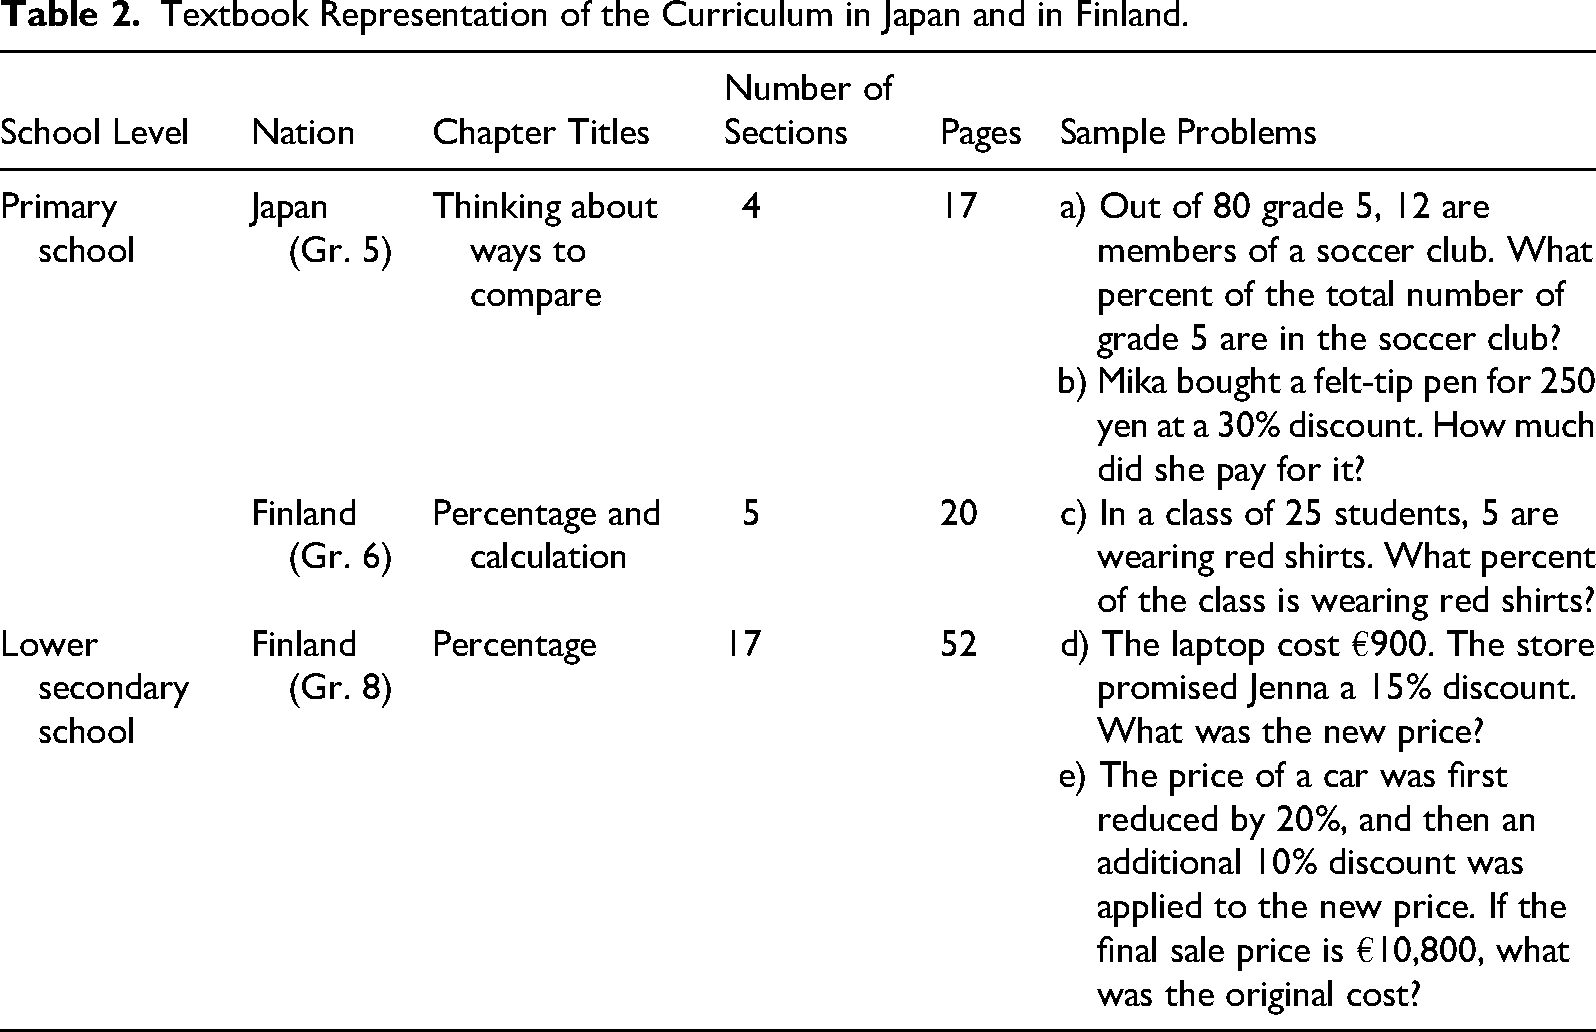
Japanese primary school textbooks cover a comprehensive range of topics, from basic percentage concepts to various applied problems (e.g., sample problems a and b in Table 2). In contrast, Finnish primary school textbooks focus primarily on establishing a fundamental understanding of the percentage concept (e.g., sample problem c in Table 2). At the lower secondary level, however, Finnish textbooks include a vast number of applications, encompassing and building upon primary-level content (e.g., sample problem d in Table 2), and even introducing topics not covered in the Japanese curriculum (e.g., sample problem e in Table 2). This structural difference explains the significantly larger number of pages allocated to this topic in Finnish secondary-level textbooks.
The percentage concept
Traditionally, the percentage is a fraction (a real number within the interval [0,1]) expressed in hundredths; from the Latin per centum (Lawrence et al., 2017). Parker and Leinhardt (1995) list six characteristics of percentage with diverse meanings: rational number, intensive quantity, fraction, ratio, statistics, and function. Among the above meanings, the following are relevant for this study: rational number, fraction, and ratio.
The mathematical notation of “p percent” is often presented as
Notation (1) allows for multiple mathematical interpretations. In school mathematics, students typically learn percentage as fractions, which can be understood in two ways: as a part–whole relationship (“p parts out of one hundred”) or as a fractional part of a given whole (“p hundredths of a given quantity”) (Joutsenlahti & Perkkilä, 2024; Pantziara & Philippou, 2012; Stewart, 2005).
Historically, researchers have defined percentage by interpreting the percent symbol as denoting hundredths or as representing a quantity per hundred (e.g., Hibbard, 1955; McGivney & Nitschke, 1988; Volpel, 1954). The rational number interpretation of percentage is particularly significant because percentage can be converted into rational numbers and follow standard computational rules. For example:
Another crucial interpretation relevant to this study is the role of percentage as ratios, which describe comparisons between two quantities (see Joutsenlahti & Perkkilä, 2024). Depending on the nature of the relationship between these quantities, three types of comparisons can be identified: (1) comparison between two distinct sets (e.g., the number of students in School A vs. School B), (2) comparison of different attributes within the same set (e.g., the length and width of a blackboard), and (3) comparison of the same set across different time points (e.g., past vs. present prices) (Parker & Leinhardt, 1995).
Difficulty of percentage
Compared with research on the development of the understanding of fractions and decimals, relatively little research has been conducted on the comprehension of percentage. Much of the existing knowledge on this topic originates from studies conducted more than 70 years ago, in the 1940s. This is particularly surprising given the significant role that percentages play in everyday life. For instance, percentage is widely used to indicate fabric composition (e.g., 100% cotton), mixing ratios of materials, and price reductions (e.g., 30% discount).
A poor understanding of fractions, decimals, and related concepts such as rational numbers is common not only among students but also among adults. Similar to the difficulties encountered with fractions and decimals, students and adults often struggle to grasp the percentage concept and face challenges in solving percentage-related problems (Jacobs et al., 2017; Joutsenlahti & Perkkilä, 2024; Mula & Hodnik, 2020; Parker & Leinhardt, 1995; Scaptura et al., 2007; Tian & Siegler, 2018; van den Heuvel-Panhuizen, 2003; van Galen & van Eerde, 2013).
Tian and Siegler (2018), referring to Lembke and Reys (1994), discussed students’ understanding of percentages and the arithmetic operations associated with them. Lembke and Reys (1994) conducted a survey on percentages among American 5th, 7th, 9th, and 11th graders, and found the following: 5th and 7th graders who had not yet been formally taught percentage employed a variety of strategies to solve percentage-related problems. In contrast, 9th graders, having learned the equation method, predominantly relied on this approach, while 11th graders used more efficient strategies. These included first determining the quantity corresponding to 1% and then calculating the quantity equal to 100%, as well as employing equations.
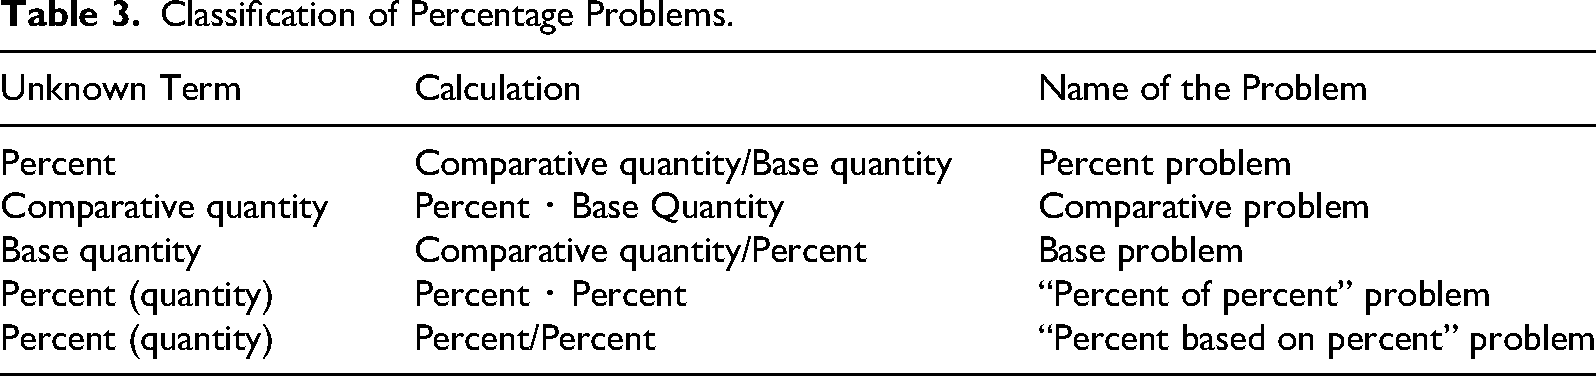
Table 3 presents a classification of percentage problems based on percent multiplication and division, as well as problems involving percent-of-percent calculations and percentage-based relationships. This classification framework was also applied in the present study to categorize percentage calculation problems.
Classification of Percentage Problems.
Classification of Percentage Problems.
The fundamental problems where two of the three values—the percentage, base quantity, and comparative quantity—are known and the remaining value is to be found, are sequentially called Percent problem, Comparative problem, and Base problem.
In contrast, “Percent of percent” problems and “Percent based on percent” problems are found in the Finnish textbook (Table 4).
“Percent of Percent” Problem and “Percent Based on Percent” Problem in Finnish Textbook in Grades 8 and 9 (Hassinen et al., 2018).
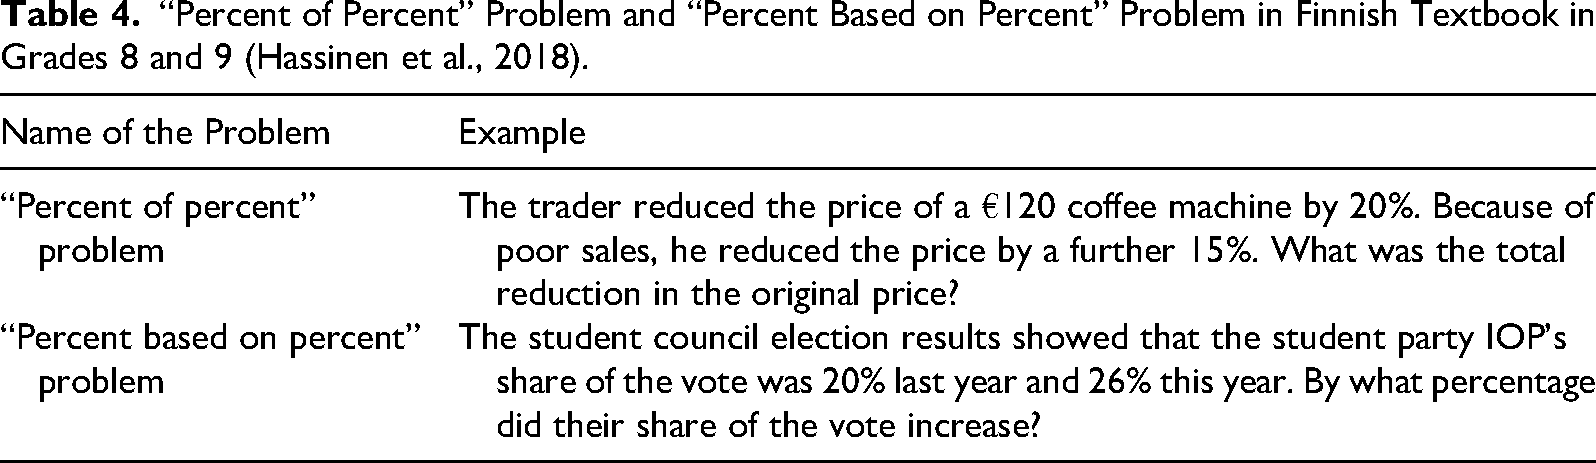
In the “Percent of percent” problem in Table 4, the solution could be seen by the expression
In the “Percent based on percent” problem in Table 4, the solution could be seen by the expression
Parker and Leinhardt (1995) listed the following five common errors in percentage problems based on their research reviews: (1) ignoring the “%” sign; (2) numerator rule errors; (3) using multiplication instead of division (or vice versa) or random algorithms; (4) in finding Comparative Quantity and finding Base Quantity problems (see Table 3); and (5) in percentage exceeding 100%. These errors are also essentially related to the solutions of the task types in Table 3.
“Ignoring the ‘%’ sign” refers to the tendency of students to disregard the percent symbol, treating it as if it has no meaning. For example, a student may incorrectly conclude that “9/9 = 1%,” interpreting “9/9 of N as a percentage of N” as “1%” instead of 100%.
The “numerator rule” refers to a students’ misconception that the percent sign placed to the right of a number can be replaced by a decimal point to the left of the number. For example, a student may correctly convert 0.55 to 55%, but incorrectly convert 0.9 to 9%.
Using multiplication instead of division (or vice versa) or applying arbitrary algorithms appears to stem from the strong emphasis on multiplication tables. This error occurs when students choose to divide only if the quotient is an integer and multiply otherwise. For example, when solving the problem “What percentage of 32 is 8?” (a percent problem in Table 3), a student might incorrectly divide 32 by 8 and answer 4, instead of recognizing the correct percentage relationship.
There are two types of errors: errors in finding the Comparative Quantity and errors in finding the Base Quantity (see Table 3). The first type, errors in finding the Comparative Quantity, occurs when the Base Quantity and the Percent are known, but the student fails to determine the correct Comparative Quantity. The second type, errors in finding the Base Quantity, occurs when the Comparative Quantity and the Percent are known, but the student fails to determine the correct Base Quantity (see Table 3). Both types of errors involve reversing the divisor and the dividend when solving problems in these contexts (see Table 3).
Errors in percentage exceeding 100% reveal difficulties in interpreting and working with percentages greater than 100. A typical mistake in this case might be, for example, incorrectly equating 120% with 0.120 or interpreting 60 as 50% of 30.
There are also other errors that do not necessarily lead to wrong answers. Some students relied on a fixed strategy, for example, saying, “I always solve percentage problems using either multiplication or division. So, if I see 50% and 40 in the problem statement, I calculate 0.5·40, 40/0.5, and 0.5/40, then choose the most reasonable answer among them.” Additionally, some students interpret 100% merely as a “container” rather than understanding the true percentage concept, which represents a relative size based on 100 as the reference quantity. Using this approach, the answer to the task will occasionally be correct (cf. Guerreiro & Serrazina, 2017; Parker & Leinhardt, 1995).
In their interview study, Dole et al. (1997) found that students who were not proficient (unable to solve any problems in Table 3) or only slightly proficient (able to solve only a percentage of problems; see Table 3) relied on a fixed solution method. In contrast, proficient students (those who could solve the problems shown in Table 3) employed a mix of flexible strategies or trial-and-error approaches rather than a fixed method.
Kumakura et al. (2019) noted that the proportion of correct answers for percentage and base problems was lower than for comparative problems (see Table 3). Additionally, the proportion of correct answers for “Compare” problems (Comparison of two distinct sets) was lower than for “Part–whole” problems (Comparison of the whole and part sets) and “Change” problems (Comparison of the same set across different time points).
Another challenge is that although the percentage concept has a clear mathematical structure and well-defined computational rules, it remains both mathematically and socially complex and ambiguous, often conveying multiple meanings simultaneously. Additionally, the linguistically concise nature of percentage expressions poses difficulties. The proportional relationships between quantities are often obscured within the compact notation; explicit additive cues can be misleading, and the multiplicative factor in the calculations is entirely implicit.
Process categories of problems describing mathematical literacy
The cognitive level required to solve mathematical problems can be described by assessing the processes required to solve them. In this study, we applied the process descriptions of mathematical literacy used in the Program for International Student Assessment (PISA) survey (Kupari et al., 2005), which can be interpreted hierarchically. The mathematical literacy definition for Organisation for Economic Co-operation and Development/PISA (Kupari et al., 2005, p. 13) is: “Mathematical literacy is an individual's capacity to identify and understand the role that mathematics plays in the world, to make well-founded judgements and to use and engage with mathematics in ways that meet the needs of that individual's life as a constructive, concerned and reflective citizen.”
In Table 5, there are three process categories, which could be interpreted through Bloom's revised taxonomy. The three lowest levels of the taxonomy are: remembering (retrieving relevant knowledge from long-term memory), understanding (students construct meaning from instructional messages), and applying (using procedures to perform exercises or solve problems) (Krathwohl, 2002).
Process Categories Describing Mathematical Literacy (Kupari et al., 2005).
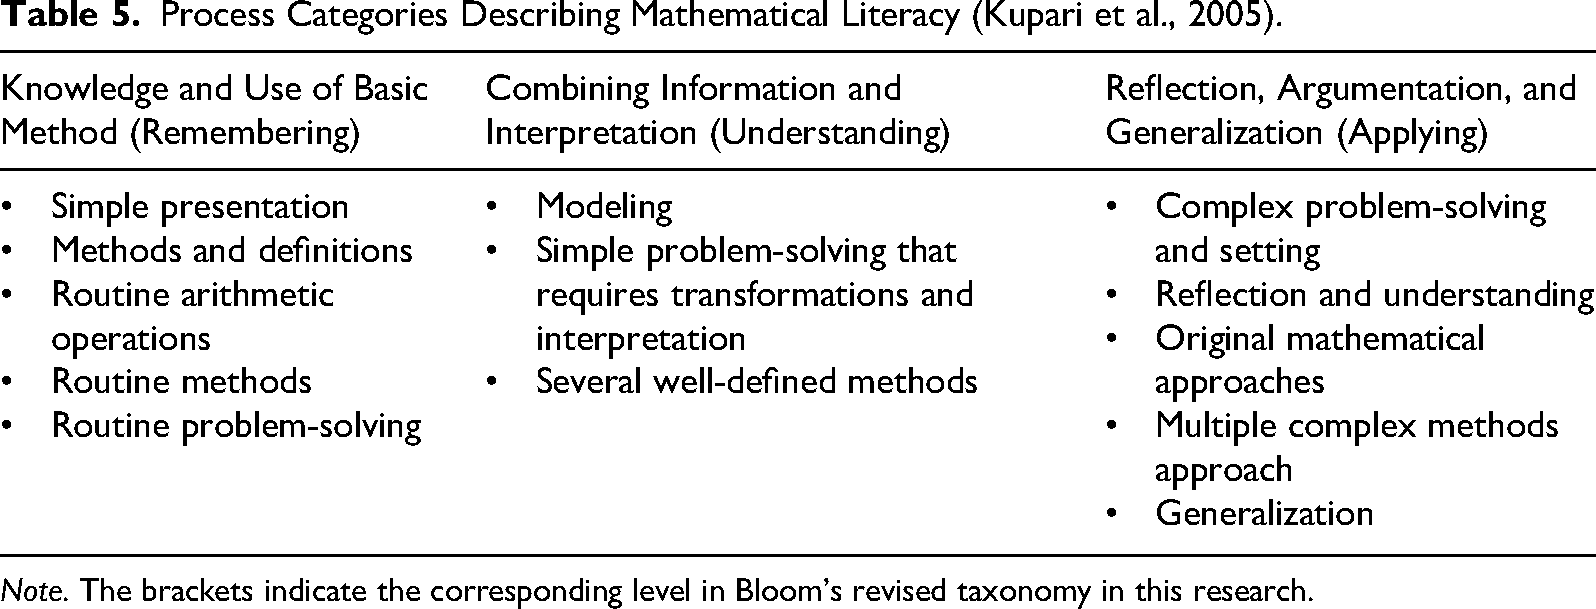
Process Categories Describing Mathematical Literacy (Kupari et al., 2005).
Note. The brackets indicate the corresponding level in Bloom's revised taxonomy in this research.
We will apply the categories of Table 5 to the problems of the questionnaire (Table 12, Appendix A) using the descriptions.
Expressing students’ mathematical thinking through mathematical symbolic language, natural language, pictorial language, and body language is one of the key objectives of teaching mathematics in basic education at all grade levels (Finnish National Board of Education, 2016; Joutsenlahti & Rättyä et al., 2015). The above-described expressions can be seen as multimodal languaging of mathematical thinking (Joutsenlahti & Kulju, 2017; Lehtonen et al., 2020; Takeuchi, 2015). The multimodal languaging model intentionally takes advantage of different modes in students’ meaning-making processes in mathematics learning. The underlying idea is that, if the students use different modes in their expressions, they gain a greater understanding of the topic (Joutsenlahti & Kulju, 2017).
Multimodal languaging is seen as the interpretation of mathematical symbolic language, including the understanding of computational techniques and the ability to express one's thinking in one's own words, which reveals students’ conceptual understanding and strategic competence. It helps the teacher to evaluate the thinking process. We see that mathematical literacy also includes multimodal languaging competence.
In this study students are asked in some problems (Q1, Q2, Q5, and Q6, Table 12, Appendix A) to explain how they have solved the problems. For example, in problem Q2: “How would you explain it in a way that is easy to understand using diagrams, tables, pictures, etc.?”
Research questions
In Sections 4.1 and 4.2, we presented categorizations of solution strategies for percentage problems and explored multimodal approaches to expressing mathematical thinking. Additionally, in Section 3.2, we identify common misconceptions and typical errors that students make when solving percentage problems.
Building on this background, the following research questions guide this study:
What is the competence of Japanese and Finnish lower secondary school students to solve percentage problems? How do lower secondary school students in Japan and Finland express their solutions to the percentage problem Q2 of the questionnaire (Table 12, Appendix A)? What are the typical errors observed in students’ responses to problem Q2 of the questionnaire (Table 12, Appendix A) in Japan and Finland? What causes these errors?
The primary objective of this study was to investigate these three research questions by analyzing survey data. Through this analysis, we aimed to gain deeper insights into students’ problem-solving strategies, the ways they express their mathematical reasoning, and the common misconceptions that arise in percentage problem-solving in both educational contexts.
Implementation of the survey and data collection
The questionnaire consists of six problems (Table 12, Appendix A) developed based on the theoretical framework. The problems are identical for both Japan and Finland; however, due to cultural differences, the price of a cake in problem Q1 is set at 2,000 yen in Japan and €20 in Finland to reflect local currency contexts.
The number of survey participants is presented in Table 6. The study was conducted in five public lower secondary schools in Japan and 13 public lower secondary schools in Finland. The public schools involved in this study do not select students through entrance examinations; instead, they are standard schools attended by local students with average academic achievement. Furthermore, none of the schools tracks or groups students based on academic ability. Therefore, the participants were selected from classes randomly assigned by each school for this study. Data collection took place in the spring of 2018 in Japan and in the spring of 2019 in Finland. While no specific time limit was set for the survey, it took approximately 30 min.
The Number of Participants (N) in Japan and in Finland.
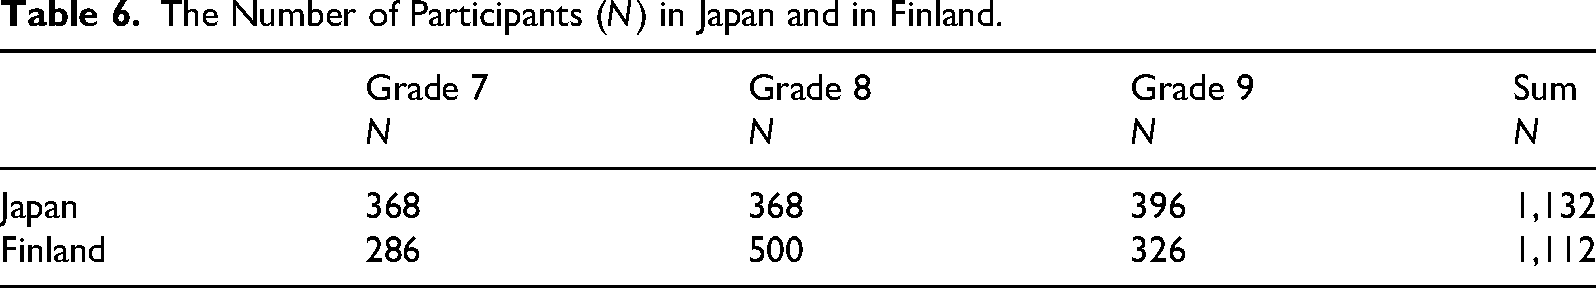
The Number of Participants (N) in Japan and in Finland.
Table 7 presents the relationship between the survey problems (Q1–Q6) and the grade level at which the subject of each problem is taught according to the curriculum.
Relationship Between Survey Problems and the Grade Level at Which the Subject of Each Problem is Taught According to the Curriculum.
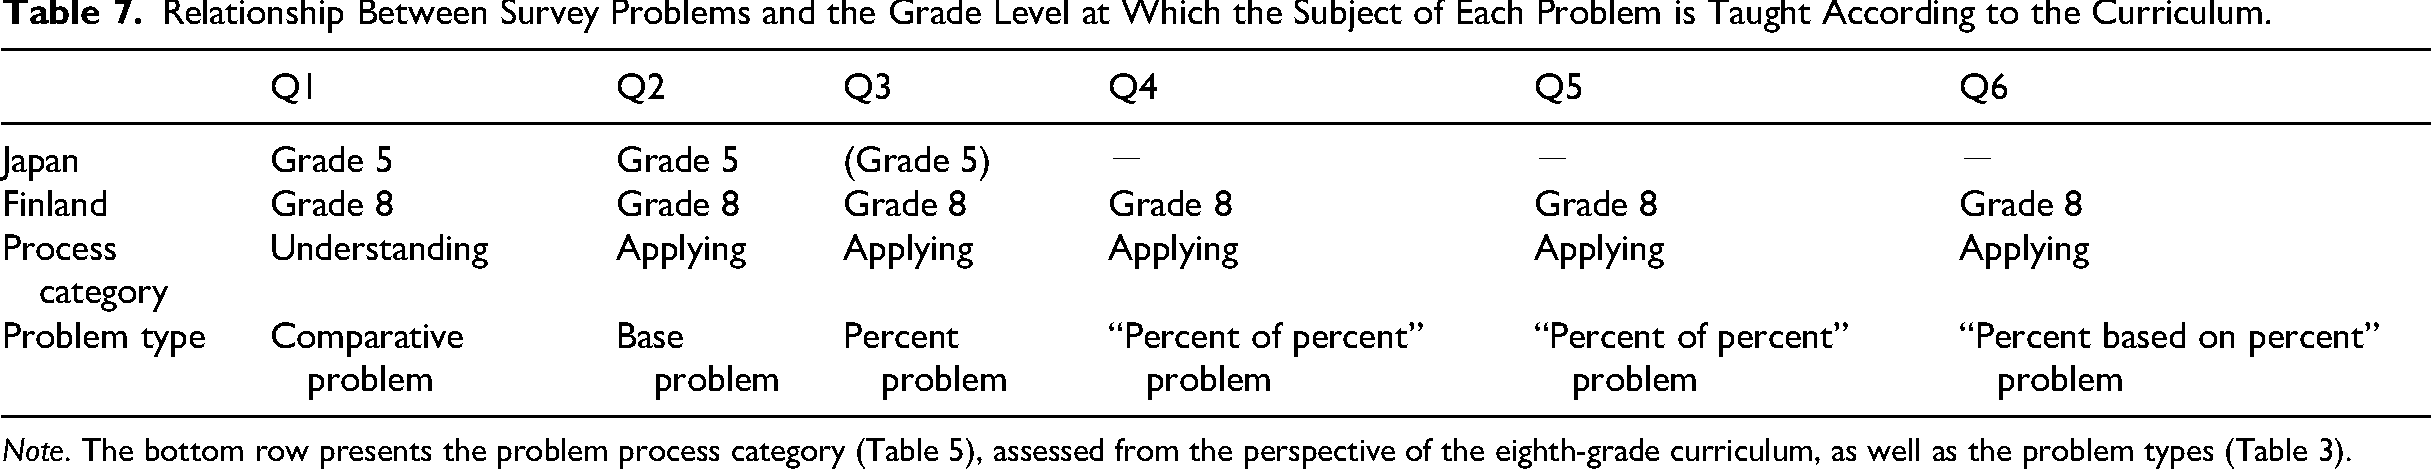
The treatment of problem Q3 in Table 7 varies among textbook publishers in Japan, and thus this part is presented in brackets. We evaluate all problems from Q2 to Q6 as requiring application-level skills, as these problems involve explanations (argumentation), although the underlying mathematics primarily corresponds to the level of understanding. Problem Q1, on the other hand, is categorized as a word problem at the understanding level.
Ethical considerations were carefully observed during the conduct of the study in both Japan and Finland. The purpose of the study and the intended use of the collected data following the publication of the results were clearly explained to the participants. Permission was obtained from the relevant educational authorities, parents of the students, and the students themselves, as applicable. Student anonymity was rigorously maintained throughout all stages of the study.
Students’ competence to solve the percentage problems
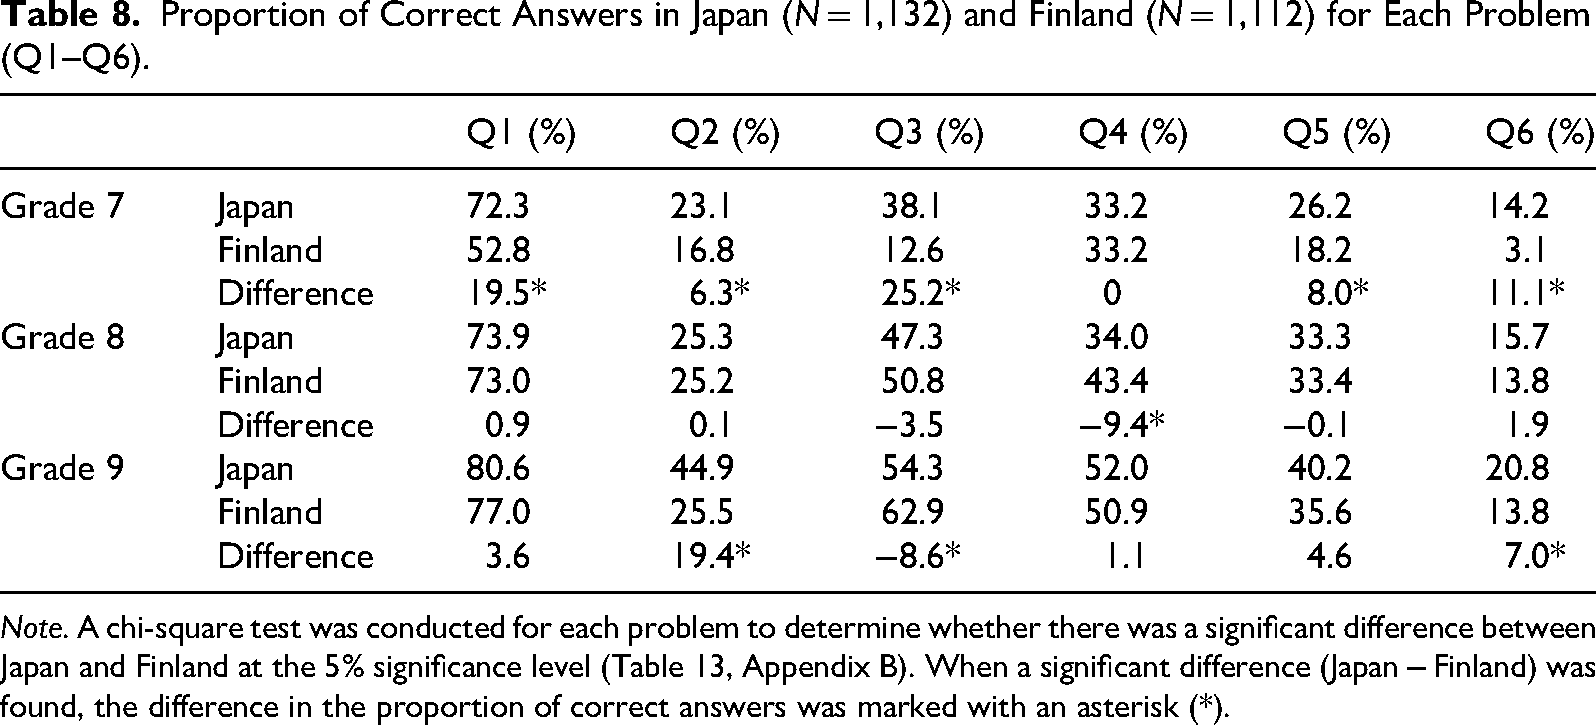
Table 8 presents a comparison of the proportion of correct answers by grade level between Japan and Finland.
Proportion of Correct Answers in Japan (N = 1,132) and Finland (N = 1,112) for Each Problem (Q1–Q6).
Proportion of Correct Answers in Japan (N = 1,132) and Finland (N = 1,112) for Each Problem (Q1–Q6).
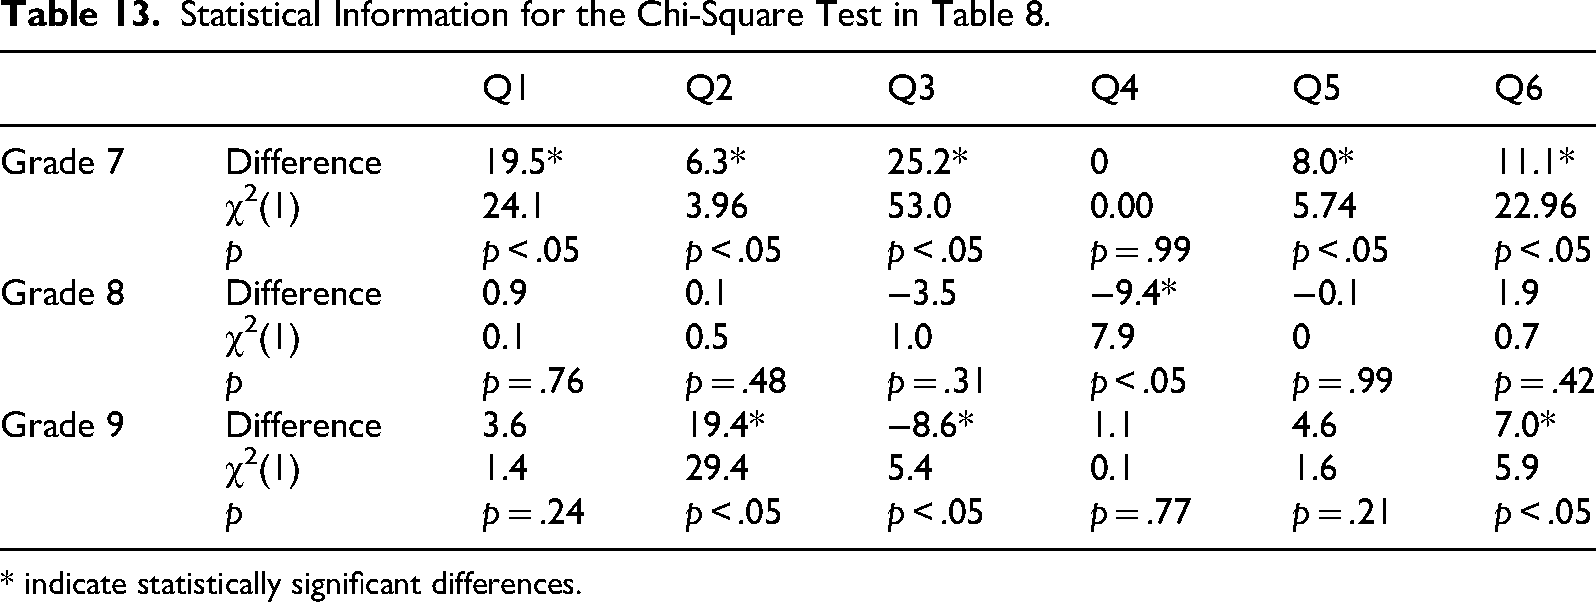
Note. A chi-square test was conducted for each problem to determine whether there was a significant difference between Japan and Finland at the 5% significance level (Table 13, Appendix B). When a significant difference (Japan − Finland) was found, the difference in the proportion of correct answers was marked with an asterisk (*).
For Q1, Q2-a, Q4, and Q6, only the correct numerical answers were categorized as “correct”; responses with calculation errors were excluded. For Q3, a response was marked “correct” only if a proper mathematical expression was provided for both Q3-a and Q3-b. Acceptable expressions included divisions (340,000
In grade 7, the proportion of correct answers was significantly higher in Japan than in Finland, with the exception of problem Q4. This may be attributed to the Japanese curriculum, which introduces problems Q1 to Q3 in primary school, thereby making students more familiar with percentage-related tasks. In contrast, in the Finnish curriculum, the percentage concept is primarily introduced in lower secondary schools in grade 8 for problems ranging from Q1 to Q6.
In grade 8, no statistically significant differences were observed in the proportion of correct answers between Japan and Finland, except for problem Q4. This could be due to the fact that Finnish students encounter a wider variety of percentage problems in grade 8. The significantly higher proportion of correct answers for problem Q4 in Finland suggests that problems of this nature are rarely addressed in the Japanese curriculum.
In grade 9, the proportion of correct answers for problems Q2 and Q6 was significantly higher in Japan, while the proportion of correct answers for problem Q3 was significantly higher in Finland. Specifically, the proportion of correct answers for problem Q3 was significantly higher in Finland. This may be influenced by the fact that some textbooks in Japan do not cover this type of problem.
Table 9 presents the proportions of the number of correct answers (0, 1, …, 6) in Japan and Finland in grades 7 to 9.
Proportion of Number of Correct Answers in Japan (JPN) and Finland (FIN) in Grades 7 to 9.
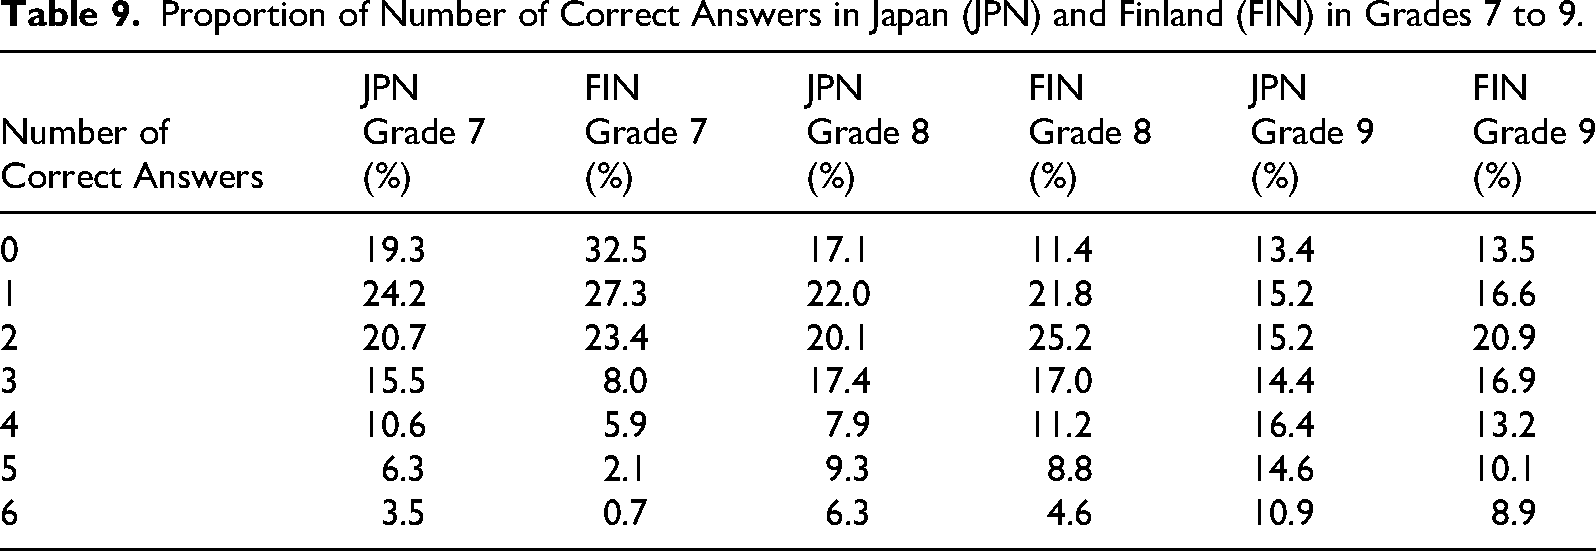
The proportion of students who received five or six correct answers increased markedly in both countries as they moved from grades 7 to 9. In contrast, the proportion of students who received two or fewer correct answers in the survey was over 50% at all grade levels in both countries, except for Japanese grade 9 students (43.8%).
The mean number of correct answers for Japanese students was 2.07 (SD = 1.65) for grade 7, 2.30 (SD = 1.77) for grade 8, and 2.93 (SD = 1.92) for grade 9. In comparison, Finnish students scored 1.36 (SD = 1.34), 2.39 (SD = 1.63), and 2.66 (SD = 1.82) in the respective grades. Welch's t-test indicated that Japanese grade-7 students scored significantly higher than their Finnish counterparts (t(651.24) = 5.99, p < .05). No significant differences were observed for grades 8 (t(752.14) = −0.83, p = .41) or 9 (t(706.27) = 1.93, p = .05).
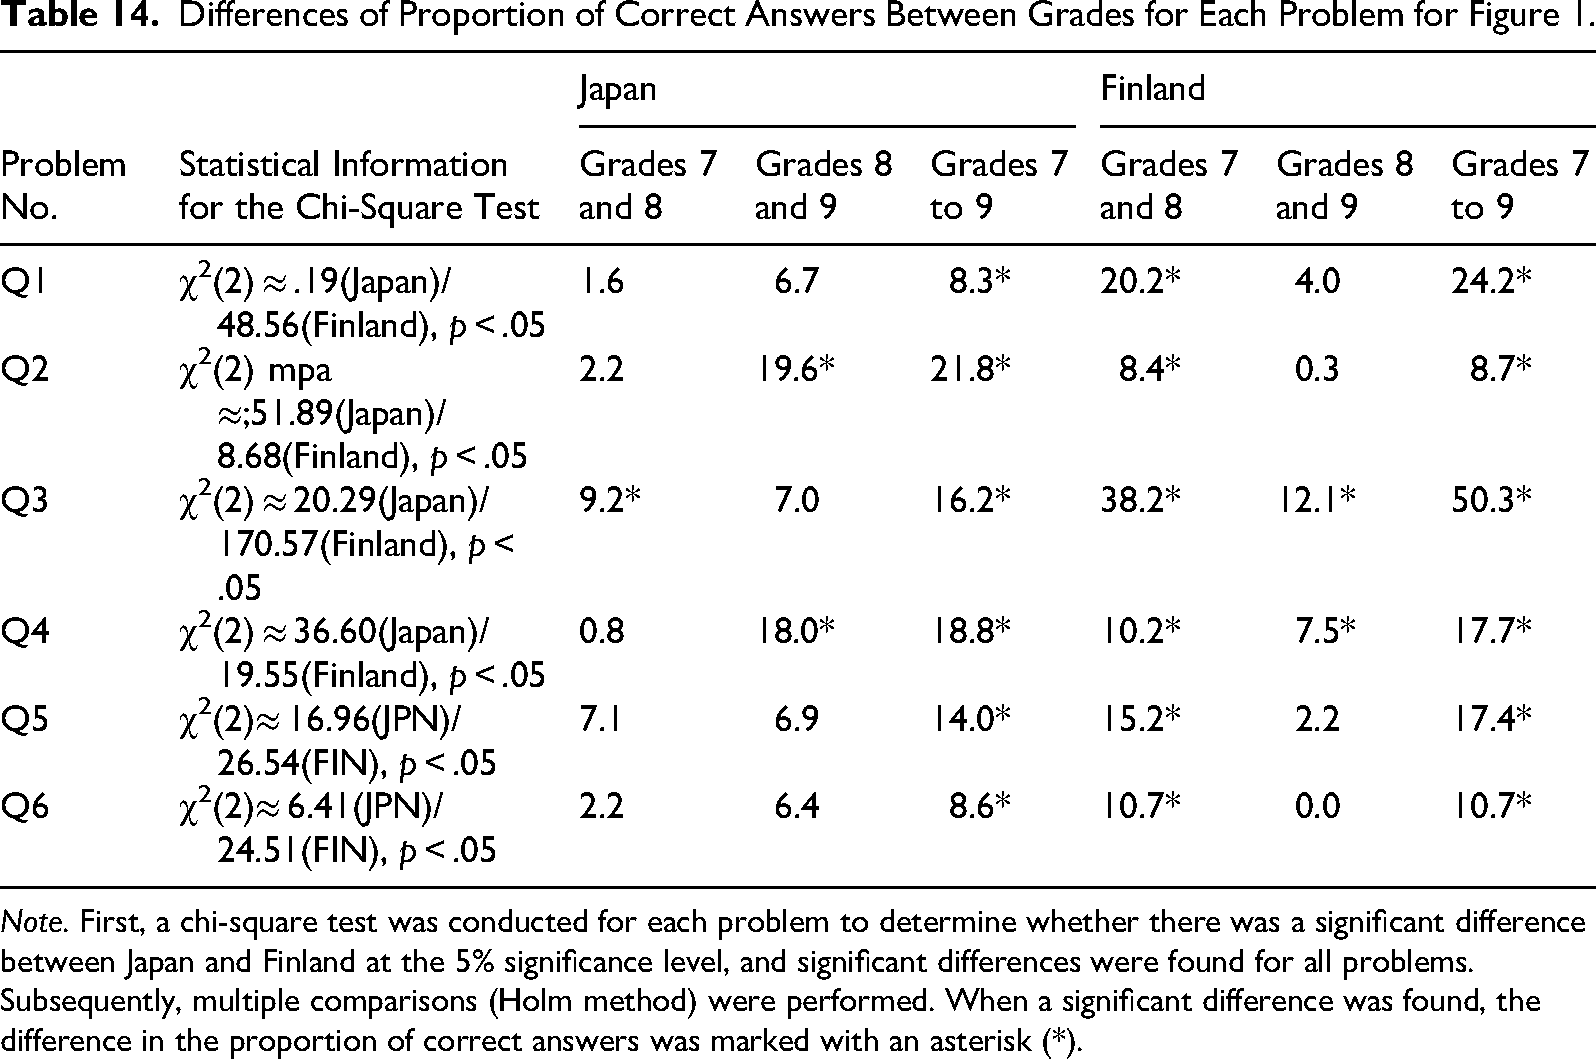
Figure 1 shows the presence or absence of statistically significant differences in the proportion of correct answers for each problem across the grades (Table 14, Appendix C).
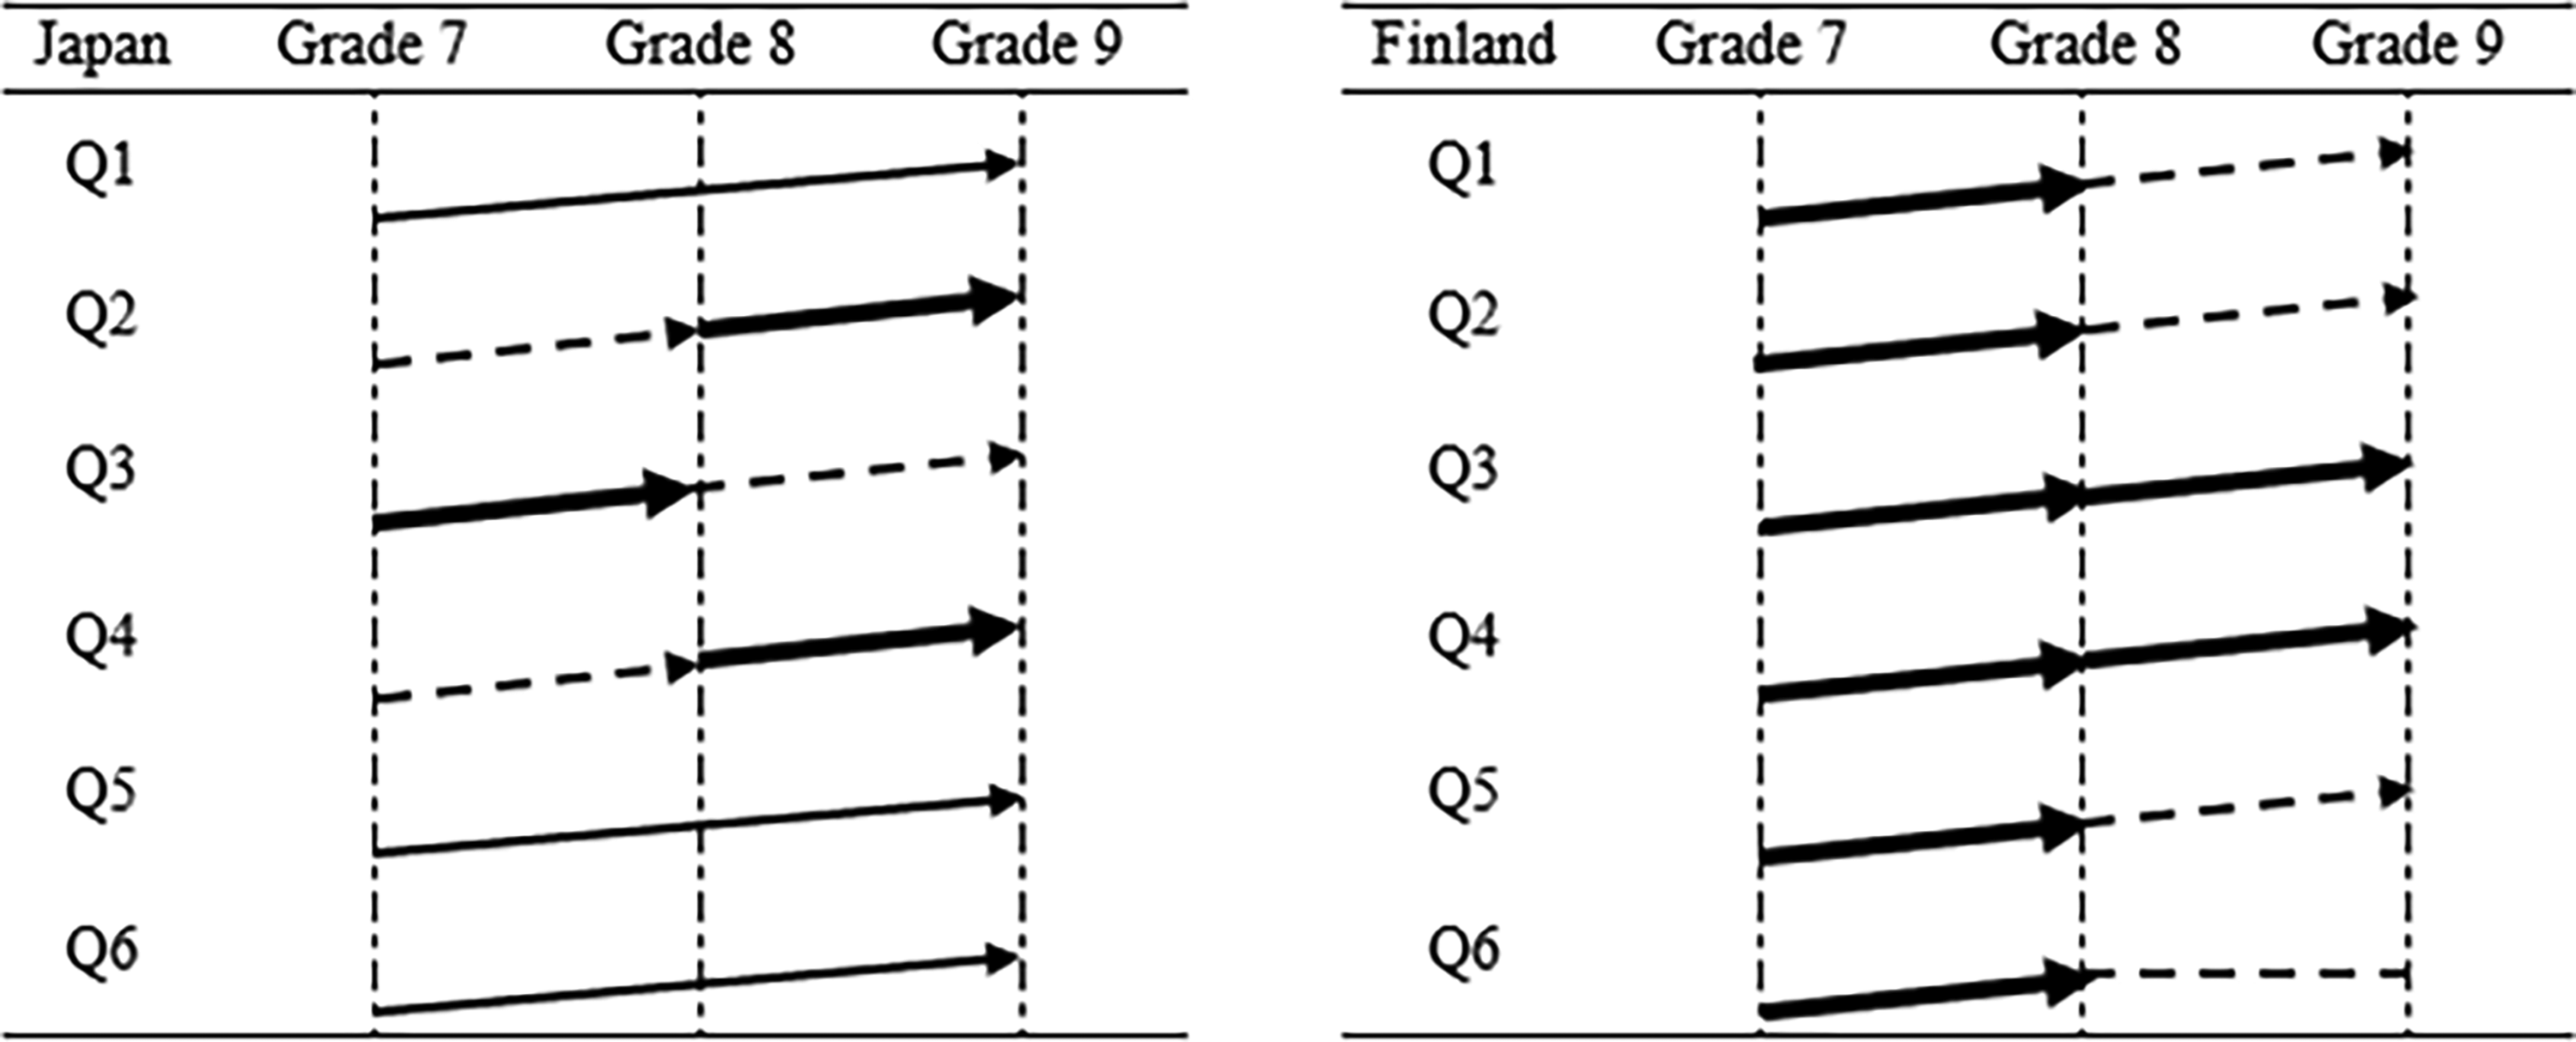
Comparison of significant differences between grades 7 and 9.
In Figure 1, cases where a significant difference exists between adjacent grades are represented by thick solid arrows. Cases where a significant difference is observed only between grades 7 and 9 are indicated by thin solid arrows. Cases where no significant difference is found, but the proportion of correct answers increases, are shown with dotted arrows. Finally, cases where the proportion of correct answers remains unchanged are depicted with dotted lines.
The proportion of correct answers increases with grade progression for most problems in both countries. However, in Japan, significant differences between adjacent grades are observed only for problems Q2, Q3, and Q4. In contrast, in Finland, significant differences are evident between grades 7 and 8 for all problems, and even more pronounced differences are observed between grades 8 and 9 for problems Q3 and Q4. The significant difference between grades 7 and 8 in Finland results from students beginning to learn percentage problems in grade 8.
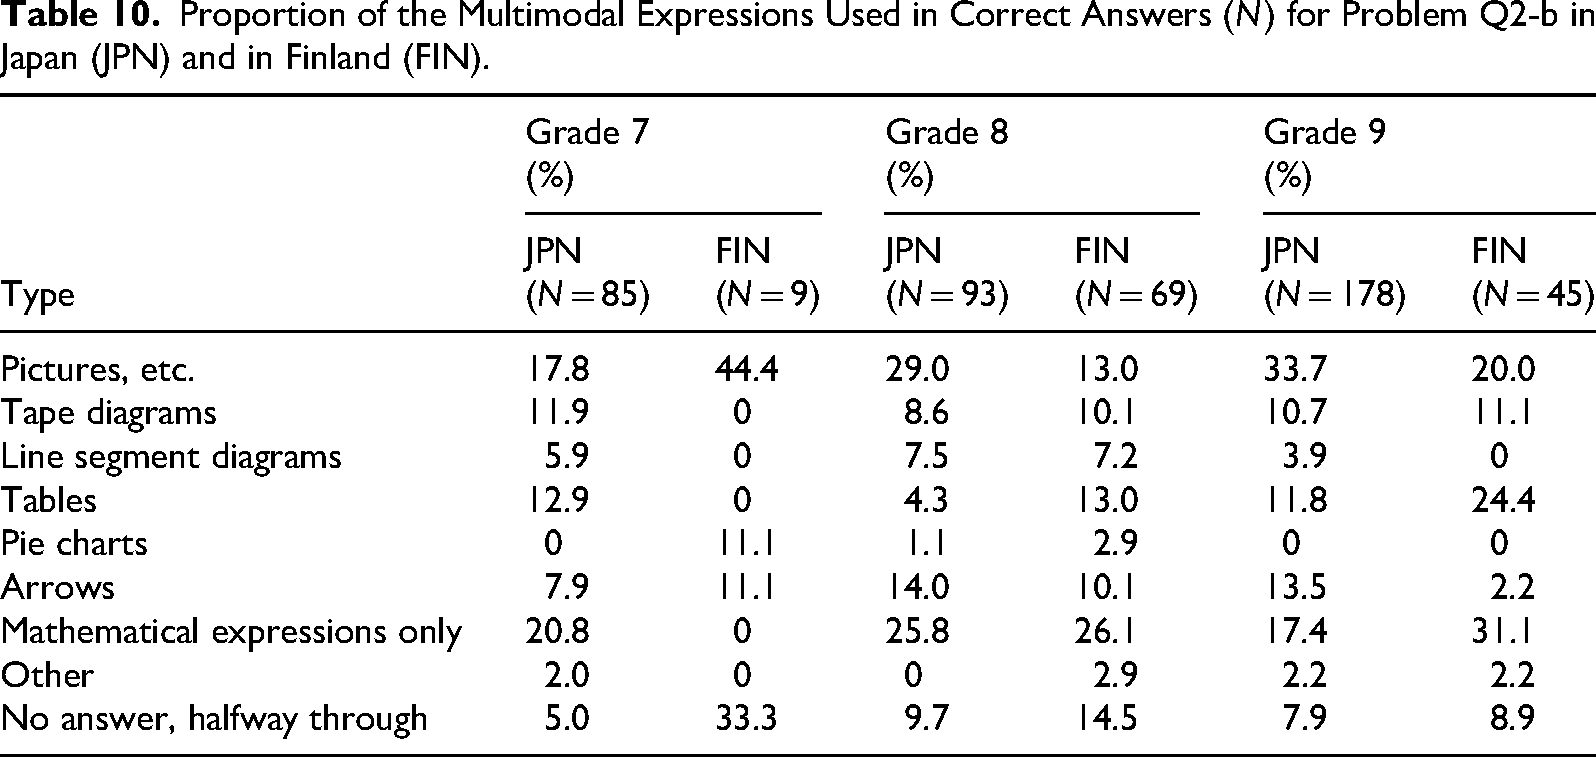
Here, we look specifically at the use of pictorial language (see Section 4.2) in multimodal expressions in problem Q2-b, where students were asked to explain their solution in problem Q2-a to their friend. Table 10 shows the multimodal choices for the explanations that students used in the survey.
Proportion of the Multimodal Expressions Used in Correct Answers (N) for Problem Q2-b in Japan (JPN) and in Finland (FIN).
Proportion of the Multimodal Expressions Used in Correct Answers (N) for Problem Q2-b in Japan (JPN) and in Finland (FIN).
Student representations were categorized as follows: “Pictures” if the relationship between the salmon can contents and the percentages for last year and this year was illustrated with drawings of cans; “Tape diagrams” (or bar models) if represented by rectangular bars; “Line segment diagrams” if shown using line segments; “Tables” if organized in a tabular format; “Pie charts” if depicted with circular graphs; and “Arrows” if indicated with directional arrows. In many of these categories, students also included mathematical expressions alongside their drawings or diagrams. In contrast, representations consisting only of formulas without any visual aids were categorized as “Mathematical expressions only.” Selected examples are shown in Figure 2.
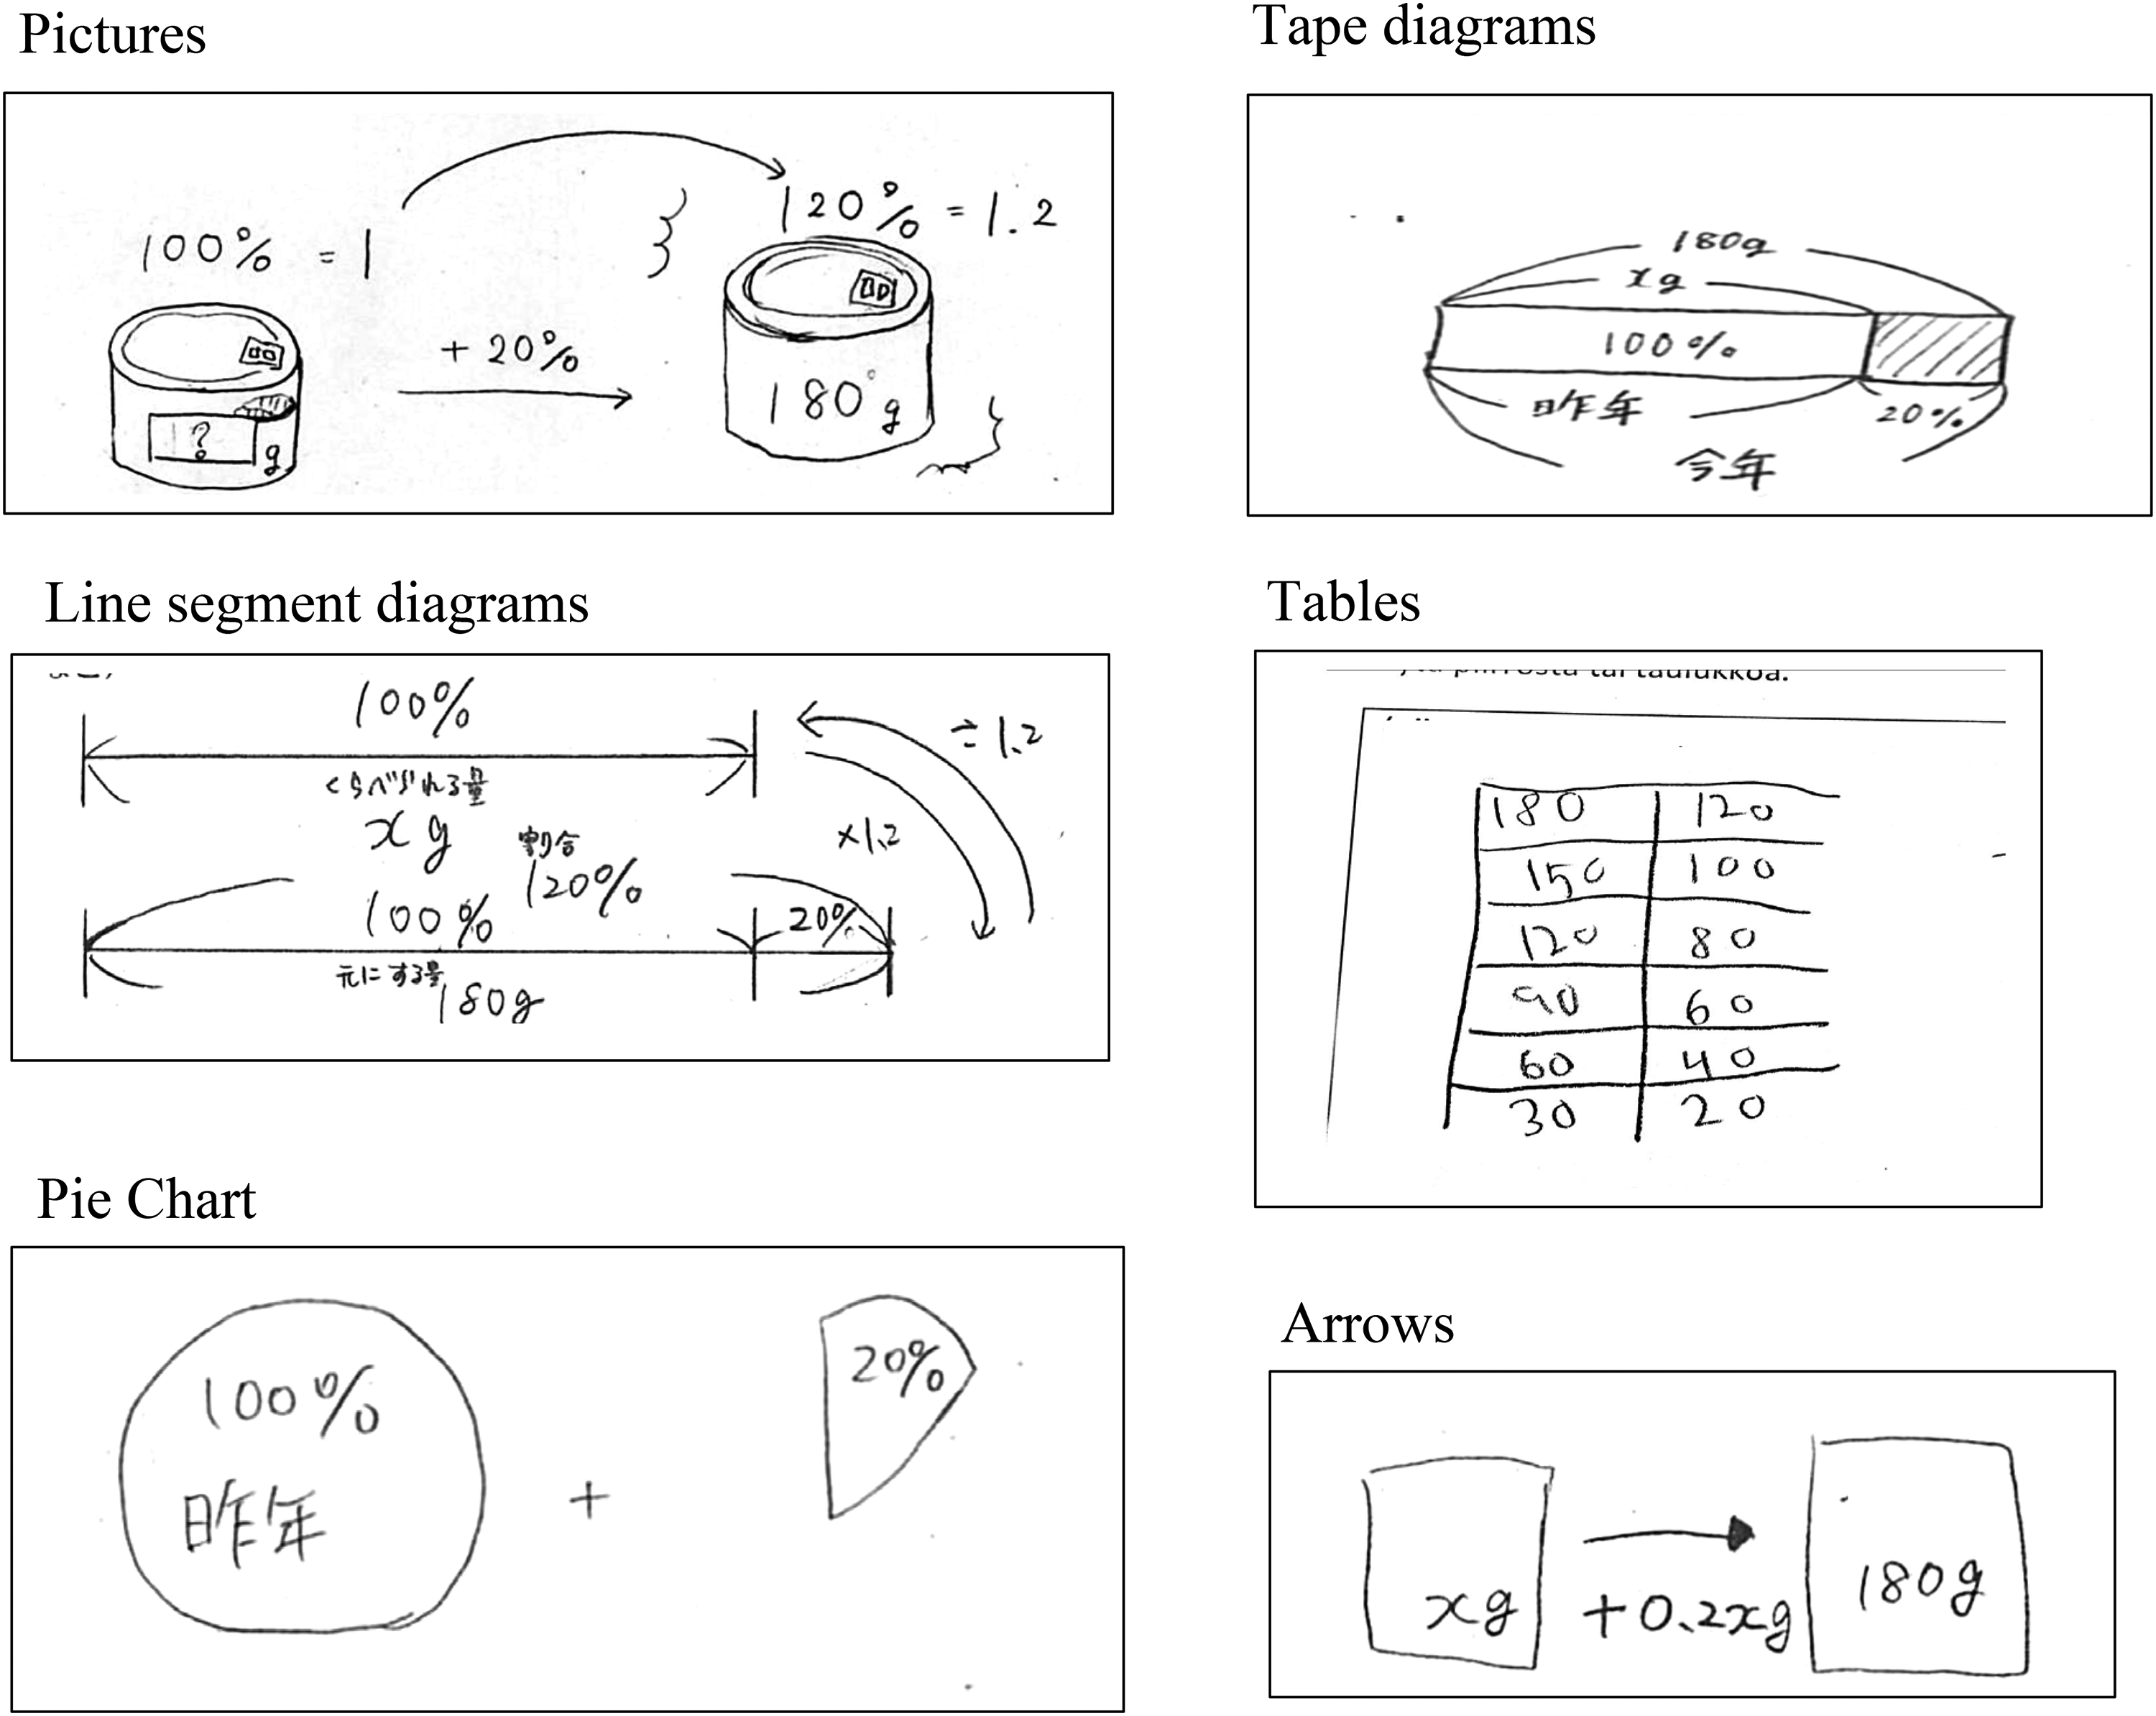
Examples of multimodal expressions in Japanese and Finnish.
In most cases, the most popular way in which students’ solutions were explained was to use a mathematical expression and its simplification. The fact that only expressions were used in the explanation, even though “using diagrams, tables, pictures, etc.” are given as examples, suggests that many students think that expressions are commonly used in the explanation of mathematical problems.
Students’ own pictures (Figure 2) that were related to the content of problem Q2 were more common than the standard patterns used in traditional teaching materials. For example, “Number line diagrams” is covered in many Japanese arithmetic textbooks but was not mentioned by a single student.
Figure 3 shows that across all grades in both countries, “Pictures” was the most popular choice of the multimodal choices. Mathematics textbooks typically use “Tables,” “Arrows,” and “Tape diagrams” (Figure 2) in their examples, and these multimodal expressions are also used in the answers.
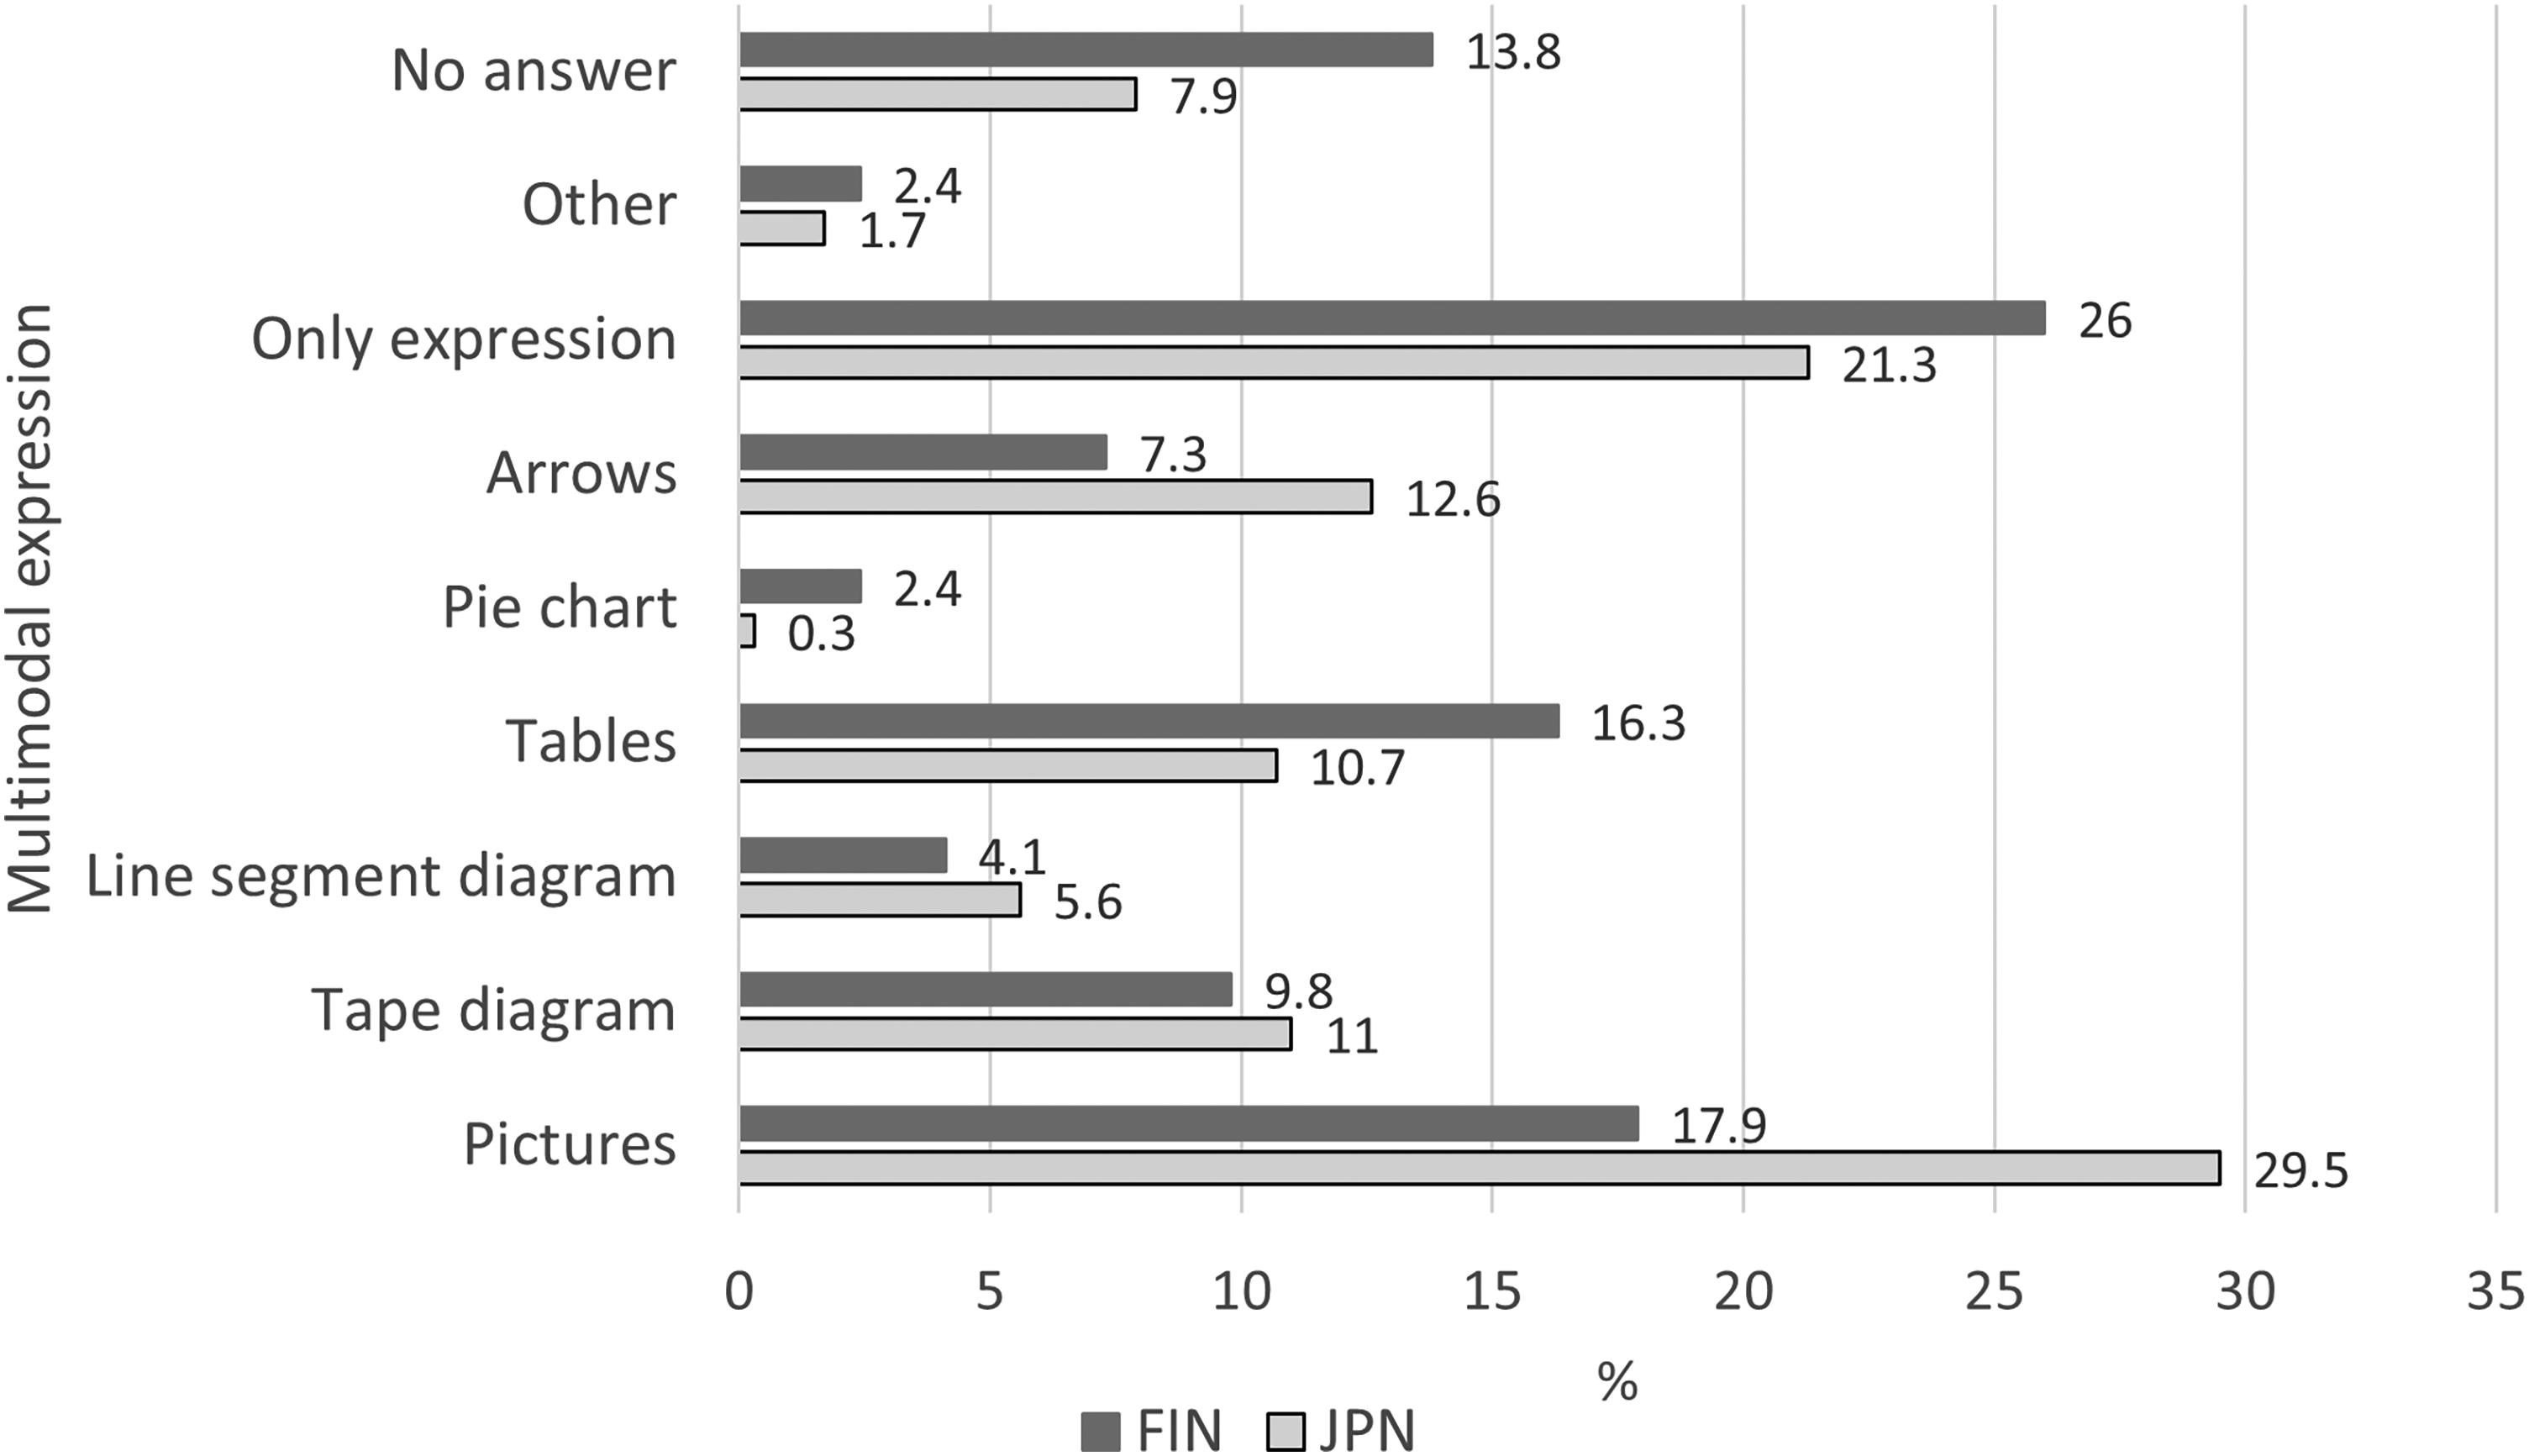
Multimodal expressions in responses to problem Q2 in Japan (N = 356) and Finland (N = 123) across all grades (7, 8, and 9) combined.
Many students used only mathematical expressions in their argumentation, despite the problem instructions. In school, students are used to solving mathematical problems and presenting their solutions using only the symbolic language of mathematics. Consequently, many students were not accustomed to using more varied representations.
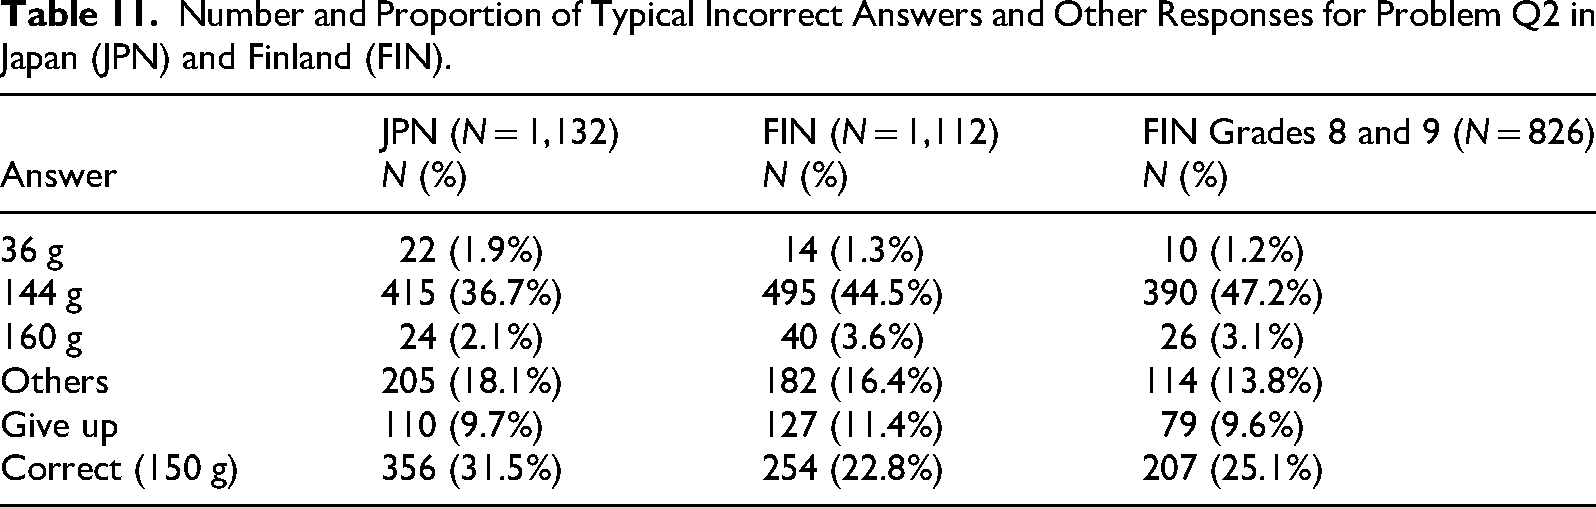
We focused particularly on the typical errors in students’ solutions to Q2-a of the questionnaire. The focus is placed on the errors in problem Q2 because, despite being a fundamental problem, it is one where the proportion of correct answers is less than 50%, even among ninth graders. Problem Q2 was: “A company is selling 180 g of canned salmon; the weight of the salmon is 20% more than that sold in the previous year. What was the weight of the canned salmon sold in the previous year?” (see Table 12 in Appendix A). Problem Q2 is particularly interesting because the students must determine the base quantity (see Table 3), which is challenging for them (see Table 11). The typical incorrect answers given by the Japanese and Finnish students are presented in Table 11. In total, 31.5% of Japanese students (N = 1,132) and 15.6% of Finnish students (N = 1,112) correctly determined the original weight of the salmon canister to be 150 g.
Number and Proportion of Typical Incorrect Answers and Other Responses for Problem Q2 in Japan (JPN) and Finland (FIN).
Number and Proportion of Typical Incorrect Answers and Other Responses for Problem Q2 in Japan (JPN) and Finland (FIN).
Regarding the Finnish sample, for reference, we also calculated the values for grades 8 and 9, excluding grade 7, which had not yet learned the solution method for Q2. The results indicate that the trends in student responses were similar across these grades.
The most common incorrect answer in both countries was 144 g (Table 11). Students assumed that the 20% base quantity referred to the current year's content rather than the previous year's and calculated (1−0.2)·180 = 144. This was the cause of errors. This error stems from a misunderstanding of the correct determination of the base quantity.
The other common incorrect answers to problem Q2-a were 36 and 160 g. Students who answered 36 g probably assumed that the base quantity was 180 g and that they needed to calculate a 20% increase from this value. The other incorrect answers were 216 and 179.80 g. Since 0.20·180 g = 36 g, the answer 216 g resulted from adding 36 to 180 g. The answers 160 g (=180 − 20) and 179.80 g (=180 − 0.20) resulted from subtracting 20% or the decimal 0.2 which represents 20% from 180 g and indicate a poor understanding of the percentage concept.
These errors frequently demonstrated that students struggled to recognize that the initial weight of the salmon canister (180 g) already included a weight increase. Understanding the growth rate proved challenging for many students. Those who produced incorrect solutions often had difficulty determining the correct base quantity from which to calculate the 20% increase. As a result, they were uncertain about how to identify the original base quantity and what it means for the added weight to be 20%, leading to a final weight of 180 g − 20% greater than the original weight of the salmon preserve.
Students’ competence in percentage problems in Japan and in Finland
The following points highlight differences between the Japanese and Finnish curricula as reflected in the survey results. The first key difference is that problems ranging from Percent problems to Base problems (Table 3) are introduced in grades 4 and 5 in Japan, whereas in Finland, they are covered in grade 8. This discrepancy may explain why the proportion of correct answers in grade 7 was significantly lower in Finland than in Japan for all problems except for Q4, while in grade 8, there was no significant difference between the two countries for any problem except for Q4. Additionally, in grade 9, the proportion of correct answers for Q2 (a Base problem) was significantly higher in Japan than in Finland. This suggests that students do not immediately develop an understanding of and ability to solve Base problems.
The second difference between the curricula is that Percent problems (Table 3) are not frequently covered in grade 5 in Japan, whereas in Finland, they are taught in grade 8. This may explain why the proportion of correct answers to Q3 in grades 8 and 9 was higher in Finland than in Japan, with the difference being especially significant in grade 9.
The third difference in the curricula is that “Percent of Percent” and “Percent Based on Percent” problems (Table 3) are not covered in Japan, whereas in Finland, they are introduced briefly in grade 8 and studied in high school. This may explain why the proportion of correct answers to Q4 was significantly higher in Finland than in Japan. However, there was no significant difference between Japan and Finland in the proportion of correct answers for problems Q5 and Q6; in grade 9, the proportion of correct answers for problem Q6 was significantly higher in Japan.
The proportion of correct answers for Q5 and Q6 was lower than that for the other problems in both countries. In particular, the proportion of correct answers for “Percent Based on Percent” problems remained below 20% even in grade 9. As mentioned above, one reason for this is that this type of problem is not included in the Japanese curriculum, whereas in Finland, it is only briefly introduced in grade 8. Nevertheless, why is the proportion of correct answers so low?
For example, in problem Q5, the base quantity for “10% more than in 2015” differs from the base quantity for “10% less than in 2016.” Similarly, in problem Q6, when it states that “30% based on 50% is 60%,” the base quantities of 50% and 30% differ from the base quantity of 60%. The challenge with this type of problem lies in the necessity of correctly identifying and working with multiple percentages that have different base quantities within a single context.
However, there were no problems in either country in which the proportion of correct answers declined as the school year progressed. Additionally, the proportion of correct answers increased for all problems except for the change in problem Q6 from grade 8 to grade 9 in Finland. Overall, these results suggest that students’ understanding of percentage problems deepens as they progress through the grades, regardless of whether they study these problems directly.
A similar survey conducted in Japan at the university level, focusing on teacher education, showed that students achieved better results, including a greater understanding of percentages, compared with lower secondary school students (Kambara, 2022).
The error solutions for Q2-a highlighted the challenge that students in both countries faced in understanding the 100% excess and in finding the base quantity. In the error solutions, students often assumed that the base quantity was the weight of the canned salmon, 180 g, even though this weight already included a 20% increase from the previous year (see Table 11). The weight of the previous year's canned salmon was the original weight (base quantity) that the students should have identified. These kinds of errors reveal difficulties in interpreting and working with percentages greater than 100. This may also be related to the fact that students struggle with the concepts of decimals and fractions. In particular, understanding a whole and grasping a fraction greater than one may have already been challenging in the context of fractions. When the concept of a whole is already challenging in fractions, understanding a 100% excess also becomes difficult. Thus, students had difficulty understanding how to find the base quantity, as required in problem Q2-a (cf. Guerreiro & Serrazina, 2017; Parker & Leinhardt, 1995; Tian & Siegler, 2018).
Implications and limitations
This study provides several key insights into the future teaching and learning of percentages.
First, regarding the Base problem (Q2-a), both countries showed a correct answer rate of less than 50% even by grade-9 students, despite Japan introducing the topic in grade 5 and Finland in grade 8. This indicates that mere exposure to the curriculum does not guarantee immediate understanding or problem-solving proficiency. These results suggest that complex concepts like percentages should not be treated as a “one-off” topic within a single grade. Instead, a spiral curriculum—where students revisit and deepen their understanding across multiple grade levels—is essential. In fact, for the Percent problem (Q3), a basic task, Finnish ninth graders outperformed their Japanese counterparts significantly. This may be attributed to the Finnish approach of learning fundamental percentage concepts through a spiral structure in both grades 5 and 8.
Second, for Q2-b, various student expressions were observed in both countries, even though textbooks do not necessarily present a wide range of such models. For students who correctly solved Q2-a, it became clear that there is a diverse range of effective expressions for understanding and solving the problem. However, many students relied solely on mathematical expressions without using drawings or diagrams. These findings suggest the importance of introducing diverse expressions in instructional settings to foster multimodal skills. By recognizing various methods and learning to combine multiple expressions, students can deepen their understanding of the concept of percentage and enhance their problem-solving abilities.
Third, common challenges were identified in problems with low accuracy rates. In both countries, the correct answer rates for the Base problem (Q2), the “Percent of percent” problem (Q5), and the “Percent based on percent” problem (Q6) remained below 50%, even among ninth graders. As discussed, the primary cause for incorrect answers in these problems is the failure to correctly identify the base quantity (reference amount). These results suggest that in teaching applied percentage problems, it is crucial to emphasize the identification of the base quantity. Incorporating activities that consistently require students to consciously identify the base quantity—both in textbook descriptions and during classroom instruction—would significantly improve student understanding.
However, several limitations of this study should be acknowledged.
First, there is the issue of the number of survey items. For instance, students’ understanding of the Base problem was assessed using only one item (Q2-a). It is possible that the correct answer rates would fluctuate if the numerical values or the contextual settings of the problems were altered. This applies equally to the “Percent problem,” the “Percent of percent problem,” and the “Percent based on percent problem.” However, considering the cognitive burden on the students during the survey, increasing the number of items further proved to be difficult.
Second, the sample size poses a limitation. Although the total number of participants exceeded 1,000 in both countries, the number of students per grade level ranged from 286 to 500. Furthermore, while the total sample sizes for Japan and Finland were relatively similar (1,132 and 1,112, respectively), discrepancies exist when comparing specific grades. Specifically, the Japanese sample included approximately 70–80 more students in grades 7 and 9, whereas the Finnish sample had about 140 more students in grade 8. These imbalances may have increased the margin of error in cross-national and cross-grade comparisons. To provide a more precise representation of the current situation, it would be necessary to increase the sample size in future research.
Third, this study is cross-sectional rather than longitudinal. To capture more precisely the changes in the understanding of percentage concepts as students progress through grades, a longitudinal study is required.
Conclusions and areas for further research
This study aimed to clarify the actual state of understanding regarding percentage problems among lower secondary school students in Japan and Finland. To this end, a survey was developed based on a classification framework derived from prior research and a comparative analysis of the curricula in both countries. Three research questions were established, and the survey was administered to more than 1,000 students in each country.
The results revealed a general upward trend in correct answer rates as the grade level increased; however, for the Base problem, the “Percent of percent” problem, and the “Percent based on percent” problem, accuracy rates remained below 50% even among ninth graders. Furthermore, while the methods of using drawings and diagrams for problem-solving were diverse, the analysis also showed that a significant number of students did not utilize such visual expressions at all. Based on these findings, three pedagogical implications are proposed for future instruction on percentages:
adopting a spiral curriculum approach, incorporating multimodal expressions, and fostering a consistent awareness of the base quantity.
The percentage concept is challenging to teach. Due to inadequate or overly generalized instruction, students often perceive percentage only as a part of a whole. General models of percentage tend to focus students’ attention on this part–whole interpretation, offering a broad yet oversimplified view of the concept (cf. Guerreiro & Serrazina, 2017). Consequently, instruction often shifts too quickly to calculation methods that are not—and cannot be—effectively linked to the introductory model.
Students’ ability to describe their mathematical thinking remains rather limited, as indicated by this survey in both countries. This highlights a key area for development, as using multimodal approaches (languaging) would allow students’ responses to reflect their thinking and provide better support where necessary (Joutsenlahti & Perkkilä, 2024).
Utilizing students’ multimodal methods of expression can also support teachers’ assessments and enhance peer understanding of learning. All of the above would serve as an excellent foundation for further research in both countries.
The results did not indicate an effect of the difference in teaching time between the Japanese and Finnish curricula on students’ understanding of percentage. Nevertheless, it has been valuable to examine the curricula of two different countries and analyze students’ solutions to the same percentage calculation problems.
Collaborating with colleagues has helped us recognize that, despite cultural differences, we face similar challenges in mathematics education. Addressing these pedagogical issues through cooperation between experts from both countries has proven to be highly beneficial. International research collaboration is essential for advancing the theoretical foundation of mathematics education at all levels.
Footnotes
Acknowledgements
The authors sincerely thank all the teachers and students in Japan and Finland who participated in the survey.
Ethical Considerations
This study does not require ethical approval. All participants were informed about the study's purpose and procedures.
Informed Consent
Informed consent was obtained from all research participants in Japan and in Finland.
Contributorship
Hiroyuki Kumakura designed the overall research and drafted the manuscript. Jorma Joutsenlahti and Päivi Perkkilä analyzed the survey data from Finland and contributed to the writing of the manuscript. Shinichiro Matsumoto and Yutaka Kondo analyzed the survey data from Japan and critically reviewed the manuscript. All authors have read and approved the final version of the manuscript.
Funding
The authors disclosed receipt of the following financial support for the research, authorship, and/or publication of this article: This work was supported by the Japan Society for the Promotion of Science (JSPS) KAKENHI (grant number C20K02761).
Declaration of Conflicting Interests
The authors declared no potential conflicts of interest with respect to the research, authorship, and/or publication of this article.
Data Availability Statement
The datasets generated and analyzed during the current study are not publicly available due to privacy and ethical restrictions but are available from the corresponding author on reasonable request.
Author's biographies
Appendix A
Survey Problems for Lower Secondary School Students.
| Problem No. | Problem | |
|---|---|---|
| Q1 | If a cake with a price of 2,000 yen (€20) is sold at a 30% discount, what is the price after the discount? Write down the method and the answer. | |
| Q2 | A company is selling 180 g of canned salmon; the weight of the salmon is 20% more than that sold in the previous year. What was the weight of the canned salmon sold in the previous year?
Write down the answers to the problem. If you were to explain to a friend who does not understand how to find a), how would you explain it in a way that is easy to understand using diagrams, tables, pictures, etc.? Write it down below. It is not necessary to use all the figures, tables, pictures, etc. |
|
| Q3 | The approximate land areas of Finland and Japan are shown in the table below. | |
| Country | Land area | |
| Finland | 340,000 km2 | |
| Japan | 380,000 km2 | |
|
Write an equation to find the approximate percentage of Finnish land area based on the Japanese land area. It is not necessary to find the answer. Write an equation to find the approximate percentage of the Japanese land area based on the Finnish land area. It is not necessary to find the answer. |
||
| Q4 | In lower secondary school A, 30% of the students commute to school by bicycles, 60% of whom are boys. What percentage of boys commute to school by bicycle? Write the answer and how to find it. | |
| Q5 | The annual number of visitors to the zoo from 2015 to 2017 was checked. The number of visitors in 2016 increased by 10% compared to the number of visitors in 2015. Conversely, the number of visitors in 2017 decreased by 10% compared to the number of visitors in 2016. How did the number of visitors in 2017 compare to the number of visitors in 2015? Check one correct answer from the following a) to c) and write the reason for the answer. a) Increased, b) Remained the same, c) Decreased |
|
| Q6 | The ratio of the area of forest to the total area of town A was 50% ten years ago, but it was 30% this year. By what percentage did the forest area decrease from its level ten years ago? The total area of town A has not changed between 10 years ago and this year. Write the answer and how to find it. | |
Appendix B
Statistical Information for the Chi-Square Test in Table 8.
| Q1 | Q2 | Q3 | Q4 | Q5 | Q6 | ||
|---|---|---|---|---|---|---|---|
| Grade 7 | Difference | 19.5* | 6.3* | 25.2* | 0 | 8.0* | 11.1* |
| χ2(1) | 24.1 | 3.96 | 53.0 | 0.00 | 5.74 | 22.96 | |
| p | p < .05 | p < .05 | p < .05 | p = .99 | p < .05 | p < .05 | |
| Grade 8 | Difference | 0.9 | 0.1 | −3.5 | −9.4* | −0.1 | 1.9 |
| χ2(1) | 0.1 | 0.5 | 1.0 | 7.9 | 0 | 0.7 | |
| p | p = .76 | p = .48 | p = .31 | p < .05 | p = .99 | p = .42 | |
| Grade 9 | Difference | 3.6 | 19.4* | −8.6* | 1.1 | 4.6 | 7.0* |
| χ2(1) | 1.4 | 29.4 | 5.4 | 0.1 | 1.6 | 5.9 | |
| p | p = .24 | p < .05 | p < .05 | p = .77 | p = .21 | p < .05 |
* indicate statistically significant differences.
Appendix C
Differences of Proportion of Correct Answers Between Grades for Each Problem for Figure 1.
| Problem No. | Statistical Information for the Chi-Square Test | Japan | Finland | ||||
|---|---|---|---|---|---|---|---|
| Grades 7 and 8 | Grades 8 and 9 | Grades 7 to 9 | Grades 7 and 8 | Grades 8 and 9 | Grades 7 to 9 | ||
| Q1 | χ2(2) ≈ .19(Japan)/48.56(Finland), p < .05 | 1.6 | 6.7 | 8.3* | 20.2* | 4.0 | 24.2* |
| Q2 | χ2(2) mpa ≈;51.89(Japan)/8.68(Finland), p < .05 | 2.2 | 19.6* | 21.8* | 8.4* | 0.3 | 8.7* |
| Q3 | χ2(2) ≈ 20.29(Japan)/170.57(Finland), p < .05 | 9.2* | 7.0 | 16.2* | 38.2* | 12.1* | 50.3* |
| Q4 | χ2(2) ≈ 36.60(Japan)/19.55(Finland), p < .05 | 0.8 | 18.0* | 18.8* | 10.2* | 7.5* | 17.7* |
| Q5 | χ2(2)≈ 16.96(JPN)/ 26.54(FIN), p < .05 | 7.1 | 6.9 | 14.0* | 15.2* | 2.2 | 17.4* |
| Q6 | χ2(2)≈ 6.41(JPN)/24.51(FIN), p < .05 | 2.2 | 6.4 | 8.6* | 10.7* | 0.0 | 10.7* |
Note. First, a chi-square test was conducted for each problem to determine whether there was a significant difference between Japan and Finland at the 5% significance level, and significant differences were found for all problems. Subsequently, multiple comparisons (Holm method) were performed. When a significant difference was found, the difference in the proportion of correct answers was marked with an asterisk (*).