
Abstract
Solar radiation in urban canyons significantly impacts resident health and microclimates. Traditional measurements often oversimplify complex street geometries, failing to capture dynamic urban realities. Using central Shanghai as a case study, this research develops a high-precision framework for assessing solar radiation exposure by integrating street view images, deep learning, and spatial syntax. The results indicate that Pudong New Area and Baoshan District experience the highest levels of solar radiation in summer, while the city center exhibits relatively lower radiation intensity. The amount of radiation demonstrates clear monthly fluctuations with seasonal variation, gradually increasing from May to August and declining from September to October. Areas with high solar radiation and high spatial accessibility show a marked spatial concentration during summer, particularly in July and August. Overall, this study establishes a high-precision, scalable framework for measuring solar radiation, enabling accurate identification of high-risk exposure areas. It underscores the importance of enhancing greening and shading measures, especially in areas with both high radiation and high accessibility, and highlights the impact of seasonal changes on the urban thermal environment. These findings provide scientific support for urban planners and managers in improving urban livability and optimizing spatial layout.
Keywords
Introduction
With the continuous advancement of global urbanization and the intensification of climate change, the urban thermal environment has increasingly become a significant challenge to the sustainable development of cities worldwide (Cheval et al., 2024; Gao et al., 2024). Urban street canyons—complex spatial systems formed by the interweaving of streets, buildings, vegetation, and other elements—play a crucial role in shaping the urban microclimate (Gong et al., 2018; Miao et al., 2022). As primary components of urban public space, street canyons have a significant impact on the local climate conditions (Weiqi and Yunyu, 2020). The amount of solar radiation within these canyons is directly associated with the urban heat island effect, influencing not only energy consumption but also residents’ thermal comfort and health (Huang et al., 2015; Jin et al., 2017; Lin et al., 2013). Studies have shown that well-designed streets can effectively improve environmental quality, promote outdoor activities, and enhance overall urban livability (Xu et al., 2023). Thus, optimizing the design of urban street canyons to mitigate the adverse effects of solar radiation has become a key research focus in urban planning (Mohajeri et al., 2019; Tomasi et al., 2024).
The intensity of solar radiation received by street canyons interacts with their unique spatial structures to create distinct microclimatic environments, which significantly influence residents’ daily lives (Baek and Kim, 2025; Gong et al., 2019; Yang et al., 2026). Numerous studies have demonstrated a significant correlation between solar radiation, surface temperature, and the urban heat island effect (Djen et al., 1994; Ji et al., 2024; Manoli et al., 2020). On the one hand, the heat generated by solar radiation alters the thermal environment and affects individuals’ thermal comfort (Zhao et al., 2023). Research indicates that incoming solar radiation in urban streets is a critical parameter in determining human thermal comfort (Hodder and Parsons, 2006; Kurazumi et al., 2013; Richards and Edwards, 2017). During the summer, prolonged exposure to sunlight considerably heightens the risk of heat stress (Lin et al., 2010). Furthermore, high-density urban environments may trap solar radiation, exacerbating its cumulative impact over time (Li et al., 2024). On the other hand, solar radiation can directly affect human health (Glanz et al., 2007). Intense exposure may increase the risk of skin cancer, suppress immune function, impair vision, and affect mental well-being (Ji et al., 2024; Olsen et al., 2015). Previous studies have further pointed out that sustained high-intensity solar exposure elevates both physiological and psychological stress among residents, reducing urban space utilization and deterring outdoor activity (Huang et al., 2022). Under the combined effects of the urban heat island phenomenon and heatwaves, urban populations become more vulnerable to solar radiation (Heaviside et al., 2017; Ho et al., 2023). Therefore, accurate assessment and management of solar radiation in street canyons is of critical importance (Wang et al., 2024a).
Solar radiation exposure is closely associated with the urban thermal environment and residents’ heat risk (Li et al., 2026; Tan et al., 2024). On the one hand, solar shortwave radiation directly increases the net radiative load imposed on the human body, thereby elevating the mean radiant temperature and intensifying human heat stress. Even under the same air temperature conditions, differences in radiation exposure can lead to significant variations in thermal sensation and physiological burden. On the other hand, solar radiation interacts synergistically with other meteorological factors, such as air temperature, humidity, and wind speed, jointly driving the heat risk experienced by individuals in their surrounding environment. Exposure is generally classified into subjective exposure and objective exposure (Zhang et al., 2024). Subjective exposure emphasizes exposure experience and actual contact levels at the individual scale. It typically takes individuals as the unit of analysis and evaluates the solar radiation exposure they experience throughout their spatiotemporal behavioral processes by incorporating information such as personal activity trajectories and residence time. The resulting assessments often depend heavily on individual behavioral data and are easily influenced by population differences, behavioral heterogeneity, and sample availability, which limits their comparability across cases. By contrast, objective exposure takes space as the unit of analysis and focuses on the radiation exposure potential inherent in the environment itself. It emphasizes the quantitative measurement of spatial characteristics and the acquisition of exposure data under standardized rules, thereby enabling stable and reproducible descriptions of exposure differences across spaces. Compared with subjective exposure, objective exposure is more conducive to directly linking assessment results to street spaces and environmental elements, thereby providing stronger support for urban planning, design, and strategy formulation.
The intensity and distribution of solar radiation within urban street canyons are influenced by a combination of factors, including the solar trajectory, vegetation cover, and the geometric characteristics of the street network (Carrasco-Hernandez et al., 2015; Johansson, 2006; Lin et al., 2013). Tree canopies play a vital role in regulating the microclimate by blocking direct sunlight and facilitating photosynthesis (Armson et al., 2013; Onishi et al., 2010). The orientation and density of the street network also significantly affect the level of solar radiation exposure (Chen et al., 2022). East–west oriented streets tend to receive longer durations of direct sunlight, and the configuration of street layouts and vegetation design greatly influences the effectiveness of solar radiation modulation (Zhang et al., 2017). Geometric features of urban roads, such as network density and the number of intersections, can also determine the extent of radiation exposure in an area (Chen et al., 2022). In high-density urban zones, the likelihood of heat stress events tends to increase (Schmalwieser et al., 2010). The risk associated with solar thermal radiation is further shaped by the massing of buildings within street canyons, primarily due to their shading capacity (Ali-Toudert and Mayer, 2006; Zhang et al., 2017). Sanusi et al. (2016) found that roadside trees aligned along east–west oriented streets provide a stronger cooling effect on the microclimate of street canyons. At the same time, interactions between urban residents and street spaces profoundly influence the extent of solar radiation impacts (Wu et al., 2024; Yu and Ma, 2025). Streets with high accessibility often become focal points for public activity, thereby amplifying the risks of solar radiation due to frequent use (Lobo et al., 2023; Wang et al., 2022). Consequently, incorporating street accessibility as a factor has become an essential trend in the study of solar radiation in street canyons.
Despite recent advances in the study of solar radiation within urban street canyons, several critical issues remain unresolved: (1) Most simulation studies of solar radiation in urban street canyons rely on remote sensing data and field measurements. However, these methods often oversimplify the geometric morphology of urban street canyons (Carrasco-Hernandez et al., 2015), typically excluding the tree canopies of roadside vegetation(Li et al., 2018), which prevents the integration of spatial geometry’s impact on direct solar radiation and the thermal environment into calculations. (2) Although combining remote sensing images with field measurements can substantially improve measurement accuracy, such approaches involve significant labor and time costs when applied to large areas, making them impractical for extensive study regions(Richards and Edwards, 2017). Additionally, they are limited in their ability to accurately capture the fine-scale details and real-time changes of urban spaces. Hence, there is an urgent need for more convenient solar radiation estimation methods. (3) While road accessibility is often used to interpret urban spatial development issues, it also holds potential for assessing climate-related risks (Atakara and Allahmoradi, 2021). However, the correlation between the spatial distribution of solar radiation and urban street network accessibility has yet to be thoroughly explored.
To address these issues, this study takes the central urban area of Shanghai as a case study and proposes an assessment method for solar radiation in street canyons that integrates street view images, deep learning, and spatial syntax. It explores the interaction between solar radiation and spatial accessibility within street canyons and analyses the spatiotemporal dynamics of solar radiation exposure. This research aims to answer three main scientific questions: (1) How can the spatiotemporal dynamics of solar radiation in urban-scale street canyons be accurately simulated? (2) How do the characteristics of solar radiation in street canyons vary with geographic location and month? (3) How can high-risk urban areas requiring urgent optimization and intervention in terms of solar radiation exposure be identified? The findings of this study can provide insights for urban street planning and support the dynamic adjustment of future urban development.
The remainder of this paper is organized as follows. The next section provides a comprehensive review of recent progress in solar radiation studies in urban environments, as well as simulation and measurement methods. The following section outlines the data collection process and describes the analytical methods employed. The next section details the analysis results, followed by a discussion of the empirical findings, implications, and limitations in the following section. The final section concludes the paper.
Literature review
Solar radiation studies in urban environments
As the fundamental source of energy input to the Earth, solar radiation plays a vital role in the climate system, ecosystems, and the human living environment (Harding et al., 2024). Early research on solar radiation primarily focused on the global distribution patterns and temporal trends of solar irradiance. Kinsell (1975) established an empirical relationship between solar radiation and sunshine duration, laying the groundwork for subsequent estimation methods of solar radiation. By the end of the 20th century, as global concern over climate change intensified, the focus of solar radiation studies gradually shifted towards regional and local scales, with increasing attention to its distribution within urban environments. Arnfield (2003) conducted an in-depth investigation into the urban heat island effect, highlighting the significant influence of urban structures on the absorption and reflection of solar radiation, thereby affecting the urban microclimate. Ali-Toudert and Mayer (2006) further examined the spatial distribution of solar radiation within urban street canyons, revealing that the geometric characteristics of streets considerably impact the amount of radiation absorbed by human bodies and urban surfaces. Weiqi and Yunyu (2020) summarized how three-dimensional urban morphology—such as building height, spacing, and form—modifies surface energy balance and air flow, thereby influencing solar radiation distribution and the urban thermal environment.
In recent years, with growing public awareness of the relationship between climate and health, an increasing number of studies have focused on the multiple impacts of solar radiation on public health. On the one hand, appropriate levels of ultraviolet radiation are essential for the synthesis of vitamin D, which is critical to bone health, immune function, and more (Holick, 2004). On the other hand, excessive or prolonged exposure to solar radiation can trigger a range of health issues, including skin cancer, immunosuppression, and heat stress (Modenese et al., 2018; Olsen et al., 2015). Heaviside et al. (2017) pointed out that solar radiation, within the context of the urban heat island effect, can exacerbate heat-related mortality risks, particularly among the elderly and low-income groups. Ji et al. (2024) employed a data-driven model to explore the relationship between solar radiation and human thermal perception, emphasizing the need for coupling dynamic climatic exposure with health impact assessments. As urban street canyons constitute the primary spaces for daily travel and outdoor activities, their solar radiation characteristics are closely tied to residents’ health (Wang et al., 2024a). Lin et al. (2013) found that shading levels influence both the frequency and duration of public activities in urban parks, indirectly affecting psychological well-being. Consequently, the relationship between solar radiation and health has evolved from a singular focus on thermal physiology to encompass complex body–mind–behavior interactions.
Simulation and measurement of solar radiation
Accurate simulation of solar radiation is crucial in fields such as meteorology, ecology, and urban planning. Early measurement methods primarily relied on ground-based instruments, such as radiometers and sunshine recorders (Owczarek and Malinowska, 2023). With advances in computing technology, numerical simulation has become a key approach in solar radiation research. Various methods and tools have been developed to calculate solar radiation within urban street canyons. Matzarakis et al. (2007) successfully used the RayMan model to simulate solar radiation distribution in complex urban environments, demonstrating its applicability in urban microclimate research. Many other methods utilize geographic information systems and remote sensing imagery to calculate parameters such as canopy cover and vegetation indices, which help interpret the microclimatic regulatory functions of urban street canyons (Chen et al., 2006; Kong et al., 2014a, 2014b). However, these methods are limited to specific timeframes captured in satellite images and cannot simulate the detailed canopy structures and accurate solar paths required for precise solar radiation estimation.
With the widespread availability of high-resolution digital model data, simulating solar radiation within street canyons with greater accuracy has become possible. Nevertheless, such digital city models often lack representations of street tree canopies (Li et al., 2018). Xu et al. (2024) conducted precise measurements of solar radiation and the thermal environment within urban street canyons using ground-based hemispherical images, demonstrating that such images offer greater accuracy in simulating and measuring solar radiation in these settings. Lu et al. (2024) used a GAN-based approach to predict ground-level solar radiation distribution from 2D urban data. Tehrani et al. (2024) proposed a data-driven method based on artificial neural networks to simulate solar radiation based on urban morphology. Additionally, street-level imagery has emerged as a promising tool for solar radiation simulation and measurement. Particularly in street canyon settings, it has demonstrated higher accuracy than traditional algorithms (Wang et al., 2024b). Li et al. (2018) were the first to quantitatively analyze the shading effects of street trees on solar radiation using street view images, enhancing efficiency and accuracy through machine learning. Richards and Edwards (2017) further combined deep learning techniques with street imagery to accurately estimate solar radiation at the street scale, showcasing the potential of deep learning for refined urban research. Wang et al. (2024b) introduced street morphological features to improve street view image-based solar radiation estimation methods. These approaches provide critical references for the present study. However, research employing street imagery and deep learning techniques for solar radiation assessment remains scarce and necessitates further empirical validation and development.
Methodology
Study area and road data
This study focuses on the central urban area of Shanghai as the research site (Figure 1b). Shanghai is a major financial, cultural, and international gateway city in China. According to the Seventh National Census, the total population of Shanghai is approximately 24.87 million. The central urban area is the most developed part of the city, with more than half of the city’s total population residing there. The study area is delineated by the Outer Ring Road of Shanghai, covering a land area of 664 square kilometers. Within this region, a wide variety of street canyon types are present, ranging from high-rise buildings in the financial district to preserved traditional residential structures. Shanghai is characterized by a subtropical monsoon climate, with an annual average temperature of 17.6 °C, total annual sunshine duration of 1,885.9 hours, and average annual precipitation of 1,173.4 millimeters. Summers are typically very hot, with average monthly temperatures exceeding 17.5 °C from May to October. The spatial variability in street canyon morphology and the relatively high summer temperatures make Shanghai an ideal case study area for examining the impact of solar radiation on thermal comfort. OpenStreetMap (OSM) contains road network data for the majority of major cities worldwide. In this study, road network data for Shanghai’s central urban area were downloaded from OSM. These data were used to generate coordinates for collecting street view images and to analyze urban street accessibility indicators.
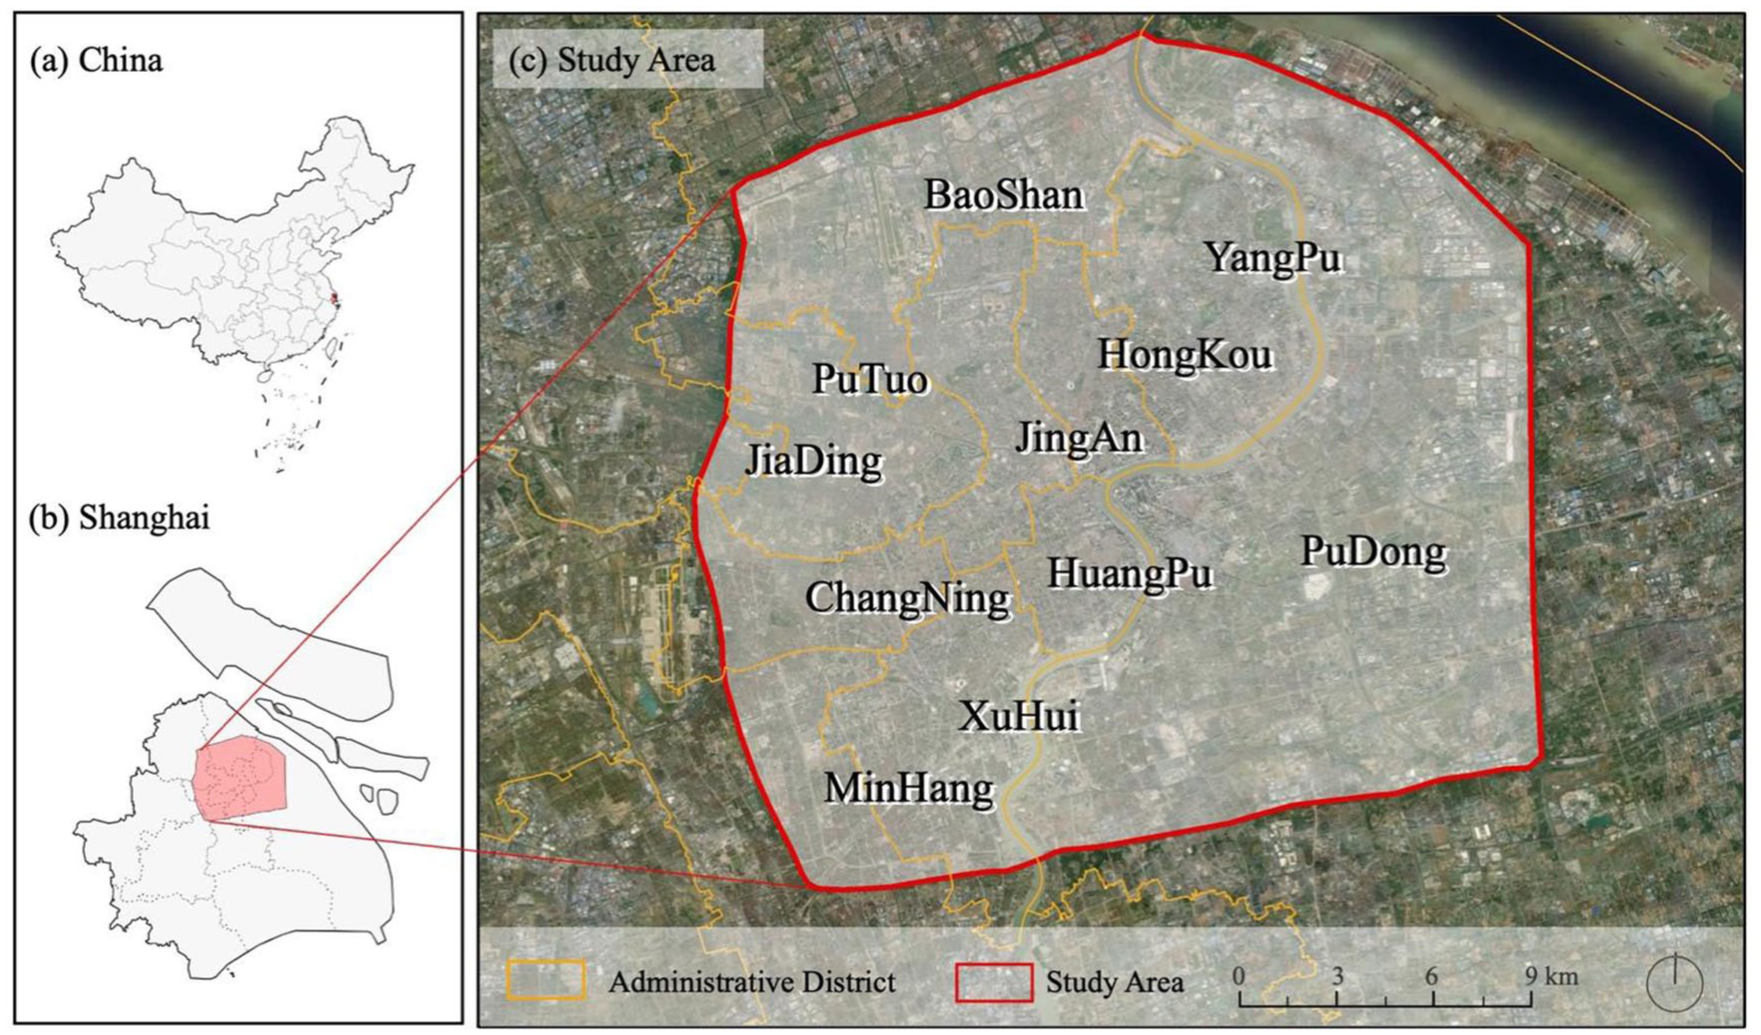
Study area. (a) map of China. (b) map of Shanghai. (c) study area.
Street view images data collection and seasonal filtering
Street view images has been widely utilized in urban studies and has demonstrated high accuracy and reliability in spatial analysis (Ito and Biljecki, 2021; Zhang et al., 2025). In this study, street view images data from a fixed year were collected for the central urban area of Shanghai, in order to eliminate estimation errors arising from temporal variations in urban street features. The selection of street view images in this study was primarily based on two considerations. (1) The period from May to October covers the season in the study area characterized by relatively high solar elevation angles, stronger shortwave radiation, and more pronounced pedestrian heat exposure. (2) During this period, vegetation is in the growing season with a relatively high leaf area index, resulting in more stable street shading characteristics. This helps reduce shading differences caused by leaf fall, dead branches, and other seasonal vegetation changes, thereby improving the consistency of radiation exposure estimation across different street segments and enhancing the principles of temporal consistency and comparability.
The specific steps are as follows: First, the street network was extracted from OpenStreetMap (OSM), and sampling points were generated at 50-meter intervals along the streets (Figure 1c). In total, 71,546 sampling points were created. Second, based on the coordinates of these points, we retrieved historical street view images using the Baidu Maps Time Machine service (Figure 2a). Each coordinate was used to obtain a unique image ID corresponding to different time-stamped images. This ID was then used to extract the associated metadata for each image (Figure 2b), which included historical capture dates. Below is an example of the metadata URL for a street view image captured at a specific location (longitude: 121.4953441, latitude: 31.2398195, https://mapsv0.bdimg.com/?qt=sdata&sid=09000300121905211356019738P). Third, using these sampling coordinates, all available metadata were collected, resulting in a total of 214,376 entries. We employed the Pandas library to perform statistical analysis of the data and examine the temporal distribution of historical capture dates. Points were filtered based on two criteria: the capture date must fall between May and October of 2019. A total of 48,417 points met these criteria. Fourth, using the unique IDs identified in the previous step, URLs were constructed to access the image servers. For each point, two hemispherical images (left and right) were retrieved, each with a resolution of 512 × 512 pixels (Figure 3a). These left and right hemispheres were then stitched together using a custom-developed script to form a complete panoramic street view image.

Schematic diagram of the street view image time machine collection. (a) Baidu Map Platform Street View Time Machine. (b) Street View Image through Time Machine.

Using Baidu street view panorama for azimuth fisheye view. (a) Example of panorama metadata URL. (b) A cylindrical Baidu street view panorama. (c) The generated fisheye image based on the geometrical transform model, adjust to generate the correct orientation fisheye image.
Generation and orientation rotation of fisheye images
In this study, we transform these Baidu street view panoramic images from equidistant cylindrical projection to equidistant azimuthal projection to create fisheye images (Li and Ratti, 2018). The mathematical model for the transformation is detailed in Figure 3b. Here, W c and H c are the width and height of the panoramic image, so the radius r0 of the fisheye image is Wc/2π, and the width and height of the fisheye image are Wc/π. Thus, the center of the fisheye image (C x , C y ) can be calculated by Equation (1). For any pixel position (x f , y f ) in the fisheye image, the corresponding pixel position on the panoramic image (x c , y c ) can be obtained by Equation (2) and (3).


The angle θ between any coordinate in the fisheye image and the starting position and the radius r from the center is calculated by equations (4) and (5).
Based on the above mathematical model, the street view panorama is transformed into a fisheye image. However, all panoramic images are in the form of left tail and right head of the car, so the fisheye image generated does not have the north direction in the actual geographical space at the top. Therefore, it is necessary to use the angle between the camera and the true north side when capturing the photo from the metadata. The rotation angle is calculated using Equation (6). The opencv tool is used to process the image for rotation, which is consistently performed counterclockwise. The fisheye image is rotated to the top and oriented towards the north direction in geographical space (Figure 3c).

In Equation (6), θ n is the MoveDir from the Baidu street view panorama metadata and θ m is the angle calculated for counterclockwise rotation of the image using opencv (Figure 3c). This enables the rotated fisheye image to have the same coordinate system as the projection of the sun’s path on a two-dimensional plane. This makes it possible to superimpose the sun’s path on the fisheye image, and to further calculate the solar radiation and street thermal comfort in this study.
Semantic image segmentation and estimation of solar radiation
The study utilized an image semantic segmentation method based on the SegNet structure. SegNet is an open-source project for image segmentation developed and announced by the Cambridge University team in 2015. This project can classify the semantic affiliations of objects in images, such as the sky, roads, plants, etc., and can be accurate to the pixel level (Badrinarayanan et al., 2016). SegNet is one of the most classic and widely applied deep learning algorithms for image segmentation, performing excellently in extracting spatial features from low-resolution images. The neural network structure used in this study was tested for image semantic segmentation tasks, achieving a pixel comparison accuracy of 82.538% in the training dataset and 68.432% in the test dataset. The training dataset selected was the ADE_20K dataset, which includes objects from 150 daily life scenarios, including the sky, roads, cars, plants, etc. We used this method to identify the pixel locations of the sky and plants. Subsequently, we could determine whether the sun’s position in the sky was obscured by plants. This further allows us to estimate the total amount of radiation produced by direct and scattered sunlight at different times.
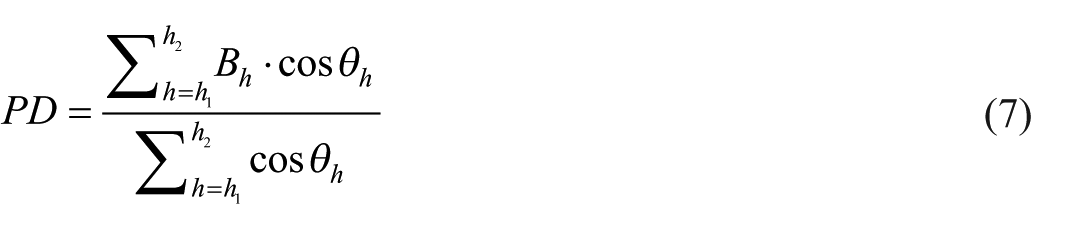
The precise location of the sun can be calculated using Pysolar based on geographical coordinates and time. The sun’s movement trajectory is overlapped with the fisheye diagram to measure the sunshine radiation time. Figure 4 shows the movement trajectory of the sun in the summer of 2019. The time period spans from May to October, with the 15th of each month. The movement trajectory records the sun’s position every 10 minutes. If the sun is not in the sky’s position in the fisheye diagram, the sunlight will be blocked by plants and buildings, resulting in high thermal comfort at that moment. Solar radiation is composed of direct and diffuse radiation (Anderson, 1964; Fu and Rich, 2002). Based on the fisheye diagram generated by Baidu street view panoramic images, it is possible to reasonably predict solar radiation in urban streets (Rich, 1989). For direct radiation, it is calculated by the proportion of the intersection of the solar path with the sky pixels in the fisheye image. The calculation process can be expressed by Equation (7). In this, h 1 is the sunrise time, and h 2 is the sunset time. θ h denotes the solar zenith angle at time h. B h represents whether the sun is blocked at time h, denoted by Boolean values 0 or 1.
Diffuse radiation is the form of sunlight scattered in the atmosphere. The amount of diffuse radiation can be estimated by the distribution of shading obstacles and diffuse sky (Rich, 1989), based on the calculation method of related direction research (Richards and Edwards, 2017). Assuming that diffuse radiation is evenly distributed in the sky, the sky is divided into 8 × 16 sky sectors to create a sky map. The proportion of diffuse radiation reaching the ground can be predicted by Equation (8). In this, Ga,z is the proportion of visible sky obtained from image semantic segmentation; θa,z,2 and θa,z,1 are the zenith angles of the sky sector boundaries; θ z is the solar zenith angle at the centroid of the sky sector.

The total radiation of the street can be calculated by adding the total amount of direct solar radiation and the total amount of scattered solar radiation. The total solar direct radiation Rad di and total solar diffuse radiation Rad dif in Equation (9) are collected by ground station data. This data comes from the National Solar Radiation Database (http://www.nrel.gov/rredc/). Through this data, the average direct and diffuse radiation in Shanghai from May 1, 2019, to October 31, 2019, were found to be 3180.038043 Wh/m2 and 2516.869565 Wh/m2 respectively.

Fisheye diagrams are used to calculate solar radiation and thermal comfort. (a) Example of fisheye image semantic segmentation. (b) The trajectory of the sun from May to October.
Measuring street accessibility based on space syntax
The application of space syntax allows for the simplification of complex street designs into mathematical graphs and nodes, thereby enabling the analysis of spatial characteristics within urban planning (Dawes et al., 2021). In urban spatial studies, axial models and segment models are commonly employed (Atakara and Allahmoradi, 2021). However, the limitations of the axial model have become increasingly apparent in large-scale urban research (Hillier and Iida, 2005; Turner, 2007). A key issue is that axial models do not adequately account for the spatial scale of urban environments (Pafka et al., 2020), and constructing such models is time-consuming, making them unsuitable for handling extensive spatial datasets. Furthermore, as this study aims to investigate the accessibility of residents’ daily mobility, it is essential to incorporate typical walking distances as a radius for accessibility analysis—something the axial model cannot accommodate. Therefore, this study adopts the segment model, derived from the axial model, to measure street accessibility within urban areas.
The segment model offers three analytical models that comprehensively examine the topological, angular, and metric geometries of street networks. These modes differ in how they define the “shortest path.” In the angular mode of the segment model, the shortest path is defined as the route with the smallest cumulative turning angle between segments—this being the most commonly used analytical mode within the segment model (Hillier and Iida, 2005). The angular mode aligns more closely with human spatial cognition during natural movement (Lerman et al., 2014). Individuals typically lack a global understanding of urban space and thus do not deliberately choose the shortest metric distance. Instead, streets with minimal angular deviation appear visually straighter and perceptually closer, often being perceived as long and straight routes that people are more likely to select (van Nes and Yamu, 2021).
Consequently, this study employs the angular mode of the segment model to assess urban street accessibility. For robust data preparation, OSM line data will be used as the base input for the space syntax model. ArcGIS software will be used to generate buffer zones along roads, from which centerlines will be extracted to construct a refined street network. This network will then undergo processes such as street merging, simplification, and topological correction. Subsequently, accessibility is calculated using Equation (10), where C i represents the accessibility value of space i, d pq denotes the shortest path between spaces p and q, and d pq (i) indicates the shortest path between spaces p and q that includes space i (p < q, p = 1, 2, 3, . . ., n−1, q = 2,3,4,. . .,n).

We will employ DepthmapX to conduct the visualization of accessibility, as this tool is suitable for calculating accessibility across various scales of urban street networks. Following previous studies (Wang et al., 2022; Zhang et al., 2024), we used the Choice metric to represent accessibility. The accessibility radius is defined as the distance from each segment on all accessible streets and roads to a specified threshold (Xia et al., 2019). Based on the average walking commute distance of approximately 500 meters for urban residents in China (Lyu and Forsyth, 2021), we set 500 meters as the accessibility radius. This allows us to calculate an accessibility value for each individual street segment.
Results
Geospatial distribution of summer solar radiation
A total of 71,546 sampling points were generated along the streets, yielding 214,376 data records. Given the method used to calculate solar radiation in this study, seasonally variable vegetation, particularly trees, emerged as a primary influencing factor. We further filtered the street view metadata and extracted 48,417 valid sampling points that met the criteria, thereby representing solar radiation conditions from May to October. Although 32.327% of the street view images points lacked available images, the valid points sufficiently covered the study area.
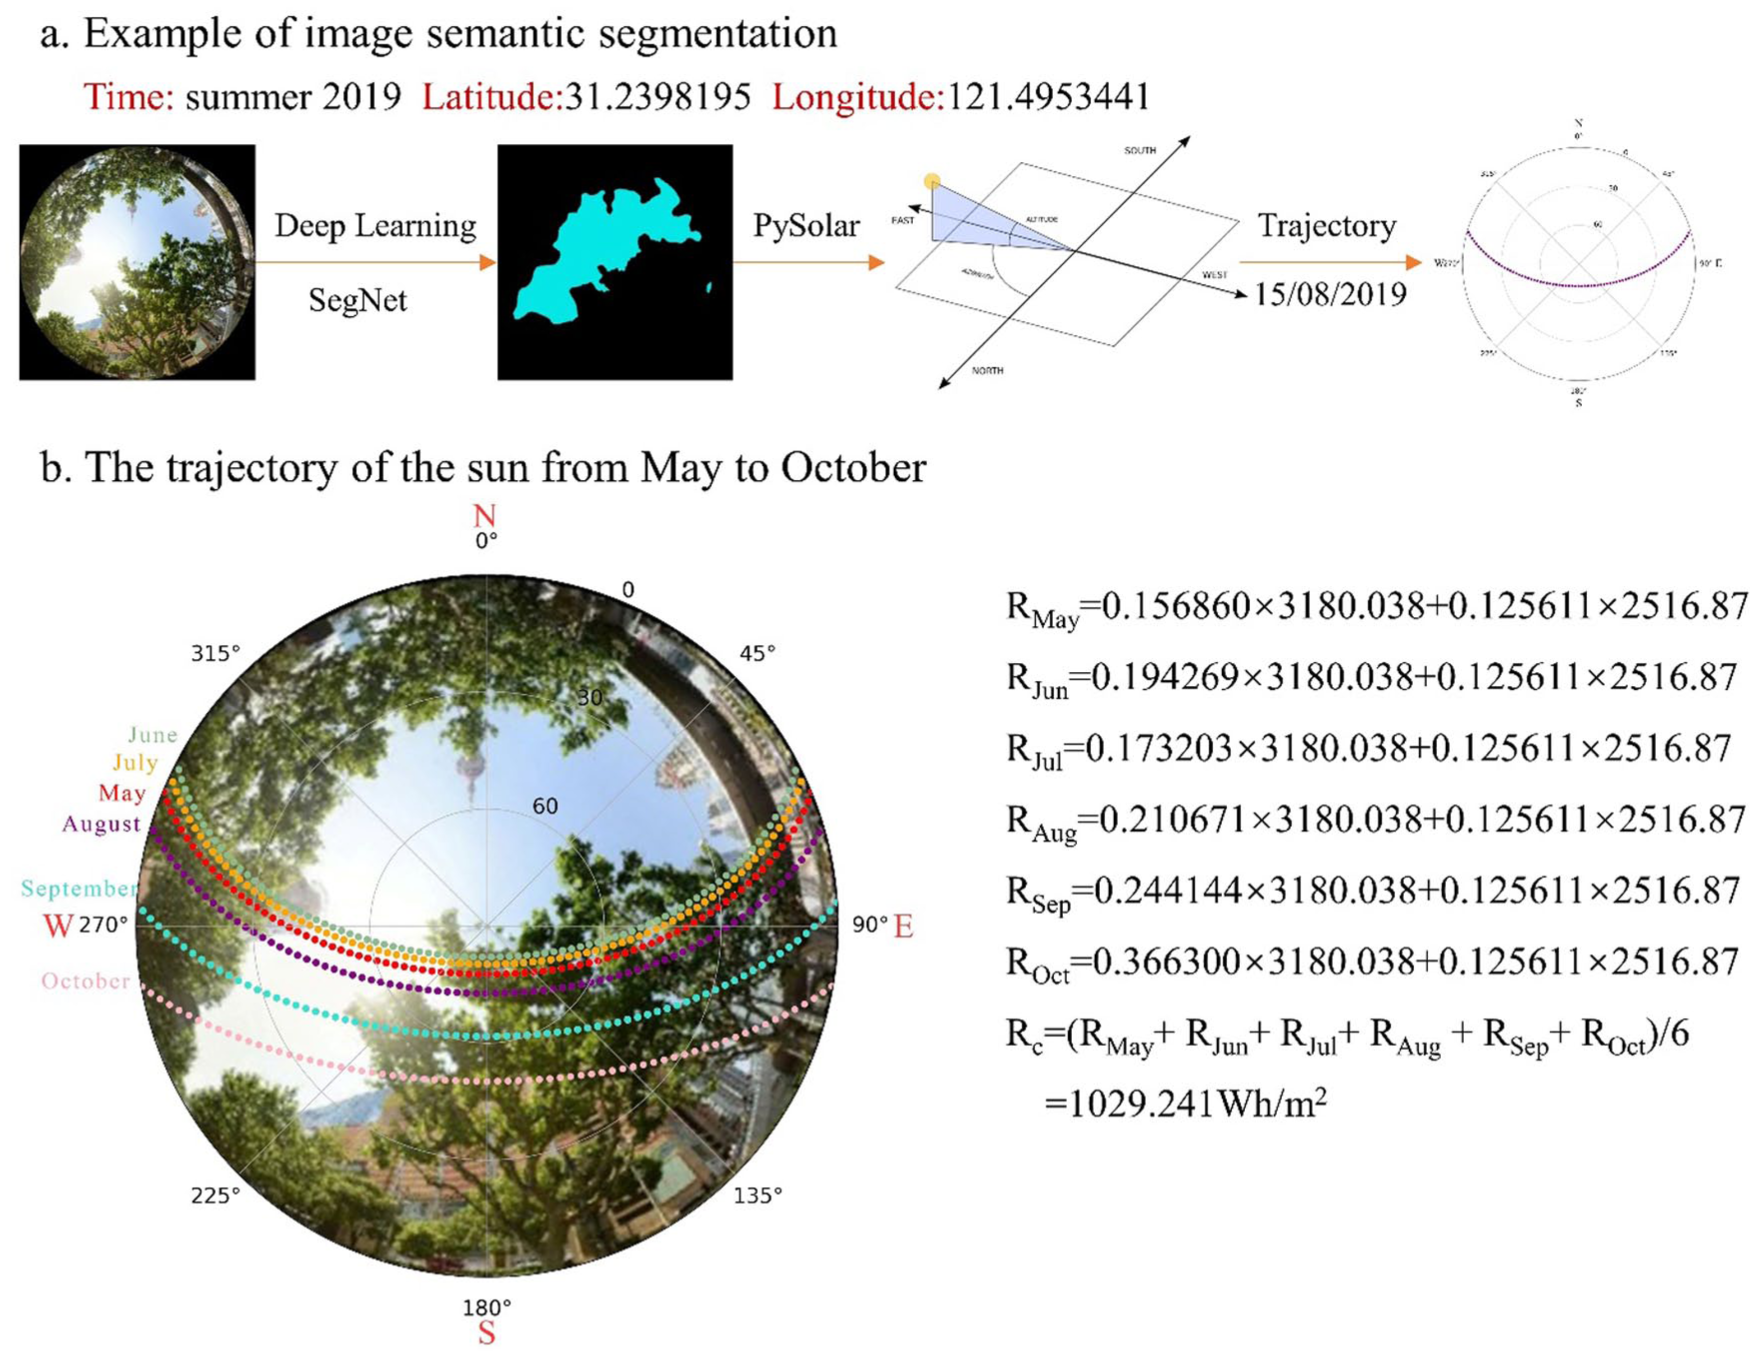
The method proposed in this study enabled the mapping of sunshine duration and the exploration of solar radiation at the urban scale. We present the geospatial distribution of solar radiation for a single calendar year. Figure 5 illustrates the solar radiation across the study area from May to October 2019, deepening our understanding of its geospatial patterns across different administrative districts during the summer months. Pudong New Area recorded the highest intensity of summer solar radiation, with an average of 2715.31372 Wh/m2, followed by Baoshan District at 2663.61397 Wh/m2. This can largely be attributed to their geographic locations in the eastern and northern parts of Shanghai. As these areas began urban development relatively recently, street trees are younger with less canopy coverage, offering limited shading. Moreover, roadways in these districts tend to be wider. Minhang and Putuo districts also exhibited high summer solar radiation, with average values of 2460.98451 Wh/m2 and 2329.4666 Wh/m2, respectively. Although not located in the city’s core, these southern and western districts nonetheless experience substantial solar exposure, slightly lower than that of Pudong and Baoshan but still significant. Yangpu and Xuhui districts, situated in the eastern and southern parts of Shanghai, had relatively lower average solar radiation values of 2196.34089 Wh/m2 and 2042.223 Wh/m2, respectively. These differences are influenced by both geographic location and topographical features. Changning and Jing’an districts, located in the city center, had similar average summer solar radiation intensities—2039.34227 Wh/m2 and 2034.58229 Wh/m2, respectively—both of which are relatively low due to the obstruction of sunlight by dense urban structures. Lastly, Hongkou and Huangpu districts reported the lowest levels, with averages of 1975.73087 Wh/m2 and 1720.33194 Wh/m2, respectively. These districts are located in the northern and central parts of Shanghai, where tall buildings in the city center further reduce direct sunlight exposure. These findings reveal significant geospatial variation in summer solar radiation across Shanghai’s administrative districts, offering valuable insights for regional solar energy resource development and research into urban heat island effects.
Monthly solar radiation levels.
Temporal trends in summer solar radiation
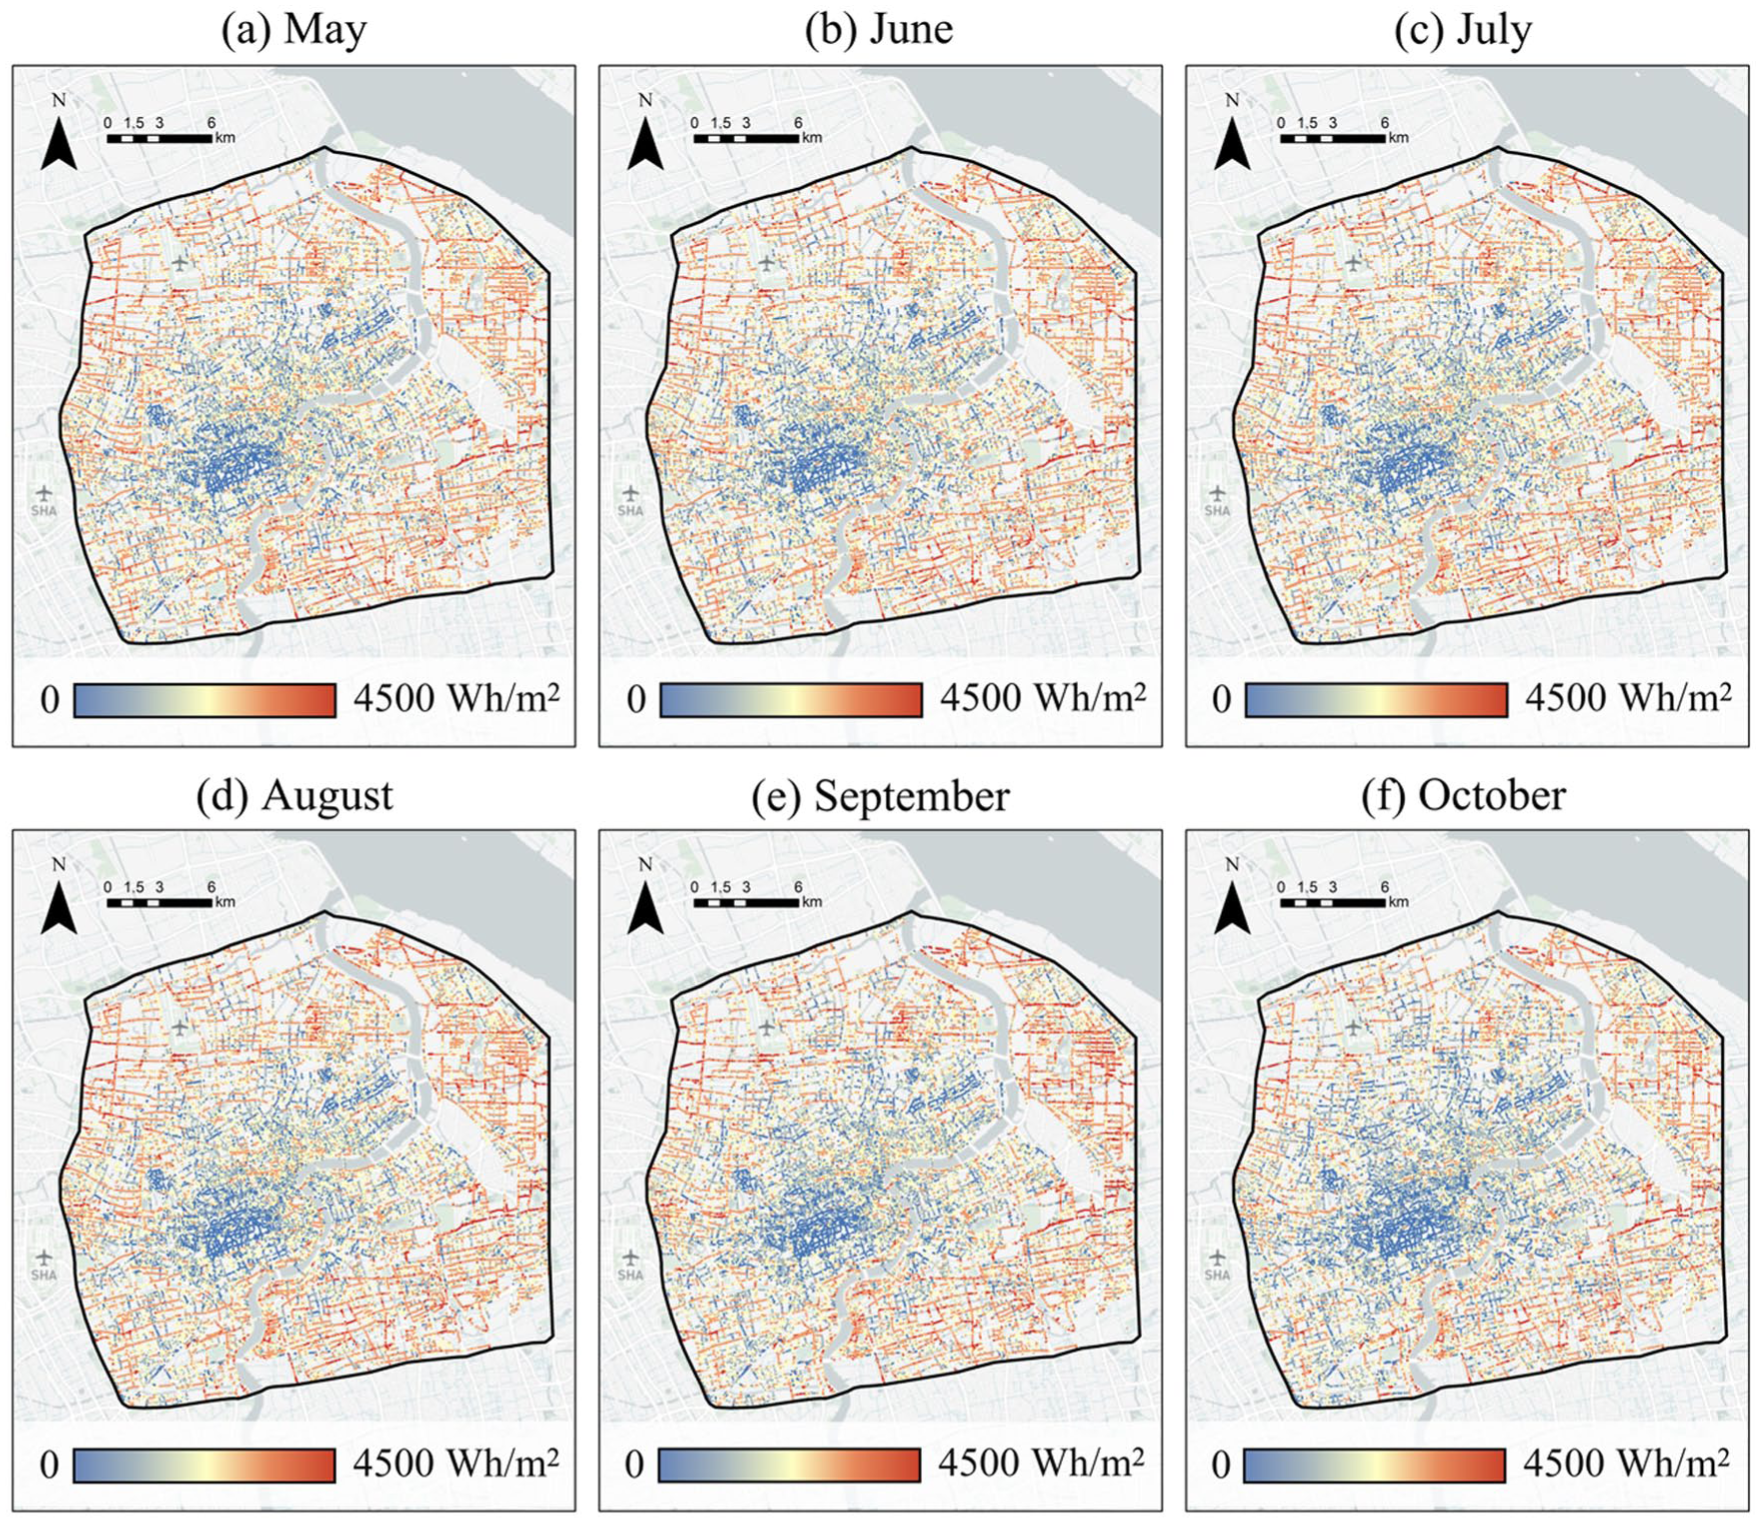
Table 1 and Figure 6 present the monthly solar radiation statistics across various administrative districts, while Figure 7 illustrates the trends in monthly solar radiation for each district. Overall, a clear pattern of monthly variation in solar radiation is evident. From May to August, solar radiation levels progressively increase across all districts, with July and August marking the peak. The wide range of values during these months indicates substantial variability in solar radiation between different districts. As the season transitions into September and October, solar radiation levels decline, reflecting the seasonal reduction in solar intensity. Notably, districts such as Pudong and Baoshan demonstrate higher median values and broader distributions in monthly solar radiation, suggesting consistently higher solar radiation levels in these areas. In contrast, districts such as Xuhui and Changning display more concentrated distributions with narrower ranges, indicating that the denser urban fabric and shading in central districts significantly attenuate solar radiation. In May, Pudong recorded the highest solar radiation at 2725.11 Wh/m2, while Huangpu experienced the lowest at 1779.53 Wh/m2. These disparities are likely due to differences in geographical location and environmental conditions between the two areas. As the summer progresses, solar radiation reaches its annual peak in August. All administrative districts showed an increase in radiation, with Pudong reaching 2770.48 Wh/m2 and Huangpu 1789.19 Wh/m2. In September and October, solar radiation levels declined across all districts, likely due to the seasonal transition from summer to autumn, resulting in a lower solar angle and reduced radiation intensity. For instance, in Pudong, solar radiation dropped to 2743.06 Wh/m2 in September and further to 2569.04 Wh/m2 in October. In summary, the temporal trend of solar radiation follows a general pattern of gradual increase from May to August, followed by a decline in September and October. This trend aligns well with the conventional understanding of seasonal solar radiation dynamics.
Statistics on the trend of solar radiation (Wh/m2) changes in summer months in different administrative regions.

Monthly dynamic box plots of solar radiation across different administrative districts. (a) Pudong New Area. (b) Baoshan District. (c) Minhang District. (d) Putuo District. (e) Yangpu District. (f) Xuhui District. (g) Changning District. (h) Jing’an District. (i) Hongkou District. (j) Huangpu District.
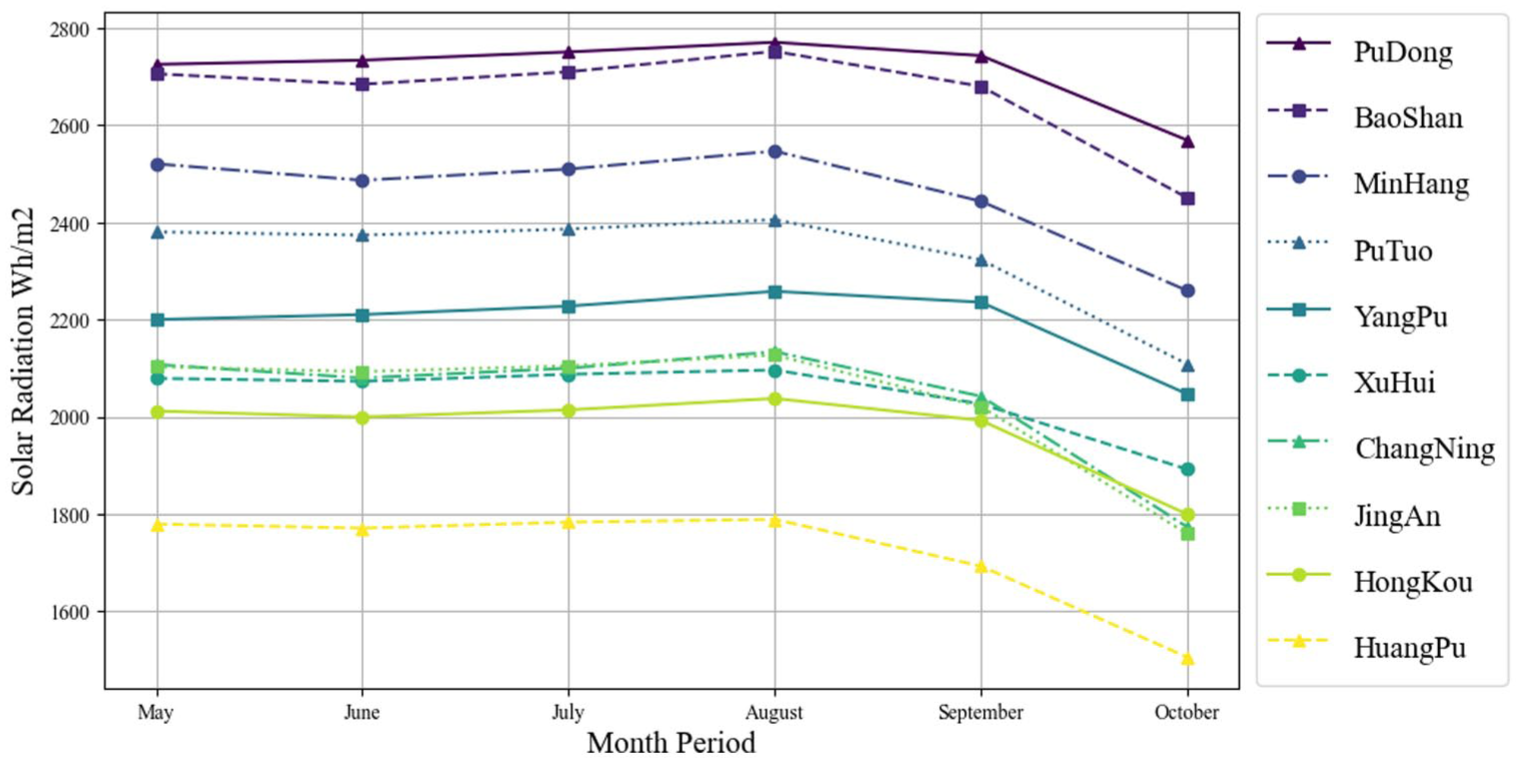
Line chart showing the monthly variation trends of summer solar radiation (Wh/m2) across different administrative districts.
Overlay analysis of solar radiation and street accessibility
This study integrates solar radiation data within urban street canyons with spatial accessibility metrics. An overlay analysis was conducted using the top 20% of both solar radiation intensity and street accessibility values, in order to further elucidate the characteristics of solar radiation along urban streets. Figure 8 illustrates the monthly overlay distribution patterns in the central urban area of Shanghai from May to October. In May, streets with both high accessibility and high solar radiation were scattered, primarily located in the north-western and south-eastern parts of the urban area. In June, the extent of high solar radiation zones increased significantly, with a more clustered and contiguous distribution observed in the eastern and north-western parts of the city center. By July, coinciding with the peak summer heat, there was a marked increase in streets with both high accessibility and high solar radiation, particularly concentrated on the eastern side of the Huangpu River and in northern areas such as Hongkou District. These regions exhibited relatively poor solar shielding, indicating an elevated risk of thermal stress. In August, although high solar radiation persisted, the overlap between street accessibility and radiation became more dispersed. Some western central districts began to show reduced radiation levels, suggesting improved shading effectiveness. In September, solar radiation intensity began to decline; however, overlapping zones of high accessibility and high radiation remained concentrated in the northern and eastern central areas, reflecting the transitional characteristics of the season. By October, high-radiation zones had significantly diminished, and the western and southern parts of the central city demonstrated areas with high accessibility yet low solar radiation, indicating favorable thermal comfort conditions.
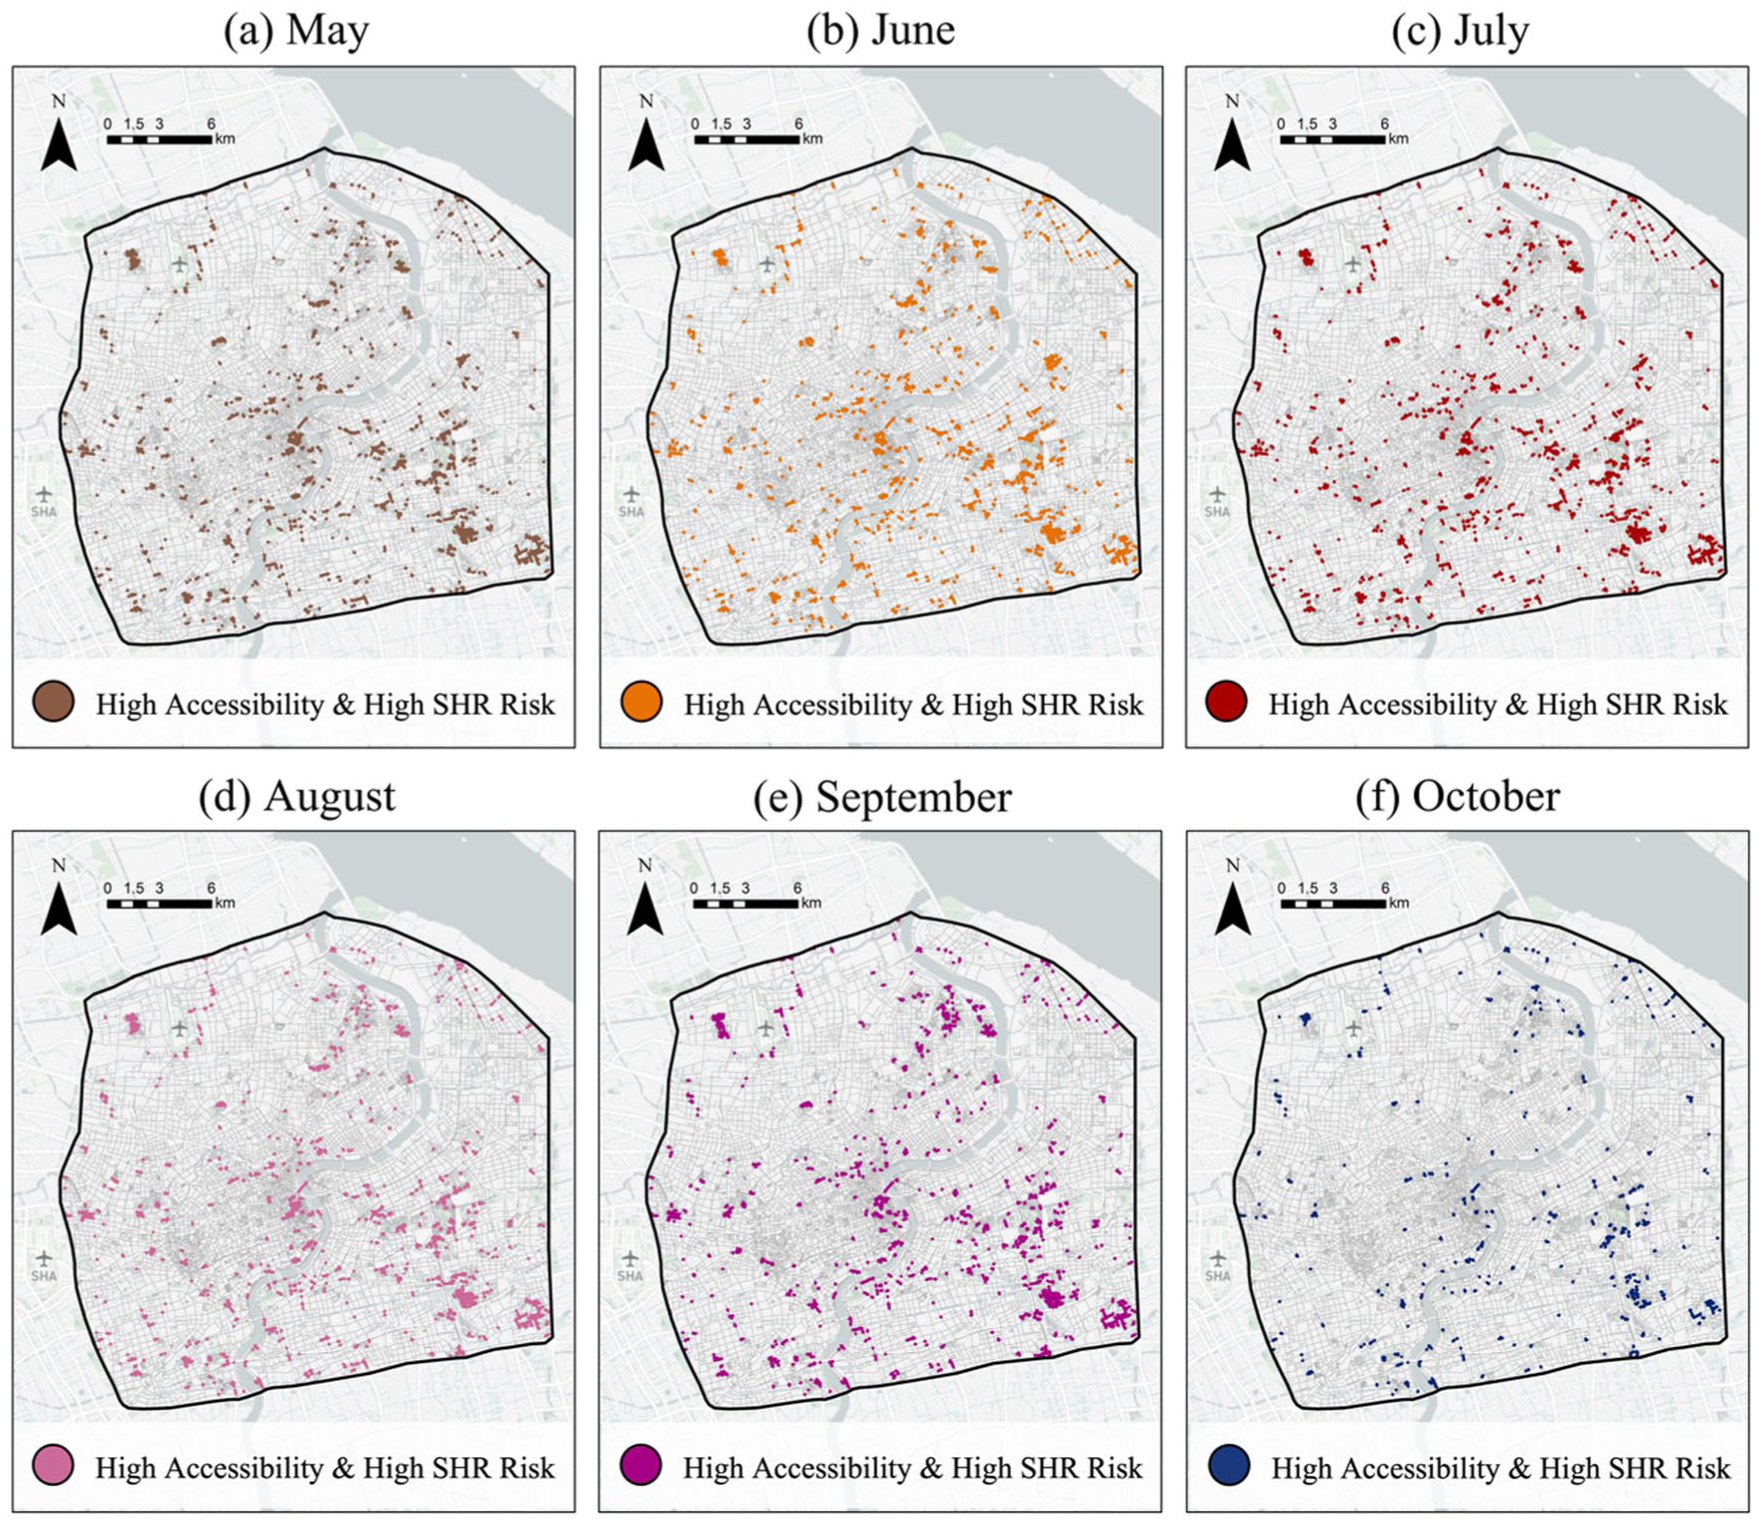
Geospatial distribution of the overlay analysis of high solar radiation and high accessibility across different months.
Overall, the findings indicate that zones of both high accessibility and high solar radiation are predominantly located in the eastern and northern parts of the city center during the peak summer months of July and August. These areas require enhanced greening and shading interventions. Conversely, the western and southern parts of the city center exhibit relatively high thermal comfort under lower radiation conditions, reflecting effective shading and favorable urban form characteristics. This study provides practical guidance for urban planners, underscoring the importance of implementing greening and shading improvements in high-radiation, high-accessibility zones, while also highlighting the critical role of seasonal variation in managing urban thermal comfort.
To more intuitively investigate the variation in solar radiation under different levels of accessibility, this study selected representative sampling points from various areas. Figure 9 presents examples that reflect the characteristics of different regions. Area A represents a zone of high accessibility but low solar radiation, with radiation levels below 1000 Wh/m2. This area is primarily composed of residential neighborhoods with low-rise buildings. The streets are relatively narrow and mostly consist of secondary and tertiary residential roads, which significantly contribute to the reduced solar radiation. Urban development in Area A began relatively early, resulting in mature vegetation with dense foliage that provides effective shading. Areas B and C both represent zones of high accessibility and high solar radiation, with radiation levels exceeding 2500 Wh/m2. However, the causes behind the conditions in these two areas differ. Area B is located in Huangpu District, the core of the central urban area of Shanghai. Although the area features wide roads, which allow prolonged periods of direct sunlight, the presence of tall buildings only partially mitigates solar exposure. Moreover, the lack of adequate vegetation fails to shield pedestrians from extended exposure to high solar radiation. While Area C also exhibits high accessibility and high solar radiation, a clear distinction from Area B can be observed in Figure 9. Located in the more recently developed Pudong New Area, Area C similarly features wide roads. However, dense and well-planned street tree planting along both sides of the roads enhances shading. Therefore, despite its high accessibility and solar radiation, Area C is not among the areas in most urgent need of thermal comfort improvements in urban space. In Figure 10, we present typical streetscape scenarios for each of the highlighted areas to aid in understanding the actual street environments. These visuals correspond to the measured solar radiation levels and solar path trajectories.
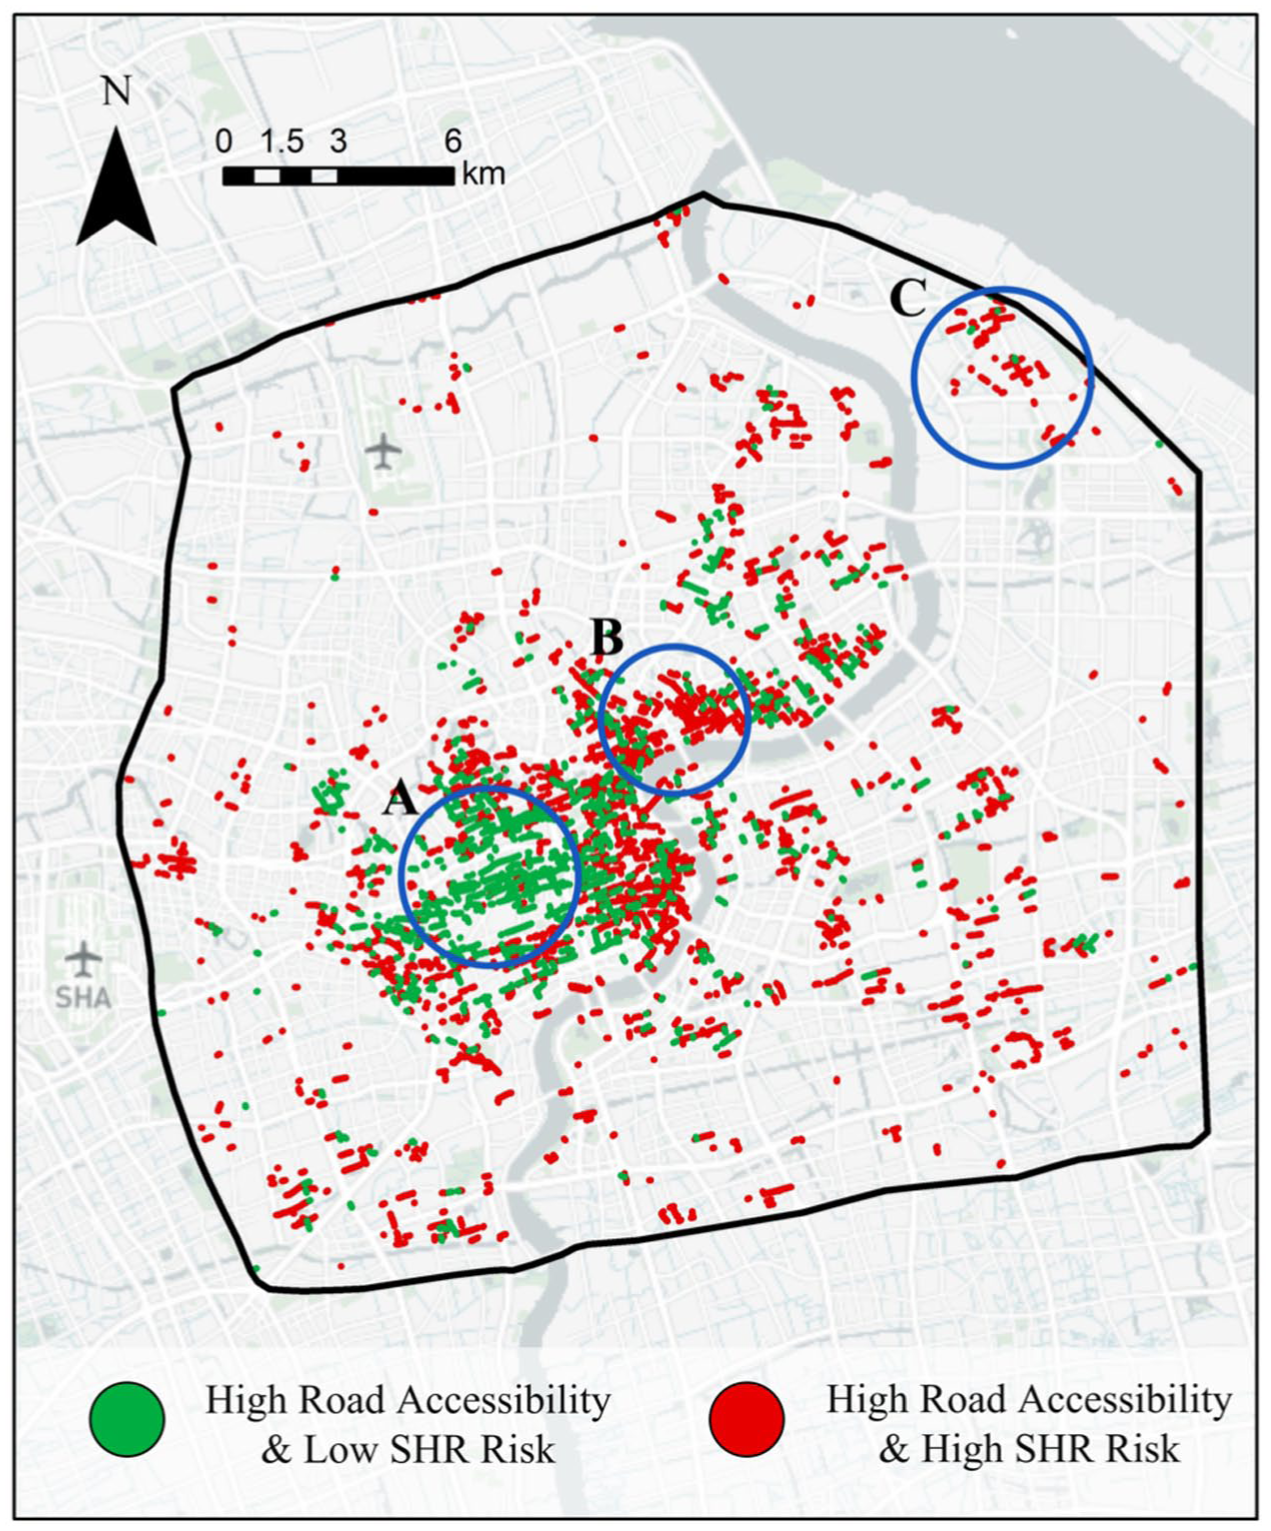
Geospatial distribution of the overlay analysis of high accessibility with high and low solar radiation. Area A represents a cluster of high accessibility with low solar radiation; Areas B and C represent clusters of high accessibility with high solar radiation.
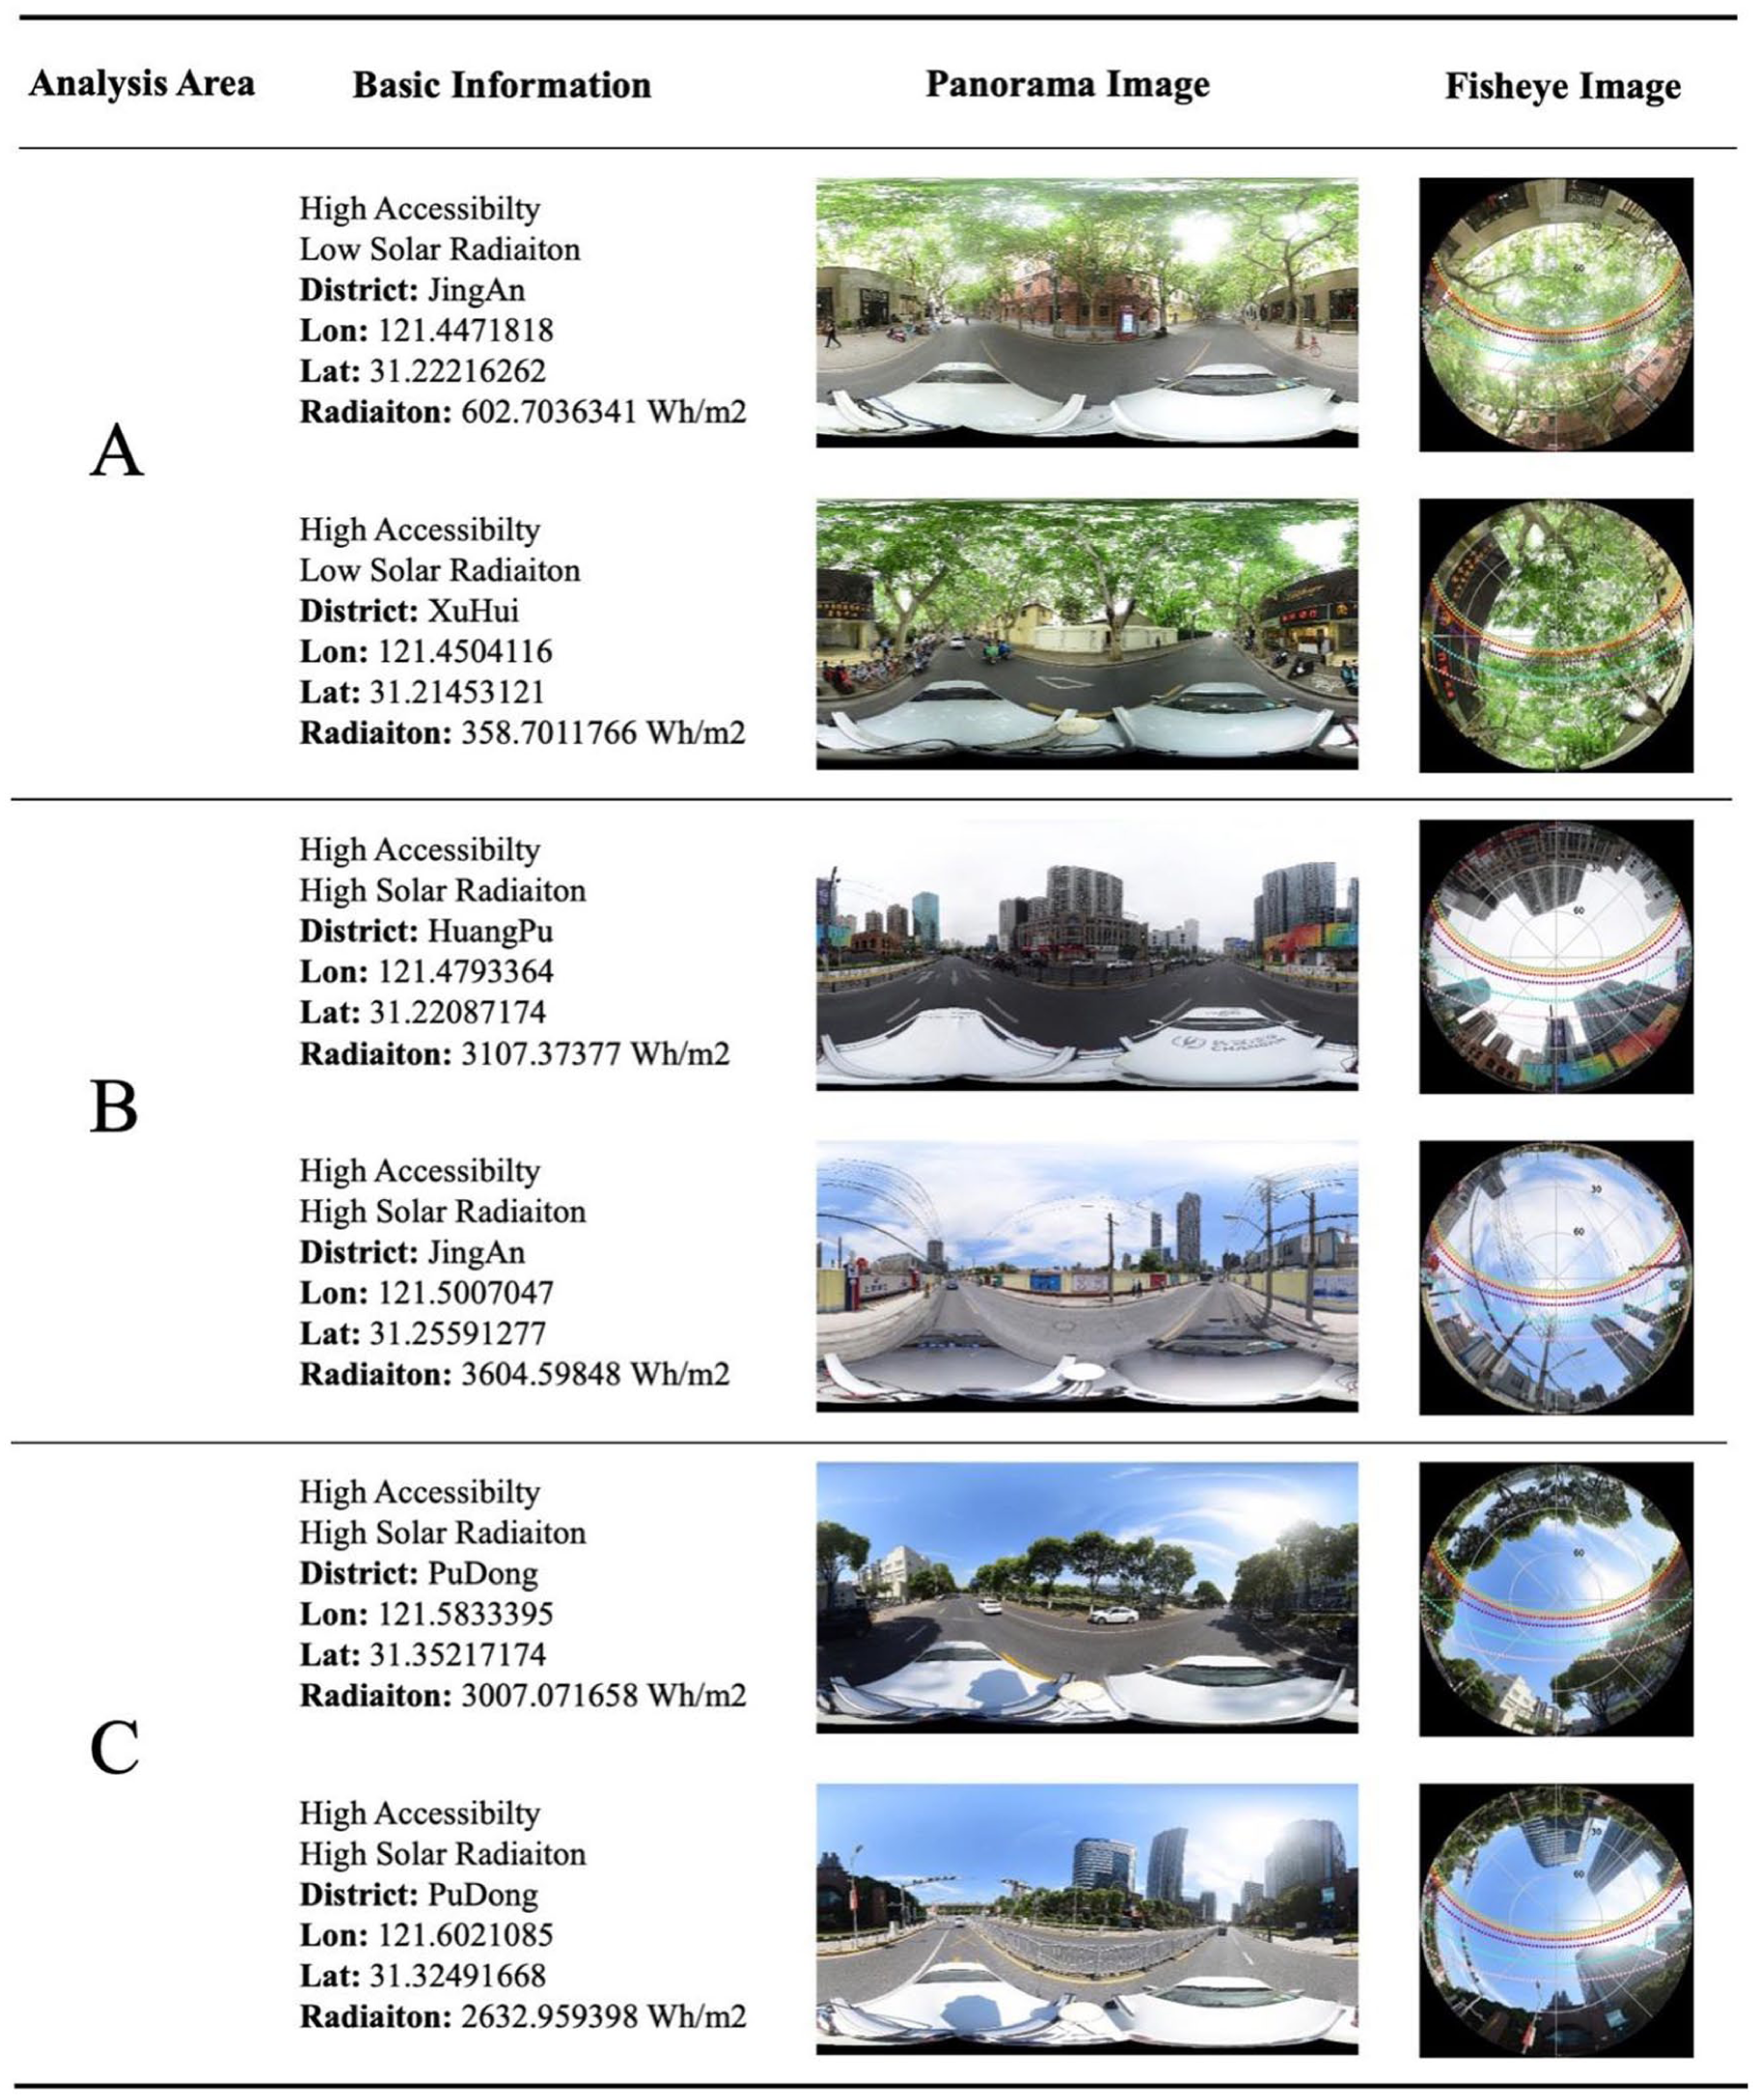
Example diagram of urban streetscape solar radiation information. A, B, C respectively represents the aggregation analysis areas in Figure 9. Among them, A represents high accessibility and low solar radiation. B and C represent high accessibility and high solar radiation.
Discussion
Spatial mechanisms of urban street canyon solar radiation exposure
Based on street view images, this study constructed fisheye-perspective images and incorporated solar altitude trajectories to assess solar radiation exposure in urban street canyons within the central urban area of Shanghai from May to October. Unlike previous studies relying on thermal sensing or remote temperature data, this research focuses on the geometric mechanisms by which direct and diffuse radiation are physically obstructed in street spaces, emphasizing a triadic coupling mechanism of “obstruction–solar trajectory–sky view factor.” In high-density urban areas, building height and street orientation often jointly affect sky visibility and shading angles (Johansson, 2006). The results indicate that although core urban districts such as Huangpu and Hongkou exhibit high population density, their dense building clusters frequently create extensive shading along solar paths, leading to relatively low solar radiation exposure during summer. This aligns with the urban climate structure theory proposed by Wolters and Brandsma (2012), which suggests that “the higher the urban density, the lower the sky view factor and the stronger the radiation blockage.” Significant disparities in solar exposure levels were found among different areas due to variations in shading systems, including canopy density and building setback ratios. In certain sections of Pudong New Area, which feature wide streets and immature tree canopies, the solar path remains largely unobstructed for extended periods, resulting in a dual-exposure phenomenon of “high radiation + high accessibility” (Figure 9c). This illustrates how underdeveloped shading systems in newly developed urban areas may lead to delayed regulation of thermal environments.
The study further reveals that the temporal dynamics of the solar trajectory determine the seasonal effectiveness of shading. From May to August, the sun’s path rises higher, and the solar angle becomes more vertical, significantly reducing the shading effect of most obstructions—rendering tree canopies crucial for shading. In contrast, from September to October, as the solar trajectory flattens, building shadows regain significance. This seasonal dependency of shading efficacy echoes the theoretical framework of solar trajectory–obstruction interaction proposed by Hwang et al. (2011), and offers a new operational paradigm for assessing urban microclimatic heat risks (Richards and Edwards, 2017).
Overlay analysis with spatial syntax-based accessibility measures further revealed that during July and August, high-radiation and high-accessibility street segments were concentrated in the eastern bank of the Huangpu River, central Pudong, and southern Jing’an—areas characterized by high population density, wide roads, and insufficient tree coverage. These regions face heightened health risks due to prolonged human presence and strong environmental exposure. This is consistent with previous findings indicating a significant correlation between heat-related mortality and commuter density in transport hubs (Heaviside et al., 2017). However, the inverse relationship between high shading and high accessibility is not always evident, suggesting the potential for urban design to reconcile “accessibility” with “thermal comfort.” The example in Area A of Figure 10 illustrates that even in high footfall zones, adequate mature tree canopies and rational building setbacks can significantly reduce radiation exposure, thereby achieving effective microclimate regulation.
In summary, this study underscores a solar radiation estimation logic centered on the geometric interaction between obstructions and solar angles. It reveals a novel perspective and computational logic whereby urban street thermal exposure is driven by the structural layout of obstructions and the dynamic movement of the sun. This understanding helps to break from traditional paradigms based on thermal imagery or remote sensing temperature data, offering more tangible and operational directions for urban design interventions.
Response strategies for solar radiation exposure in spatial governance
As a crucial environmental factor influencing urban thermal comfort, solar radiation exposure and its interplay with street accessibility offer new directions for urban planning. This study yields three practical policy implications for urban design and governance:
1. Urban public space planning should move beyond the traditional “accessibility-first” logic and integrate microclimate exposure into its considerations. Currently, many cities’ priorities maximizing street network connectivity and accessibility, often overlooking the resulting accumulation of environmental exposure. The results show that over 35% of the top 20% most accessible street segments also experience extremely high solar radiation exposure, demonstrating a “heat risk–accessibility coupling” effect. Urban design should thus shift from “structural optimization” to “multi-functional design,” ensuring mobility enhancement while minimizing health risks.
2. A “green–radiation co-regulation” mechanism should be promoted, positioning street greening as a core tool for modulating solar radiation exposure. The shading capacity of urban greenery varies significantly across streets with different levels of accessibility, with especially notable effects in areas like Huangpu and Jing’an. This finding supports Armson et al.’s (2013) study on street tree shading capacity in Manchester, UK, underscoring the scientific value of using quantitative canopy metrics to guide greening decisions. Interventions such as introducing “structural green patches”—including fast-growing trees and shading pergolas—can increase biological shading rates. Cities should systematically assess the overlap of canopy density and street accessibility, prioritizing tree planting and green belt optimization in high-radiation, high-accessibility areas.
3. For urban renewal strategies, this study offers a method for accurately identifying “priority intervention street segments.” By overlaying solar radiation exposure with spatial syntax-based accessibility, it is possible to detect “heat risk convergence zones” where high human activity coincides with high exposure. These areas should be prioritized for thermal environment upgrades, such as enhancing shading infrastructure, adding pavilions, or adopting reflective pavement materials. This approach provides more actionable and individualized insights than previous coarse-scale exposure assessments based on administrative boundaries.
Limitations and future directions
Despite proposing an urban solar radiation assessment framework integrating street imagery and spatial accessibility, this study has several limitations. First, the model considers only solar radiation obstruction and does not incorporate meteorological variables such as air temperature, wind speed, and humidity. While solar radiation is a dominant factor in urban microclimates, its coupled relationship with wind and temperature is also critical (Kubilay et al., 2018; Mosteiro-Romero et al., 2020). Future research could integrate street view images with urban ventilation corridor simulations to construct multi-factor thermal perception models. Second, the analysis relies on static imagery, lacking temporal tracking of street greening changes and building modifications. Variations such as tree canopy growth or pruning can significantly affect shading capacity, while the current fisheye images only reflect a snapshot from a specific summer season. Subsequent research should incorporate multi-temporal street view images to establish dynamic shading change curves (Li et al., 2018). Third, there is a lack of behavioral-level empirical validation. The accessibility metrics used here are based on spatial syntax cognitive pathways, without reference to actual human mobility or activity records. Future studies could employ thermal imaging, gait tracking data, or mobile signaling to enhance the behavioral relevance of exposure assessments. In addition, the “accessibility” represented by space syntax in this study captures potential movement opportunities embedded in the street network structure, rather than actual pedestrian flows. In practice, pedestrian flows are influenced not only by network configuration but also by land-use functions, activity intensity, and public transport connectivity. As a result, accessibility and actual pedestrian flow may not always coincide at the local scale. Despite this, given that the present study aims to identify priority street segments for intervention in solar radiation exposure at the city scale, accessibility remains a reasonable proxy for risk. Specifically, it provides a scalable and comparable structural indicator of the likelihood that a street segment will be traversed and, consequently, of potential exposure opportunities. When overlaid with solar radiation exposure, it allows for the preliminary identification and prioritization of street segments characterized by both high radiation exposure and high potential use. This issue should nevertheless be acknowledged as a limitation. Future studies are expected to further incorporate land-use intensity, bus and rail transit stations, and observed pedestrian flow or trajectory data to improve the precision of risk identification.
Despite these limitations, this study offers valuable insights into the relationship between urban planning and solar radiation exposure. Future work could address these shortcomings by incorporating more environmental parameters, employing dynamic datasets, and improving data collection and processing methods. Although this research is based in Shanghai, the proposed methods and models are applicable to other urban contexts and can provide practical support for planners and policymakers. We also encourage other researchers to adopt our methodology in different cities to deepen understanding of this important issue.
Conclusion
This study, focusing on the central urban area of Shanghai, proposes for the first time an urban street canyon solar radiation assessment framework that integrates street view images, deep learning, and spatial syntax. It aims to address critical limitations in current urban-scale solar radiation modeling, including insufficient spatial resolution, lack of detail in capturing urban morphology, and the absence of integrated accessibility analysis. The results reveal pronounced spatial disparities in summer solar radiation intensity across different districts in Shanghai. Newly developed areas such as Pudong New Area and Baoshan District exhibit the highest levels of solar radiation—reaching 2715.31 Wh/m2 and 2663.61 Wh/m2 respectively—due to wide roads and sparse greenery. In contrast, older districts like Huangpu and Hongkou demonstrate significantly lower radiation levels, where dense buildings and narrow streets provide substantial shading effects. These findings highlight the differentiated capacities for solar radiation regulation across districts at various stages of urban development. Temporally, solar radiation from May to October exhibits clear monthly fluctuations, peaking in July and August and declining through September and October. This pattern underscores the importance of adopting dynamic urban management strategies to respond to the cyclical nature of solar radiation. Furthermore, the overlay analysis of solar radiation and spatial accessibility indicates that streets with higher pedestrian frequency and accessibility—particularly in Pudong, the eastern bank of the Huangpu River, and the city core—are also those most exposed to intense solar radiation. These “high-activity + high-radiation” segments represent areas of elevated health risk and thermal discomfort, and should be prioritized in urban climate governance through optimized shading systems and enhanced greening strategies.
In summary, this study not only offers an operational and replicable methodological framework for assessing solar radiation at the street canyon scale, but also deepens empirical understanding of the spatiotemporal dynamics of solar radiation and its interaction with the urban living environment. The findings provide theoretical support and decision-making guidance for urban design, public space optimization, and thermal environment management—particularly in the context of enhancing urban thermal adaptability under climate change. Future research may extend the temporal dimension of street view images and incorporate behavioral trajectories and population distribution data to develop more dynamic, perceptive, and human-centered urban microclimate adaptation tools.
Footnotes
Author contributions
Tianlin Zhang: Conceptualization, Methodology, Writing—original draft, Writing—review and editing. Heng Xu: Methodology, Software. Jiale Guo: Data curation. Lei Wang: Writing—original draft, Writing—review and editing. Yike Hu: Funding acquisition, Writing—review and editing. The first draft of the manuscript was written by Tianlin Zhang and all authors commented on previous versions of the manuscript. All authors read and approved the final manuscript.
Funding
The authors disclosed receipt of the following financial support for the research, authorship, and/or publication of this article: This study is supported by the National Natural Science Foundation of China, Grant No. 51978448.
Declaration of conflicting interests
The authors declared no potential conflicts of interest with respect to the research, authorship, and/or publication of this article.