
Abstract
In biopharmaceutical production, ultrafiltration and diafiltration (UF/DF) becomes essential when high concentrations and tight control over the final formulation of drug substance is needed. Currently, the possibilities for direct inline monitoring of this process step are limited. This study evaluates the effectiveness of three spectroscopic techniques, i.e., mid-infrared (MIR), Raman, and variable pathlength ultraviolet (UV), or inline monitoring of protein concentration. Results demonstrate that all three techniques are suitable for monitoring this operation, with root mean squared errors of prediction (RMSEP) of 5.0, 3.2, and 3.2% for MIR, variable pathlength UV, and Raman spectroscopy, respectively. MIR and Raman spectroscopy were also tested for the quantification of excipient concentration in solution, with promising results. These findings indicate that all these advanced spectroscopic methods can enable inline monitoring capabilities, thus reducing the reliance on time-consuming offline analytics and leading to shorter development timelines. This integration of process analytical technology (PAT) tools in biopharmaceutical manufacturing can offer potential improvements in process control and variability reduction.
This is a visual representation of the abstract.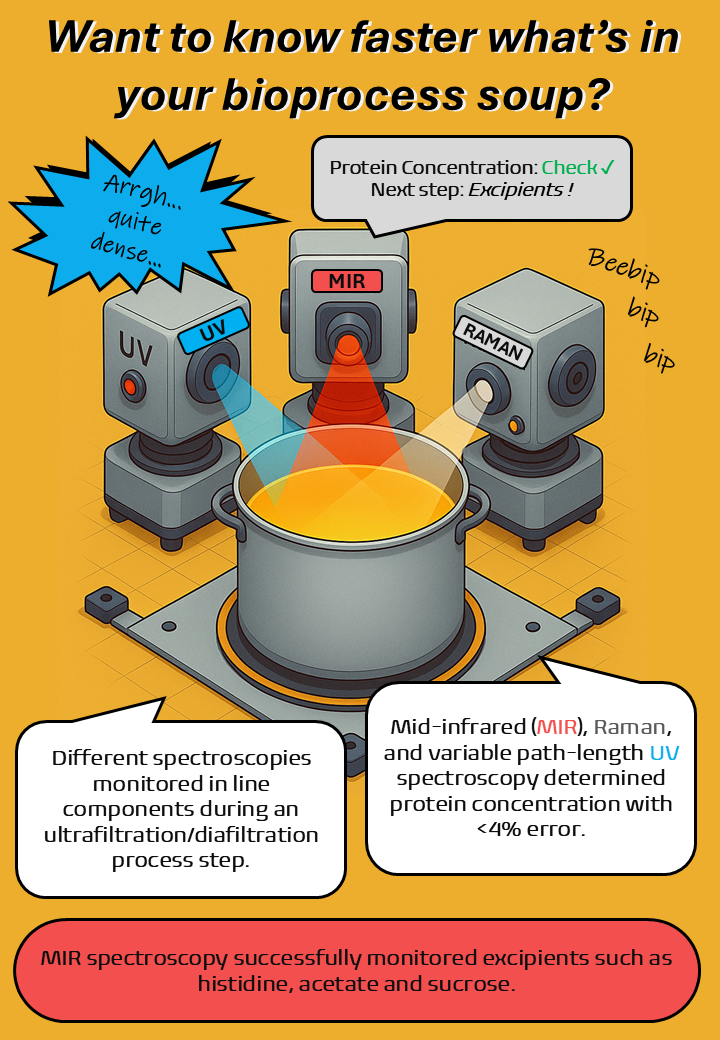
Keywords
Introduction
Process analytical technology (PAT) tools have been in use for many years in the biopharmaceutical industry, especially for upstream processes. 1 In particular, their use as a tool for assuring the quality profile of the produced drugs has been incentivized and supported by health authorities (HA) since the publication of the U.S. Food and Drug Administration (FDA) Guidance for Industry on PAT in 2004. 2 However, for downstream process (i.e., product purification) units, their application remains limited.
In biopharmaceutical processes, the final downstream steps often require a high concentration (e.g., 100–150 g/L) 3 of the molecule of interest and/or a good control over the composition of additional species (i.e., excipients) present in the so-called drug substance. Ultrafiltration and diafiltration (UF/DF) is a membrane-based technology addressing this need by using tangential-flow separation to concentrate biomolecules based on their size and molecular weight while exchanging buffers at the same time, making it a widely used technique in the field.3–5 When processing biological products into high-concentration formulations, large molecules not passing through the membrane pores create an imbalance in ion distribution across the membrane. The resulting Donnan effect6,7 leads to the redistribution of small ions to restore the electrochemical potential. The composition of the desired final formulation cannot be used as such as a diafiltration buffer during the UF/DF step and a diafiltration buffer needs to be developed to account for the Donnan effect. For some excipients such as histidine or sucrose, mechanistic models can be used to accurately define the diafiltration buffer composition to be used. These models can prove to be less reliable for some other excipients such as acetate. Even for the accurately modelled excipients, additional ways to control the final formulation would still be beneficial. 8 A fast readout of the actual product and excipient concentrations would enable technical operations to proceed faster with the next process steps compared to when offline analytics are required. The second category of excipients, for which robust mechanistic models still need to be established, would benefit from an alternative to the time-consuming offline analytics to determine the actual drug substance composition. For such excipients, relying on offline readouts during diafiltration buffer development can result in several trial-and-error attempts, sometimes at the cost of extended development timelines. The requirements of these inline techniques would be an easy deployment into existing production or lab scale systems, such as the availability of flow cells that can be integrated into existing flow paths. In terms of accuracy requirements, although the best-case scenario is an accuracy comparable to the reference offline analytics, in practice a small decrease in accuracy can be accepted due to the advantages posed of an immediate readout of the process, enabling online monitoring.
Despite some already existing efforts, the use of PAT tools to monitor and/or control UF/DF processes is somewhat limited. Specifically, only a handful of spectroscopic techniques have earned a place in the spotlight, namely mid-infrared (MIR), ultraviolet (UV), and Raman spectroscopy. Besides spectroscopic techniques, refractive index has also been investigated as a possible tool. 9
Regarding UV spectroscopy, the extinction of protein at 280 nm can be utilized for quantification purposes.10,11 However, measuring with a single pathlength, common for many UV spectrometers, is problematic for monitoring tangential flow filtration (TFF). The main limitation of this approach is a loss of linearity for the higher concentration range achieved at the end of the filtration process. 12 With the advent of more advanced instruments based on the variable pathlength slope (VPE) technology, this drawback was circumvented. 13 To achieve this, dedicated algorithms search for the optimal pathlength. At this pathlength, protein concentration and absorbance correlate linearly according to the Bouguer–Beer–Lambert Law. When combining this technology with a flow cell, it can be easily implemented in inline downstream processing, more specifically in TFF processes.14,15 The application of these recent developments was well illustrated in the study by Ólafsdóttir and colleagues, 16 where they measured inline a broad range of protein concentrations, 10–250 g/L, in a TFF process.
Raman spectroscopy also has come as a strong player in PAT. Raman spectroscopy is a type of vibrational spectroscopy based on inelastic scattering of light. Correlating the observed vibrations in different frequencies with distinct molecular vibrations enables both qualitative and quantitative analysis. The acquired spectra can be analyzed by applying multivariate analysis techniques, such as partial least squares regression (PLSR). Raman spectroscopy for inline monitoring rapidly expanded in upstream processes, such as for fed-batch mammalian cell cultures as it proved efficient for the inline monitoring of typical parameters of interest for such processes. 17 Various applications for this technology were also identified for downstream processes.18–21 In contrast to UV spectroscopy, Raman spectroscopy offers the advantage of monitoring multiple components simultaneously and does not suffer from water interference which affects other kinds of spectroscopies. 22 On the other hand, there is the disadvantage of the need for building process- and component-specific multivariate models, a complex and time-consuming task. Both UV and Raman spectroscopy were previously tested in a TFF process to inline monitor protein concentration in the range of 2–100 g/L. Being sensitive to not only proteins but also excipients, Raman spectroscopy was furthermore applied to track buffer exchange. 19
Mid-infrared spectroscopy has also been explored for PAT in TFF. Excitation of molecular vibrations causes the absorption of infrared light (IR). Similarly to Raman spectroscopy, different bond vibrations correspond to a specific wavenumber region. The linear relationship between the absorbance of a molecule and its concentration allows for quantitative analysis. Carbohydrates, fats, proteins, and nucleotides show their most relevant absorption in the fingerprint region, located at 900–1800 cm–1. Prominent peaks in this region include the amide I (1600–1700 cm–1) and amide II (around 1550 cm–1) peaks of proteins, the ester carbonyl band of lipids (1725–1745 cm–1), the vibrational bands of C–O stretching and bending from carbohydrates (1000–1200 cm–1), peaks of PO2 stretches found in DNA and RNA (around 1235 cm–1). 23 However, this region is also heavily influenced by the presence of water bands, especially at 1400–1700 cm–1. As the main component of aqueous biological samples, water tends to dominate the acquired absorbance spectra, thereby hampering a measurement without sample preparation. Subsequently, this effect has slowed down the use of MIR spectroscopy for PAT purposes. It is possible to subtract the solvent spectrum to resolve the spectra of solutes, 24 but the spectral correction for absorbing solvents like water still poses challenges. Recently, Lee, et al. 25 presented a simple correction method based on the assumption of negligible interactions between solvent and solutes. While this simplification was verified to be applicable to sufficiently large solutes, such as globular proteins, it was found inadequate for small solutes such as monosaccharides that exhibit non-negligible interaction with water molecules. Due to the formation of solvation shells around the solutes, spectral changes are induced not only by the additional absorption of the solute but also changes in the spectrum of the solvent itself. The spectral contribution of these solvation shells cannot be ignored for small molecules and further studies on correction methods are required. 25 Similarly to Raman spectroscopy, also MIR spectroscopy can be used as a multiple-attribute method, to monitor protein and excipient concentrations.14,26 The use of attenuated total reflection (ATR) allows for the reduction of water interference in MIR spectroscopy. An ATR element, i.e., a crystal with a high refractive index, is in contact with the sample. When light passes through this crystal at the right angle, total reflection occurs as it hits the crystal–sample interface. Still, a fraction of the light, the evanescent wave, extends into the sample for up to a few micrometers. Within the sample, IR light is absorbed, and the decrease in reflected intensity (the attenuation) can be quantified. The low penetration depth achieved by this setup greatly diminishes the influence of water and the interferences caused by bigger particles.27,28
Considering these advantages, MIR spectroscopy integrates synergistically into TFF processes to monitor proteins and excipients inline. Wasalathanthri and colleagues 29 monitored a process where they predicted the protein concentration alongside two excipients. The protein concentration varied between 10–160 g/L and the MIR predictions correlated well with the ones of offline variable pathlength UV spectroscopy. The excipient predictions went up to approximately 340 and 100 mM for excipients I and II, respectively. Another study 30 showed the use of MIR spectroscopy to monitor protein concentration in the range of 17–200 g/L, whereas excipients were identified but not tracked. Both studies demonstrate the potential to use MIR spectroscopy to monitor high protein concentrations, an important parameter to consider in protein formulations. The variable pathlength technology was already used to monitor the concentration of a monoclonal antibody (mAb) in a UF/DF process concentrating the protein material up to 120 g/L by Rolinger et al. 15 and up to 200 g/L by Wasalathanthri et al. 14 In another study, Rolinger et al. also investigated the capabilities of Raman spectroscopy, for both monitoring the concentration of a mAb up to about 100 g/L, and the composition of excipients during the diafiltration step. 19 In this latter reference, the aim was not to quantify online the excipients but rather to identify the stage upon which buffer exchange was complete. An application note from the Thermo Fisher Scientific company demonstrates that the quantification of arginine, sucrose and histidine can be achieved, up to 50, 200, and 15 mM, respectively. 31 An automated system equipped with an instrument that can be operated continuously to monitor a process will rapidly compensate for changes in the solution properties that are characteristic of high protein concentration formulations. 16
In the present paper, variable pathlength UV, Raman, and MIR spectroscopy were evaluated and compared for the inline monitoring of protein concentration at lab-scale and at manufacturing scale UF/DF processes. The targeted expected accuracy when developing an analytical method depends on the need. When it comes to online process monitoring, a trade-off between method accuracy and real-time data availability could justify higher errors on the predictions. The cursor can also be set differently whether we aim for a method involved in process control or to only monitor process performance. Current internal practice was referred to when setting the accuracy requirement for protein concentrations up to 200 g/L. The bias of the HPLC reference method used to quantify protein concentration is considered fit for purpose and valid if not higher than 7%. Additionally, the potential to monitor excipient concentrations with MIR and Raman spectroscopy were also evaluated. Based on internal practice for standard monoclonal antibody formulations, where ranges are 10% around the targeted content for excipients, a quantification bias around 7% would already make these inline methods efficient support tools to development activities. Still guided by current internal practice, the accuracy of excipient quantification was assessed from 0 mM to at least 35 mM (for histidine and acetate), and up to a maximum of 300 mM for sucrose. The results showcase the potential for future implementation of inline monitoring instruments in downstream processes, leading to their optimization and automation, creating more process knowledge, and accelerating bioprocess development.
Experimental
Materials and Methods
The protein used consists of an immunoglobin G1 (IgG1) monoclonal antibody. Stock solutions of 300 mM histidine, 300 mM acetate, and 400 mM sucrose were prepared in water. For histidine and acetate, the respective stock solutions served to prepare a 40 mM solution from which dilutions to 5, 10, 17.5, 20, 22.5, and 25 mM were created. The sucrose stock solution was further diluted to daughter solutions of 50, 100, 200, 220, 250 and 300 mM. Slight variations to these targeted concentrations were obtained when dilutions were obtained from the ÄKTA Avant 25 system (variations not detailed) described in the Lab Scale Offline Experimental Set-Up for Linearity Assessment of Excipients section below.
Equipment
All measurements with MIR spectroscopy were performed using a Monipa 1 MIR spectrometer (IRUBIS GmbH, Germany). MIR spectra were acquired every 30 s with a resolution of 4 cm–1 in the wavelength range of 3000−800 cm−1. A three-dimensional (3D) printed flow cell containing a silicon ATR crystal (IRUBIS GmbH, Munich, Germany) was mounted in the single channel of the spectrometer.
Raman spectra were acquired using a Kaiser Raman Rxn2 spectrometer (Kaiser Optical Systems Inc, USA), including a 785 nm laser with a power of 400 mW. The analyzer was connected to a Raman flow bench, integrating a micro-flow-cell (Endress + Hauser, Switzerland), which the liquid samples flowed through. This Raman flow assembly uses an internal amplifier optic which collects both forward and backward propagating scatter.
Protein concentrations were also measured using a CTech FlowVPX System (Repligen, USA) with an Agilent Cary 60 spectrophotometer as UV radiation source (Agilent Technologies, USA) and a 3 mm flow-cell. All protein determinations were done at 280 nm, applying a 1.54 L⋅g−1⋅cm−1 mass extinction coefficient calculated based on the amino acid sequence, through continuous measurements with an averaging time of 0.25 s and in quick slope mode with seven data points.
Lab Scale Offline Experimental Set-Up for Linearity Assessment of Excipients
MIR Measurements
For each excipient type, the seven stock and daughter solutions with ascending concentrations were injected into the flow cell successively with a syringe, followed by a cleaning step, according to manufacturer instructions, by sequentially injecting water, followed by an incubation in 1% sodium dodecyl sulfate (SDS) for 2 min, and then rinsing with water. For each sample, a spectrum was acquired on average 10 min in 15 s intervals. In these 15 s, the used MIR spectrometer acquires 70 single beam scans. An averaged spectrum of pure water was acquired for 5 min and subtracted as a background.
Raman Measurements
Dilutions to achieve the different excipient concentrations were performed independently. Dilutions were realized either manually (and injected in the flow-cell via a syringe) or with the help of an ÄKTA Avant 25 chromatography system (Cytiva Life Sciences, USA). For this second approach, the desired excipient concentrations were obtained by applying defined mixing ratios between stock solutions and water. The Raman micro-flow-cell was integrated in the outlet line of the Avant 25. Spectra were acquired while the solution exiting the AKTA mixing chamber passed through the flow cell. For both the manual and the automated approaches, dilutions were measured only once without repetition. Between the measurements of each excipient, the flow-cell was cleaned with a 70% isopropyl alcohol (IPA) solution, followed by a flush with water. No backgrounds or blank samples were taken, since the multivariate model should be able and have the requirement of interpreting and accounting for possible matrix differences. However, the instrument automatically takes a dark measurement, to account for possible shifts or interferences in the light path.
Lab Scale UF/DF Experimental Set-Up
An IgG1 solution originally formulated at 167 g/L in histidine and sucrose was diluted 18-fold in 20 mM sodium phosphate pH 7. The concentration of the starting material was determined using a Nanodrop OneC (Thermo Scientific, USA) at 10 g/L. The UF/DF was performed using a Sartorius SartoFlow Smart system and installed with a 30 kDa membrane (Millipore Pellicon 3). The membrane was loaded with 500 g IgG1/m2. A transmembrane pressure of 1.0 to 1.2 bar was targeted. First, the IgG1 was concentrated to 70 g/L (target). In a second step, the product was diafiltered against four DF volumes of a histidine and sucrose buffer. Finally, it was concentrated to reach at least 200 g/L. The UF/DF was performed with a constant agitation of 150 rpm in the retentate vessel except prior to sampling, when stirring was increased to 190 rpm. Due to the impossibility to have the MIR and the Raman spectrometer concomitantly in our facilities, both were tested separately alongside with the variable UV pathlength instrument.
Inline Measurements Using Variable Pathlength UV and MIR
Both measurement devices were set up in series between the retentate vessel and the feed pump of the UF/DF system (refer to Figure S1, Supplemental Material, for more details). Exposure lengths of 0.25 and 15 s (70 single beam scans) were selected for the Flow-VPX and the MIR spectrometer, respectively. The initial feed solution was used as a background spectrum for the MIR measurements. Samples for offline measurements were taken with a pipette close to the outlet port of the retentate vessel. Prior to the start of the experiment, the MIR spectrometer was blanked against the buffer used to dilute the starting material (20 mM sodium phosphate pH 7).
Inline Measurements with Raman
The Raman probe combined with the micro flow-cell were set up between the retentate vessel and the feed pump of the UF/DF system. Spectra were acquired through three scans of 10 s each. The Flow-VPX flow-cell was additionally installed upstream of the UF/DF feed pump, next to the Raman micro flow-cell. Samples for offline analytics were withdrawn via a sample port installed close to the Raman micro flow-cell. Prior to sampling, 5 ml retentate were withdrawn from the sampling port and fed back into the retentate vessel (refer to Figure S1 for more details).
Manufacturing Scale Experimental Setup
Raman and MIR spectra as well as variable pathlength UV concentration measurements were acquired during a manufacturing scale UF/DF run. Specifically, a sample loop was installed from the bottom of the retentate tank, leading to the flow-cells of the variable pathlength UV and Raman analyzers, returning to the retentate tank, in order to have a non-destructive analysis. Samples for offline analysis using the reference analytical method were taken from a sampling port at the bottom of the tank.
Data Analytics
MIR Spectroscopy
For the linearity study of the MIR spectra of the aqueous individual excipient solutions, a linear least squares regression was applied. All of the 15-s intervals acquired during the approximately 10 min of spectra recording (∼40 intervals) for the samples of each individual excipient were screened for outliers using the fast massive unsupervised outlier detection (Fast-MUOD) framework 32 and the clean subset of spectra was averaged. From these averages, the first-order derivatives of the spectra were computed with a 51-point modified-sinc-smoother 33 of polynomial degree 6 and the derivative spectrum of the solution with the highest concentration was extracted. This spectrum shows the highest absorbance and thus signal-to-noise ratio. Subsequently, this derivative spectrum was fitted to the derivative spectra of all other solutions (with lower concentrations), and the predicted concentrations were calculated from the regression coefficients of the regressions. Finally, a comparison between these predictions and the actual concentrations known from the dilution factors was carried out in terms of the root mean square error (RMSE) and coefficient of determination (R2). Figure S2 and Figure S3 (Supplemental Material) show the MIR spectra of protein and excipients and an overview of the data processing workflow, respectively.
In contrast, the antibody–excipient mixtures from the UF/DF runs consisted of multiple components with partially overlapping spectra, and required a customized linear least squares regression, which was implemented in Python. Each 15-s interval was processed to obtain a single prediction. Following the work of Baldassare, et al., 34 the acquired spectra and their scaled first-order derivatives were simultaneously fitted with a linear combination of the individual component spectra and their corresponding derivatives (“reference spectra”). The concentrations of the components serve as the combination weights. Owing to the different magnitudes of spectra and their derivatives, the derivatives were multiplied by a factor of 30 to balance the combined least squares regression. This factor was found empirically by matching the Euclidean norms of the spectra and their first derivatives. It aligns with the findings in Baldassare, et al. 34 where the authors evaluated the performance of the factors 30 and 3000 for the second derivative and found 30 to give superior fit results. Again, a 51-point modified-sinc-smoother 33 of polynomial degree 6 was applied to reduce the noise in the spectra and especially their first derivatives. To ensure physically meaningful fits, the concentrations were constrained to be non-negative by employing the fast non-negative least squares (FNNLS) algorithm. 35 While the pure reference spectra of the excipients were acquired from measurements of aqueous excipient solutions against a water blank, the pure antibody reference spectra had to be extracted from the spectra of samples that contained both the antibody and excipients. Using the automatic spectral subtraction proposed by Banerjee and Friese, 24 the presence of the excipients could be corrected, and the pure antibody reference spectra were obtained. An example of the spectral decomposition by means of the described algorithm can be found in the Figure S4 (Supplemental Material).
Lastly, an experimental regression was used for the offline measurements of the antibody–excipient mixtures. The first-order derivatives of the sample mixture spectra were regressed on the derivative spectra of the individual components. Then, a backward elimination was applied. Each wavenumber was individually left out of the regression model. A subset of wavenumbers whose deletion resulted in the greatest improvement of fit quality (RMSE) was ultimately removed from the fit. This procedure was repeated iteratively until the changes in the R2-value became negligible. Aiming for the highest R2-value, different subset sizes were tested for each mixture. After this, protein and excipient concentrations were calculated based on the wavenumbers that were not removed from the regression.
Raman Spectroscopy
Data were analyzed with the SIMCA 18 software (Sartorius, Germany). A scale specific model approach was taken due to different Raman acquisition setup for the large and lab scale runs. Raman spectra were preprocessed by first derivative and then by standard normal variate, for Raman shifts between 400 and 1800 cm–1. Preprocessed spectra acquired for various concentrations of histidine, acetate, sucrose as well as during and UF/DF containing an IgG1, histidine and sucrose are overlaid in Figures S5, S6, S7, and S8 (Supplemental Material), respectively. The model aiming at monitoring large-scale operations was trained on 18 spectra acquired over four independent UF/DF runs. The resulting PLS model was then used to predict product content from 247 spectra acquired over the course of a fifth independent run. At small scale, the model was trained with 45 spectra acquired over three independent UF/DF runs. Product concentrations were predicted throughout a fourth UF/DF by applying the obtained PLS model to 35 spectra. At manufacturing scale, offline analytics used for model training covered a range from 19.3 to 204.2 g/L with an average spacing of 10.9 g/L. The small scale model was trained with offline analytics ranging from 11.6 to 250.4 g/L with an average interval of 5.4 g/L. For both scales, the provided average spacings do not consider the concentration redundancies from the diafiltration phases. The number of principal components was limited to the minimum required to explain at least 90% of the variance (i.e., R2Y (cumulative) ≥ 0.9).
Variable Pathlength UV Spectroscopy
Measurements with variable pathlength UV were processed and controlled using ViPER ANLYTX 1.1. Acquired data were used as such, i.e., with no further transformation.
Reference Analytics
Liquid chromatography (LC) analytics were performed on an Agilent LC 1200 quaternary system. IgG1 concentrations were determined through affinity LC, using a Poros PA ImmunoDetection Sensor Cartridge from Applied Biosystems (Catalog no. 2-1001-00). The cartridge was equilibrated at pH 7.5, whereas a pH 2 solution was used for the elution of analytes. Sucrose concentrations were determined by ion-suppression reverse phase LC, using a Zorbax SB-Aq column (Agilent, no. 883975-914), where elution is obtained isocratically with a sulfuric acid mobile phase. Acetate quantification was achieved through ion exclusion LC, using an ORH-081 Column (Concise Separations, no. CE-99-9754) and a sulfuric acid mobile phase. Histidine was quantified by capillary zone electrophoresis (CZE) with a neutrally coated capillary (Beckman Instruments, no. 477601) run on a Beckman PA800 Plus capillary electrophoresis system. Samples were diluted in a mixture of 6-aminocaproic acid, acetic acid, and tween 20 to a theoretical 1.5 mM concentration prior to injection into the capillary.
Results and Discussion
Protein Concentration Monitoring at Lab Scale
Initially, a lab-scale UF/DF experiment was monitored using MIR spectroscopy and variable pathlength UV spectroscopy to investigate the performance of these techniques in inline measurements in comparison to offline analytics. This UF/DF experiment consisted of a first protein concentration step until reaching circa 70 g/L, followed by the diafiltration step, which occurred from 70 to 155 min. Lastly, a second concentration step was carried out until reaching more than 200 g/L. In Figure 1, predictions from the MIR spectrometer and variable pathlength UV spectrophotometer are compared to the concentrations obtained by offline reference analytics. Both instruments were in accordance with the reference measurements and could thus monitor the whole UF/DF experiment in real time. The recurrent spikes on the variable pathlength UV trace were identified to be caused by suboptimal mixing. Regardless of the resulting noise, the root mean square error of prediction (RMSEP) used as comparison metrics amounted to 8.7 g/L (3.9%) for the MIR spectroscopy and 7.0 g/L (3.1%) for the variable pathlength UV spectroscopy. The values in brackets give the RMSEP after dividing it by the range of tested concentrations (difference between lowest and highest concentration). Based on these findings, variable pathlength UV spectroscopy can be considered suitable for process analytics, particularly regarding the requirement for validation of reference analytics of ≤7%.
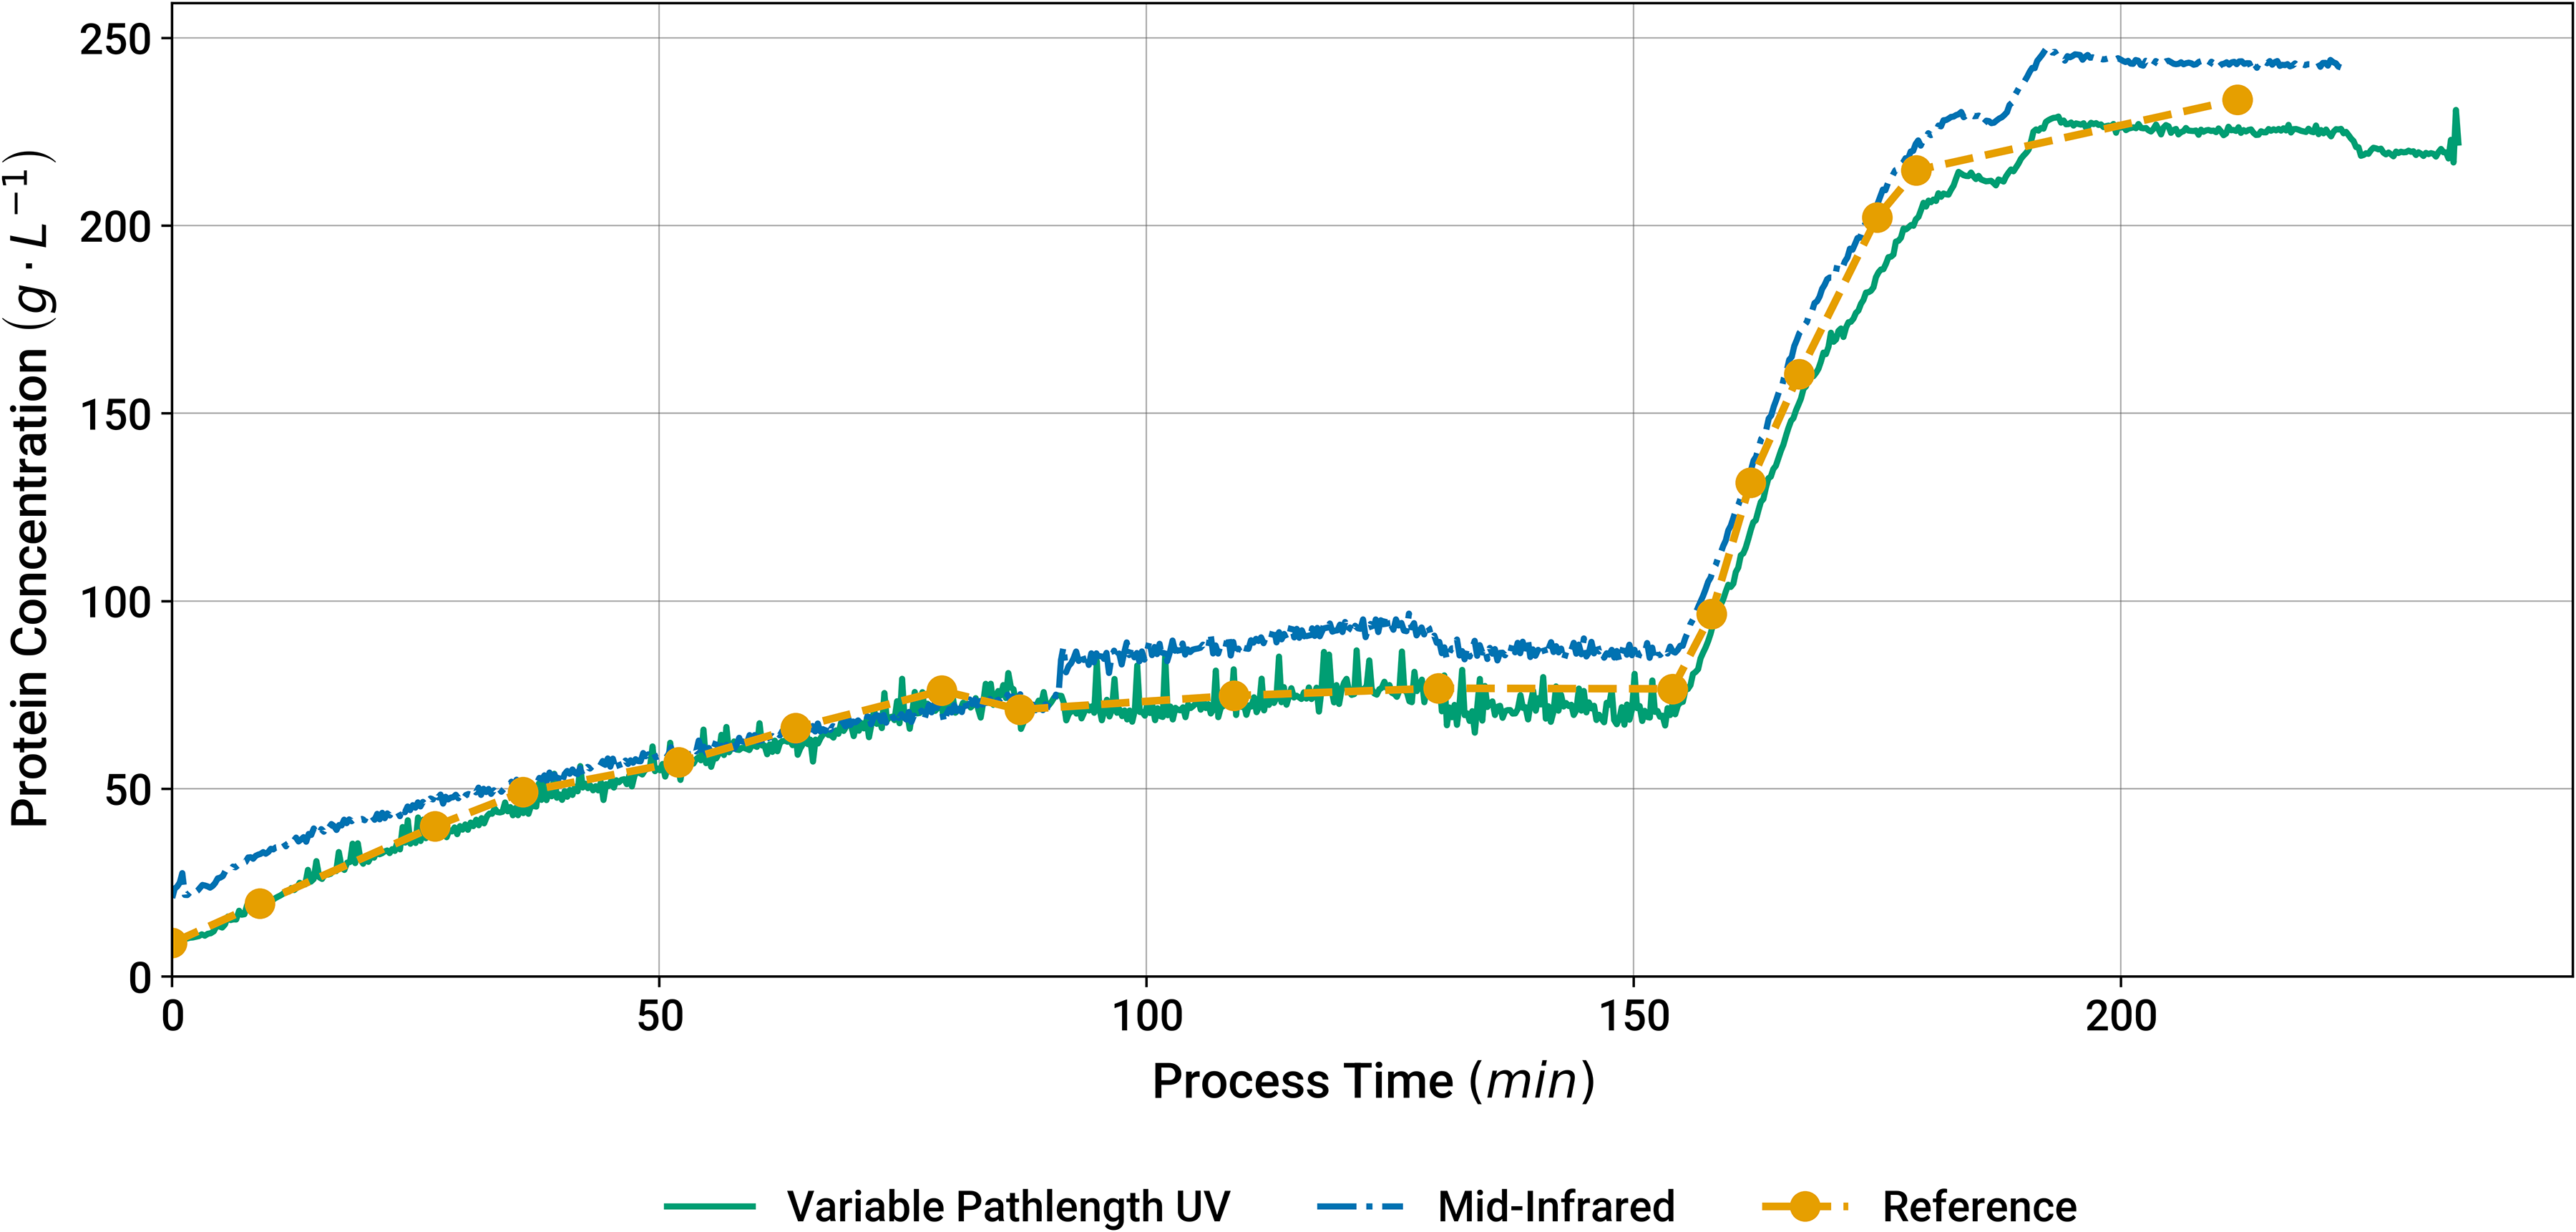
Protein concentration predictions by MIR spectroscopy, variable pathlength UV, and reference analytics during an UFDF experimental run at lab scale.
The higher RMSEP of the MIR-based analytics invites further discussion. During the first 90 min, the overall trend of the MIR predictions does not align with the trend of the reference values. After this, there is a rapid transition followed by a plateau during diafiltration. The difference spectrum between one data point before and one data point after this transition is displayed in Figure S9 (Supplemental Material). This spectrum covers a time difference of approximately 2 min, and it exhibits a strong peak at 1630 cm–1. A scaled spectrum of pure water acquired on the MIR spectrometer is displayed as well to show that this peak position coincides with a characteristic peak of water. Besides, the baseline of the spectrum seems to be overall elevated in this spectral region, which also applies to the water spectrum. The strong peak is accompanied by a shoulder peak at 1550 cm–1 and a group of peaks between 1000 and 1200 cm–1 whose shape matches the spectrum of sucrose which is also shown. An increase in sucrose within 2 min can be explained by the diafiltration process, which introduces sucrose via the DF buffer. However, a sudden increase in water cannot be explained and was not observed in any other of the performed experiments. These findings suggest that the sample did not have full contact with the ATR element prior to the observed transition in the MIR predictions. An air bubble covering parts of the ATR element could potentially explain this behavior as follows. During the first 90 min, the surface of the ATR element was not fully covered by the stream of process sample passing by. As the process parameters changed during diafiltration, the air bubble was removed. Consequently, more of the process sample was probed, and the difference spectra between data points before and after the removal would show an increased absorption by all absorbing species, i.e., water, protein, and excipients. This aligns with the observed shape of the experimental difference spectrum, especially when the shoulder peak at 1550 cm–1 is attributed to the amide II peak of protein. Given that the ATR element is not uniformly illuminated by a collimated infrared light beam but a focused beam whose light intensity varies along the surface of the ATR element, it is hard to predict the exact shape of the resulting difference spectrum and its potential distortions depending on the size and position of the air bubble. This hypothesis also implies that the air bubble was present during the acquisition of the background spectrum that was acquired when the process was started. Therefore, all MIR process spectra for this experiment were compromised. On the one hand, spectra obtained without full sample contact provide only incomplete sample information with potential distortions. On the other hand, also the spectra recorded with full sample contact are corrupted when a background spectrum without full sample contact is subtracted from them. Despite the distortion of the spectra, the MIR predictions still follow the trend of the offline data and for the data points of the second diafiltration (after 150 min) the RMSEP is 9.0 g/L (5.8%). This relative error is still within the acceptance criterion of ≤7%, thus qualifying MIR spectroscopy as a promising process analytics technology, even in the presence of disturbances. Therefore, this technique was also evaluated in the manufacturing scale experiments described in the next sections.
In Figure 2, predictions from the Raman spectrometer are shown and compared to the reference analytics from a separate UF/DF run with regards to Figure 1. In this run, the IgG1 was first concentrated to 67 g/L, diafiltered and concentrated up to 220 g/L. Although the trends generally track each other, the two quantification approaches do not overlap completely at the early and late stages of the UF/DF. The divergence at the early stages was caused by insufficient material recirculation time in the UF/DF system leading to inhomogeneity at the sampling point and spectrum acquisition time. For higher mAb concentrations, a gravimetric dilution is required prior to the injection onto the LC system, which can introduce more inaccuracy for the reference analytics. At last, there is also some error inherent to multivariate models, in the sense that the error is expected to be larger at the edge of the range of the training dataset. For this run, the RMSEP was 6.7 g/L (3.5%) for concentrations determined by Raman spectroscopy. The model was built according to the procedure described in the Manufacturing scale experimental setup section, which resulted in a model using 2 latent variables, a root mean square error on the calibration (RMSEC) of 8.8 g/L (3.7%-) and a root mean square error on the crossvalidation (RMSECV) of 9.11 g/L (3.8%).

Protein concentration predictions by Raman spectroscopy and reference analytics during an UFDF experimental run at lab scale.
Protein Concentration Monitoring at Manufacturing Scale
In the next step, the experiment was repeated at manufacturing scale: a first concentration step until reaching 65 g/L, followed by diafiltration and a second concentration step to ∼200 g/L. In Figure 3, the antibody concentration predictions by MIR, variable pathlength UV and Raman spectroscopy are shown together with the measurements per reference offline analytics. Manufacturing operations came with some limitations in offline sampling opportunities, resulting in five offline measurements per run only. As for the lab-scale experiment, all technologies achieved an accurate concentration monitoring. For this experimental run, also the RMSEP was calculated: 8.8 g/L (5.0%) for MIR, 8.3 g/L (4.7%) for variable pathlength UV, and 4.0 g/L (2.3%) for Raman spectroscopy. Specifically, for Raman spectroscopy, the generated model consisted of two latent variables, a RMSEC of 17.3 g/L (9.4%) and a RMSECV of 17.1 g/L (9.3%). All techniques show results comparable to the reference analytical method. In manufacturing, a need exists for a reliable quantification technique for protein concentration, which could be used for direct process control, decreasing cycle times. The accuracies shown prove that MIR and variable pathlength UV spectroscopy could be used for this purpose. For Raman spectroscopy, the higher error values obtained in regard to calibration and cross-validation when compared to the model built on small-scale data suggest that a larger dataset would be required to improve the robustness of the large scale model.

Protein concentration predictions by MIR spectroscopy, variable pathlength UV, Raman spectroscopy, and reference analytics during a UFDF experimental run at manufacturing scale.
Comparison of MIR with Variable Pathlength UV and Raman Spectroscopy
In Figure 4, the observed versus predicted (parity) plots are shown for the three analyzed technologies, using all the predictions made across all experimental runs (both lab and manufacturing scale), without the data used for model calibration and training. As can be concluded, all techniques show similar performance. This is also supported by the RMSEP, calculated as 8.8 (5.0%), 7.3 (3.2%), and 6.4 (3.2%) g/L for MIR, variable pathlength UV, and Raman spectroscopy, respectively. With the ≤7% bias considered as a limit for the offline analytics, all techniques are suitable candidates for use in inline monitoring of protein concentration. For MIR spectroscopy, the lab scale experiment was not considered in this evaluation due to the observed artifacts in the spectra.
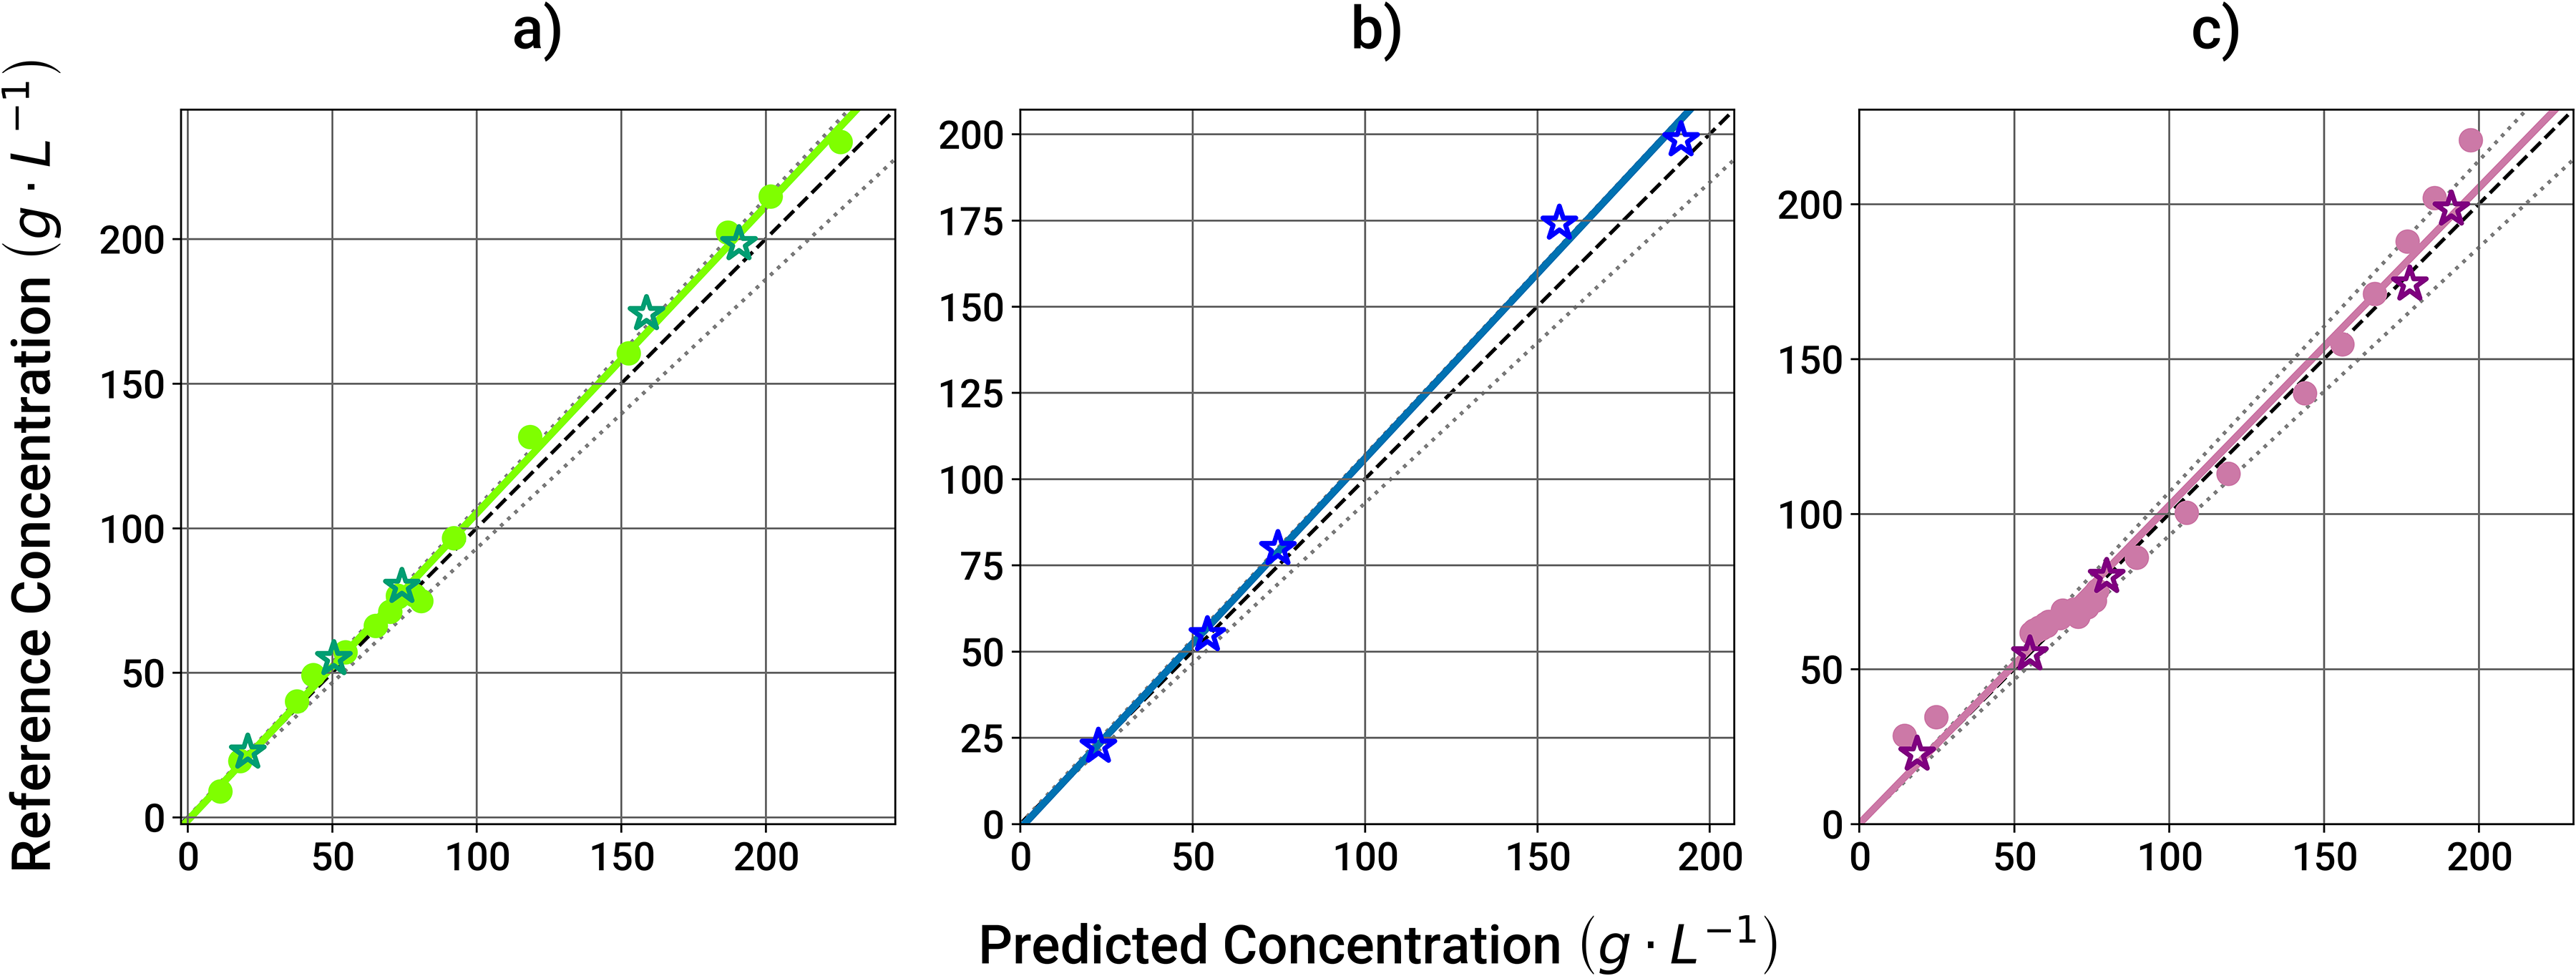
Observed versus predicted plots for protein concentration for the three PAT tools investigated: (a) variable pathlength UV spectroscopy, (b) MIR spectroscopy, and (c) Raman spectroscopy. Lab and manufacturing scales are represented with circles and stars, respectively. The solid lines correspond to the calculated regressions, the dark dashed lines to the 1:1 regressions and the light dotted lines to the ±7% deviation from the respective 1:1 regressions.
However, all three techniques have their advantages and disadvantages. Variable pathlength UV offers a user-friendly technique, requiring very limited knowledge of the molecule of interest, since only the extinction coefficient needs to be known a priori.36,37 Furthermore, it relies on a tried and tested measuring principle, which is also at the basis of typical UV monitoring.
On the other hand, MIR and Raman spectroscopy for quantification purposes rely on the combination of information from several spectral regions, generating a more complex signal. This signal, in the form of a spectrum, needs to be processed via advanced data analytics techniques, such as multivariate data analysis (MVDA), requiring thus more development and data processing steps compared to variable pathlength UV. These models can come either built in the device software analytics or offer the user the possibility of creating and implementing their own models, which can be time consuming and require expert knowledge. In this case, a linear least squares regression model was used for MIR spectroscopy, while Raman spectroscopy used a partial least squares regression model. Both models showed comparable results, despite relying on different data analytics techniques and spectroscopy types.
Product concentration determination could take place immediately with variable pathlength UV and within 15 and 30 s when using MIR and Raman spectroscopies, respectively. Considering only the time for sample and sequence preparation, for the sample analysis and for the data integration, offline product quantification with HPLC takes an average of 15 min for one sample. Another 5 min would be needed in case a gravimetric dilution is required (i.e., when concentration is expected to be higher than 70 g/L). In contrast with variable pathlength UV, MIR and Raman spectroscopy offer the possibility to monitor further targets contemporarily to protein concentration, such as excipients.
Excipient Determination Using MIR and Raman Spectroscopy
MIR spectroscopy was investigated as a tool to predict protein and excipient concentrations in solution during UF/DF processes. First, the linearity response from the MIR spectroscopy measurements was tested for three common excipients used in formulation from different biological categories (amino acids, pH buffer species, and sugars). The concentrations of histidine and acetate ranged from 5 to 40 mM and sucrose from 50 to 400 mM. Typical formulations for biomolecules fall within the selected ranges. 38 Figure 5 depicts the linear relationship between the concentrations quantified by MIR spectroscopy and the theoretical value of the solution concentrations. All three excipients show an R2 in the range of 0.99, demonstrating the linear behavior of the MIR spectrometer measurements for the investigated concentration ranges.
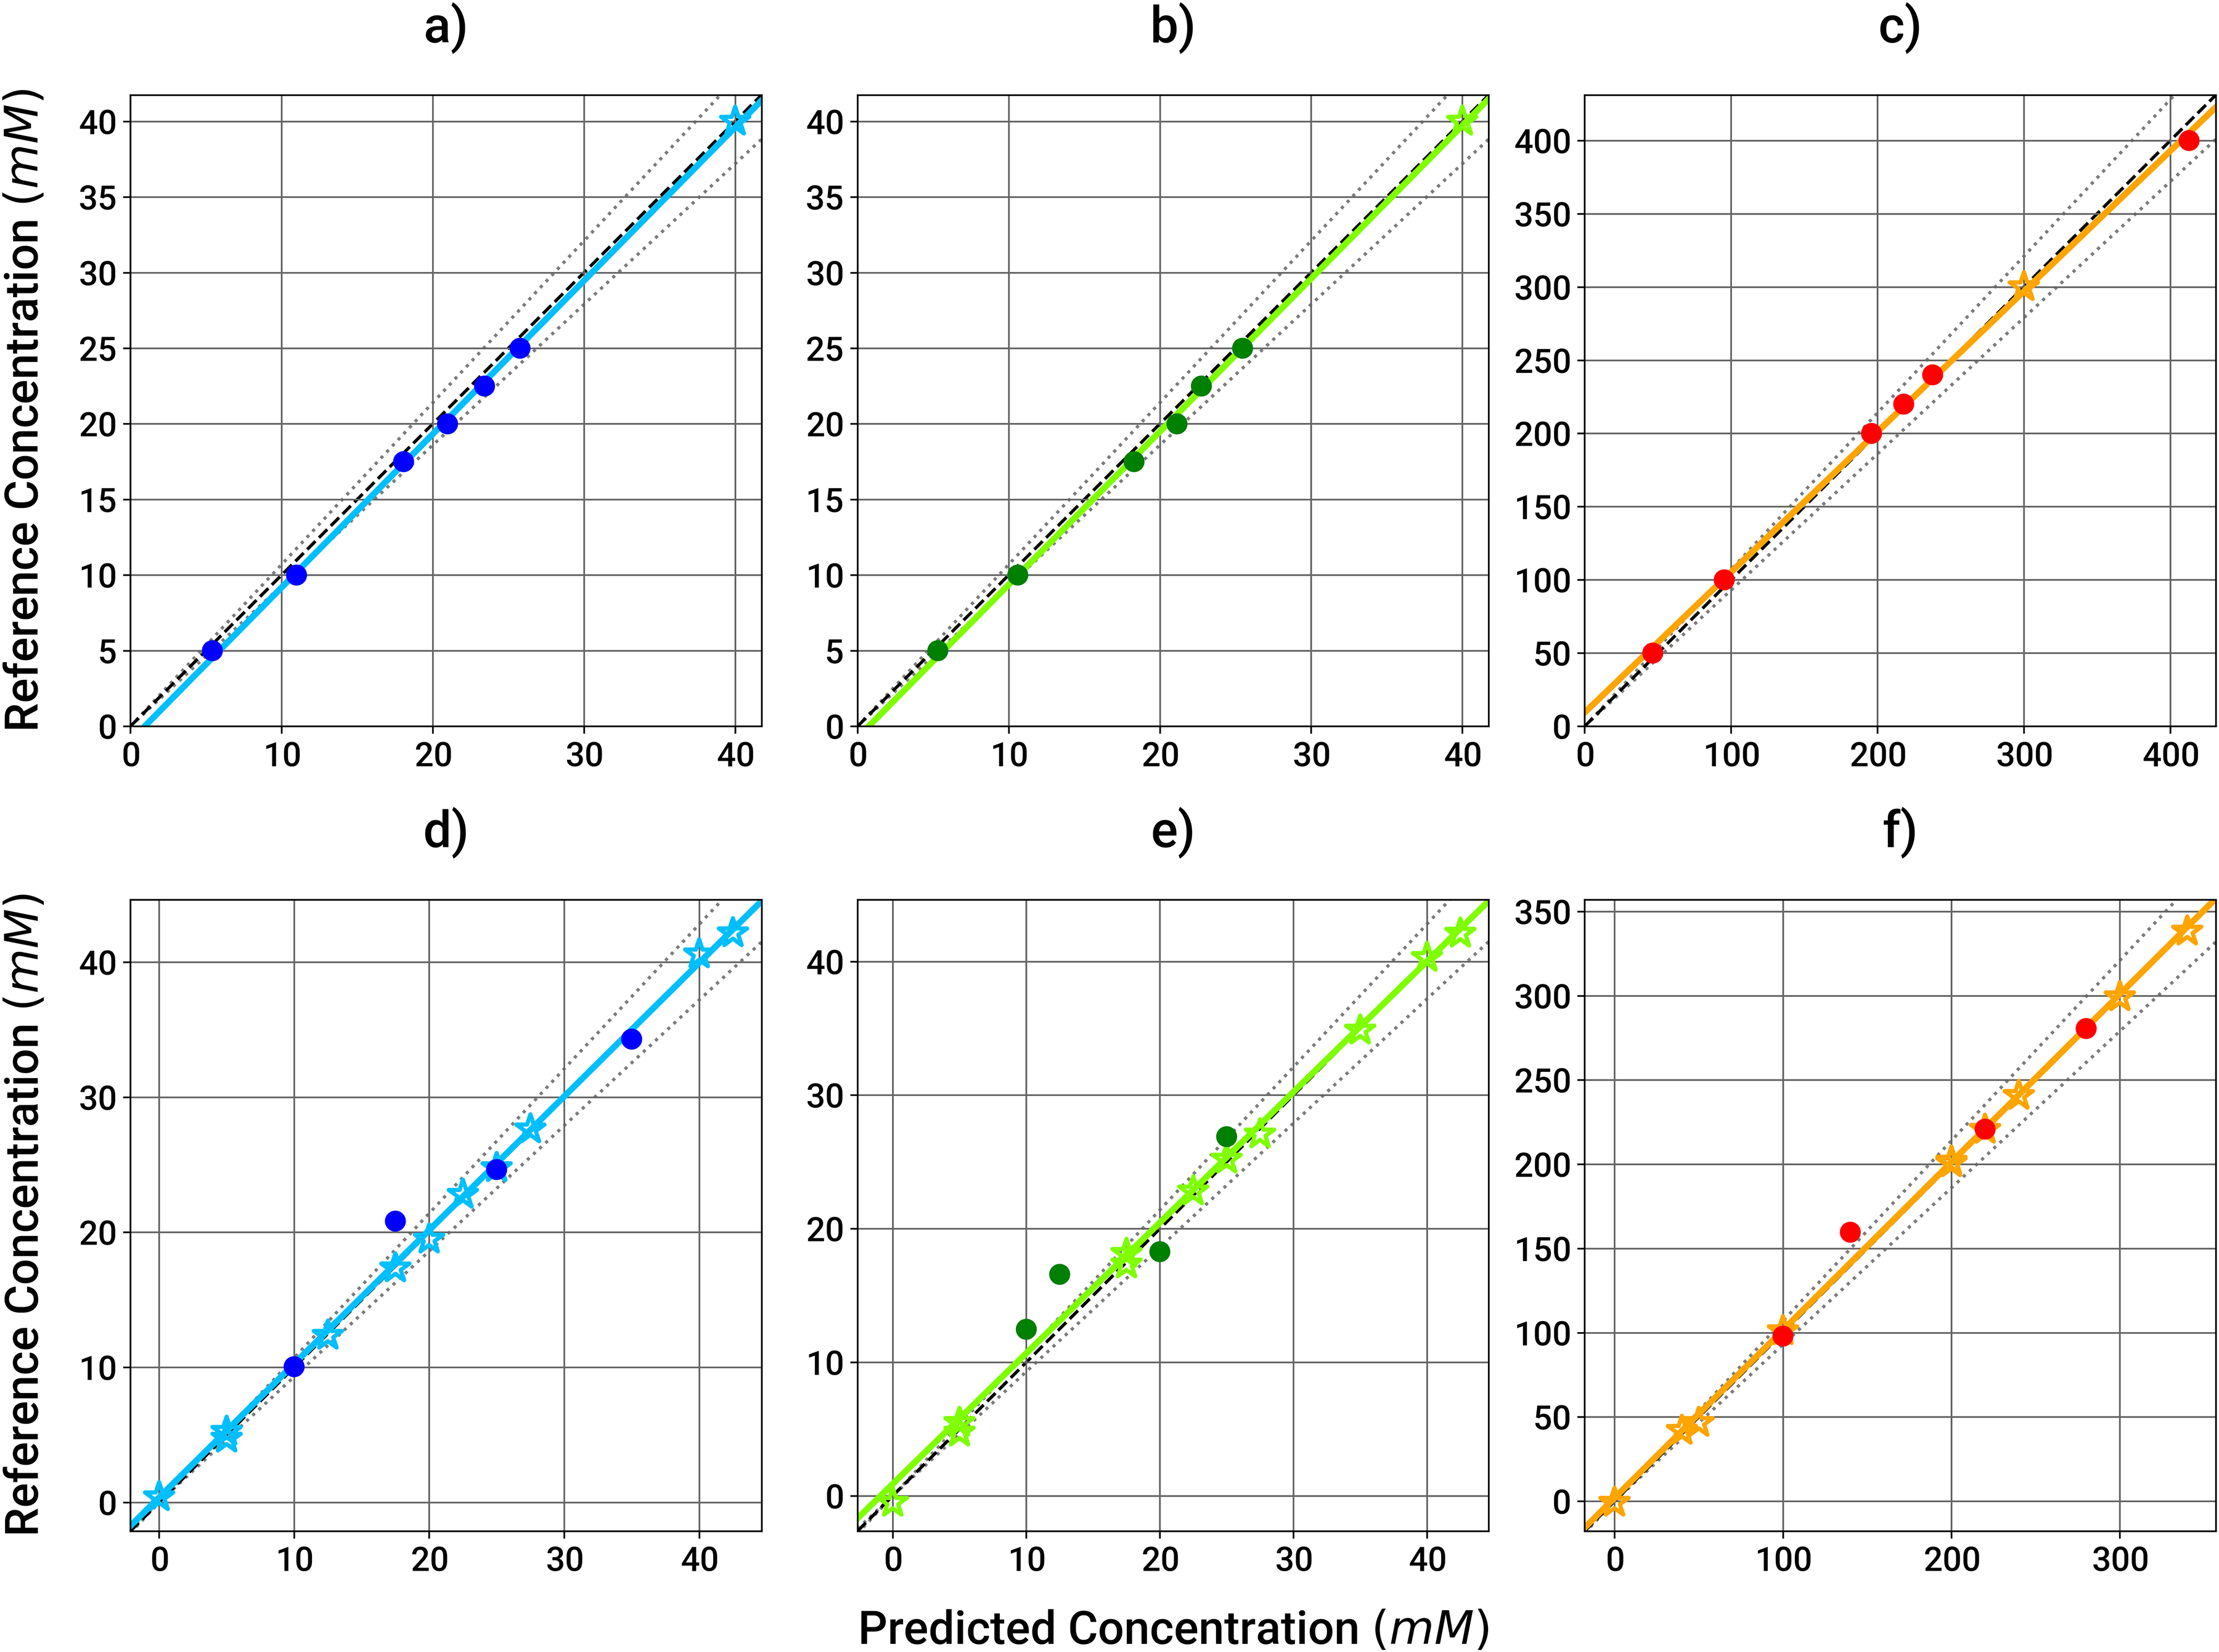
Linearity of excipients measurements in the absence of proteins. Histidine and acetate solutions ranged from 0 to 42.5 mM and sucrose solutions ranged from 0 to 400 mM: (a) Histidine by MIR, (b) acetate by MIR, (c) sucrose by MIR, (d) histidine by Raman, (e) acetate by Raman, and (f) sucrose by Raman. Calibration (MIR) and training (Raman) datapoints are represented with stars, test data are represented with circles. Solid lines correspond to the calculated regressions, the dark dashed lines to the 1:1 regressions and the light dotted lines to the ±7% deviation from the respective1:1 regressions.
As proof of the capability of the device to measure excipients and protein concentrations simultaneously, histidine, acetate and sucrose concentrations were measured alone and in the presence of protein. The results shown in Figure 6 demonstrate that MIR spectroscopy can be used to predict the concentrations for the three excipients tested, with RMSE values of 0.7, 0.6, and 5.7 mM for histidine, acetate, and sucrose, respectively. When using Raman spectroscopy, RMSEC values of 0.4 (0.9%), 0.4 (1.0%), and 1.9 (0.6%) mM were obtained for the PLS models built each with two latent variables for histidine, acetate, and sucrose, respectively. For the same respective models, RMSECV scores of 2.7 (6.4%), 4.5 (10.5%), and 4.6 (1.3%) mM were achieved, whereas RMSEP scores of 1.7 (6.8%), 2.7 (18.1%) and 9.9 (5.5%) mM were obtained. Considering that ranges of about ± 2 mM (for histidine and acetate) and ± 20 mM (for sucrose) are typically set for drug substance specifications, MIR spectroscopy appears to be suitable for the quantification of commonly used excipients in formulations 38 in the presence of protein, and thus to support the development of diafiltration buffers. Considering the achieved accuracy for histidine and sucrose, Raman spectroscopy could also be considered for process control applications. The larger error obtained with this technology and the built PLS-based acetate model would restrict its use as support for development efforts or to the process monitoring of this excipient. Yet, the underlying measurements were performed offline and further development is required for the transition to inline analytics.
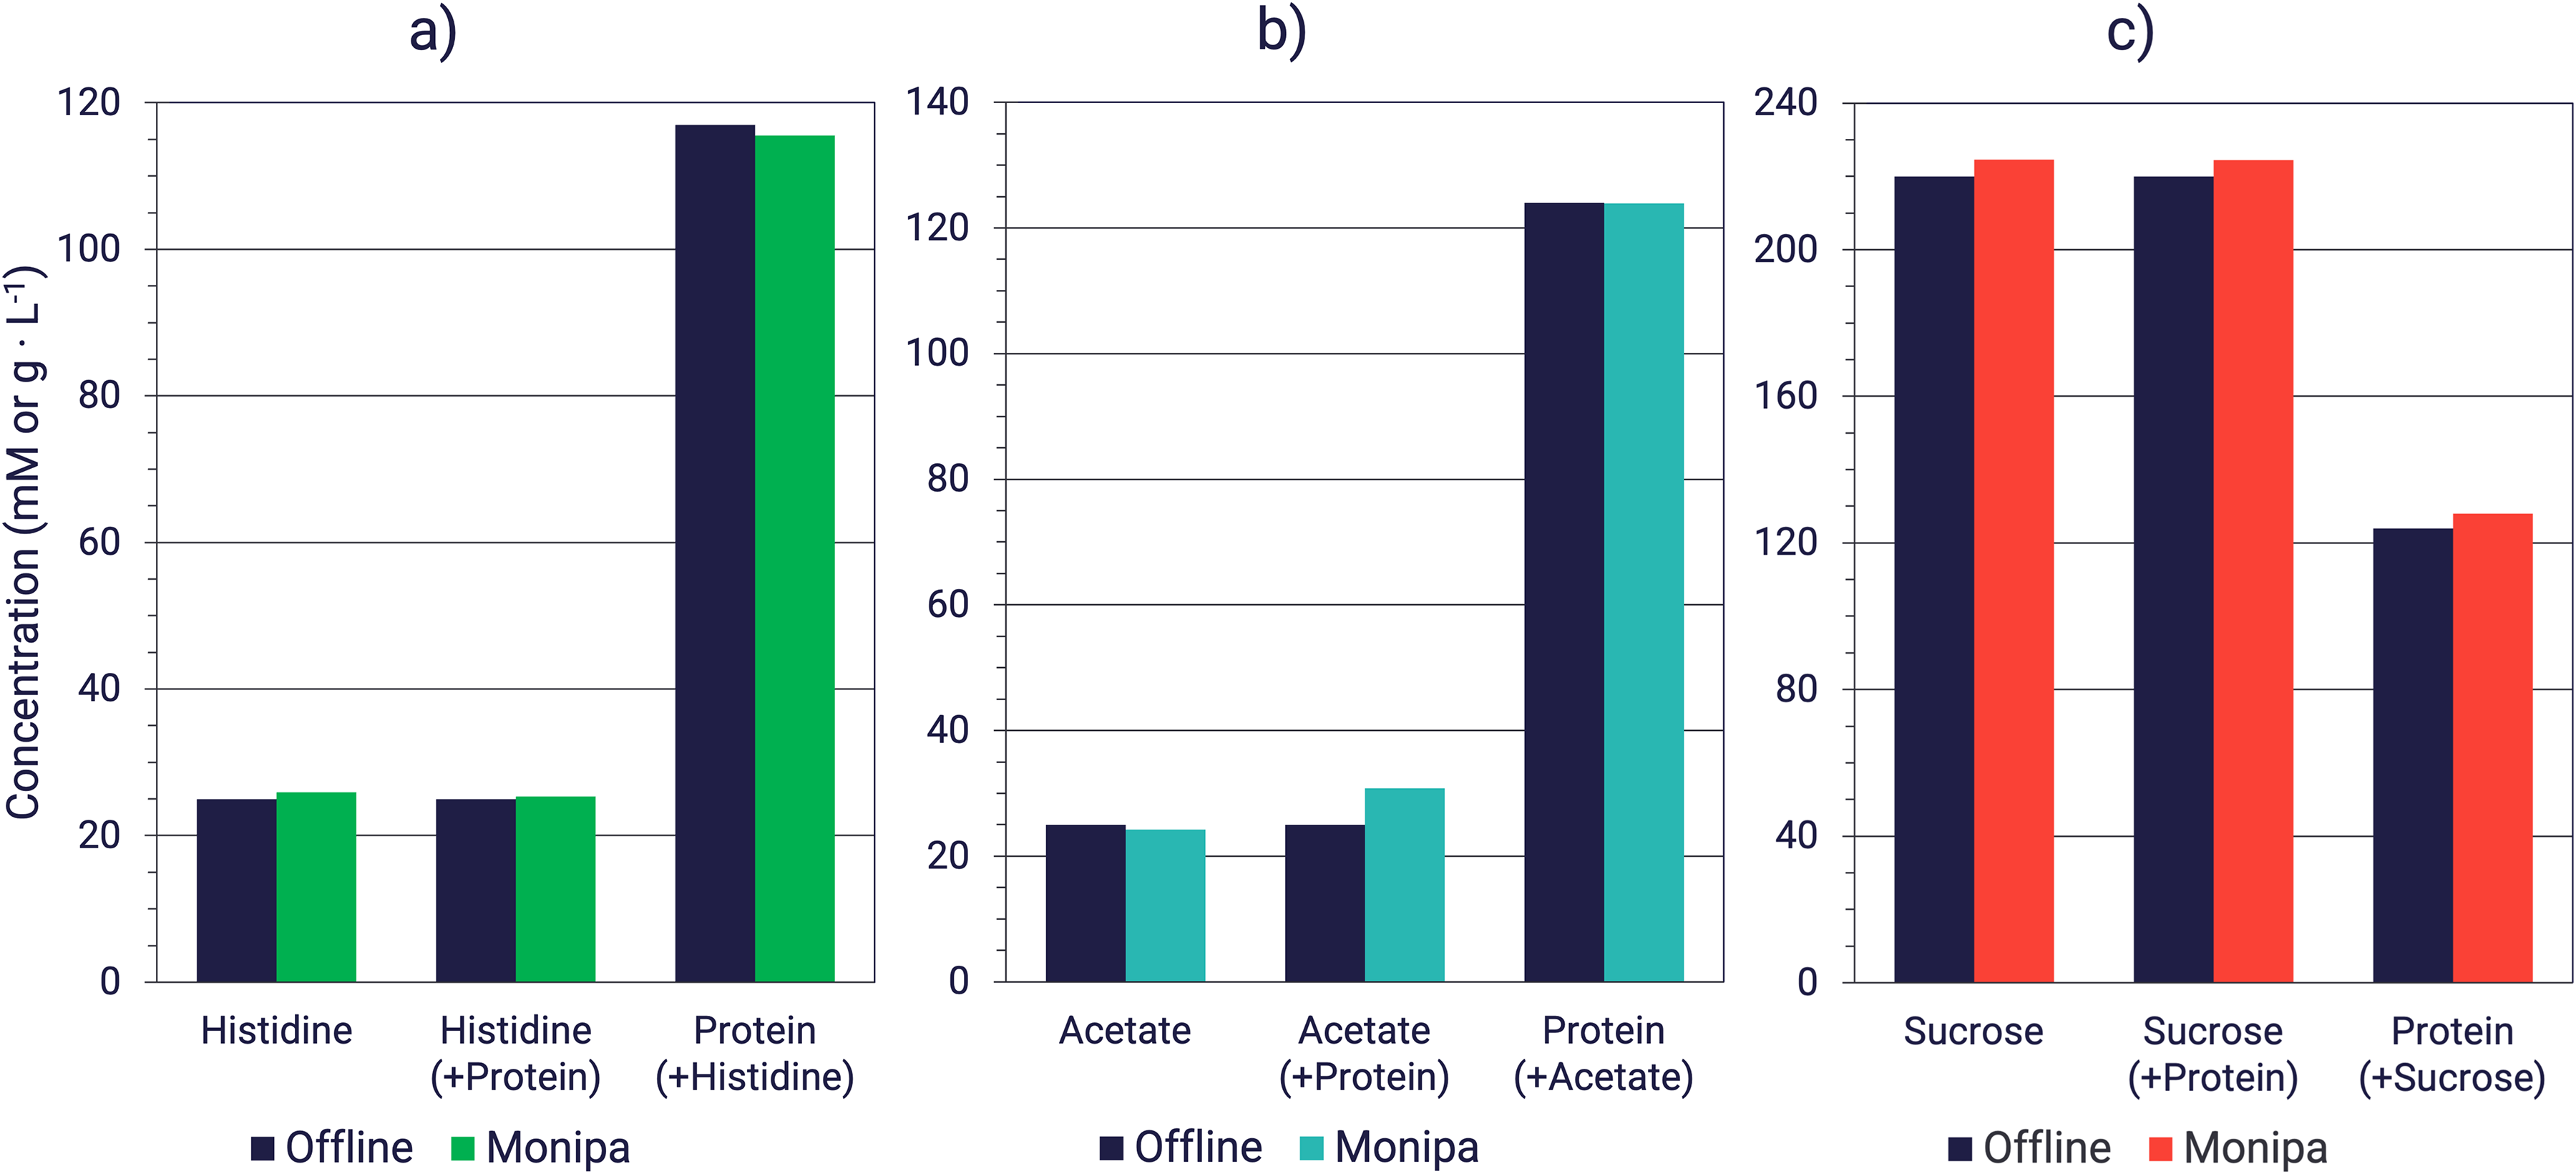
MIR spectroscopy offline quantification of excipients alone and in the presence of protein. (a) Histidine and protein concentrations were measured in a solution of histidine (20 mM) in water and the presence of protein (117 g/L). (b) Acetate and protein concentrations were measured in a solution of acetate (20 mM) in water and the presence of protein (124 g/L). (c) Sucrose and protein concentrations were measured in a solution of sucrose (220 mM) in water and the presence of protein (124 g/L).
For the quantification of excipients, 30 s and 10 min would be required for Raman and MIR spectroscopy, respectively. Both timings are outperforming the offline analytics, since CZE and ion-suppression reverse phase chromatography readouts for one sample would require 90 and 30 min, respectively, with the same assumptions described previously as for the offline HPLC measurements (except for gravimetric dilutions which are not required for these methods).
Conclusion
Real-time inline monitoring of protein concentration during UF/DF downstream operation can be achieved using PAT tools. In this publication, we demonstrated that three spectroscopic techniques are suitable for monitoring protein concentration: variable pathlength UV, MIR, and Raman spectroscopy. When disregarding the impaired lab scale MIR data, the three assessed spectroscopies yielded results that were in accordance with the offline reference values and with errors on the prediction lower than 7%, thereby proving their applicability to support process development activities and act as timely in-process control tools during large scale operations through inline monitoring of protein concentration. The model built at large scale for Raman spectroscopy would however gain in robustness with additional datapoints included in the training set. As an additional proof of concept, MIR spectroscopy demonstrated the possibility of monitoring excipient concentration, not only showing a linear response but also being able to predict excipients and protein when they are both in solution. Even though further development is necessary for inline monitoring of excipients, MIR spectroscopy shows promising results regarding future implementation, since errors in predictions were within the targeted ±7% range. Raman also has potential for inline monitoring of excipients such as histidine and sucrose but did not meet the targeted accuracy when it came to the quantification of acetate. Even though the acetate model could support development efforts, its accuracy would require to be refined, would process control be in scope.
To summarize, all spectroscopic techniques, MIR, UV, and Raman, were suitable for protein concentration monitoring. In addition, MIR spectroscopy met accuracy requirements for the monitoring of histidine, acetate, and sucrose, whereas the setup assessed here for Raman spectroscopy was shown to be eligible for such application for histidine and sucrose. Furthermore, even though they are still not widely implemented in routine development and manufacturing, these techniques show a high potential for reducing development timelines, through the reduction of needed analytical assays and time for analytical readout. Their use will also decrease process variability during biopharmaceutical manufacturing, exerting a higher level of control during UF/DF operation and further increasing process understanding.
Supplemental Material
sj-docx-1-app-10.1177_27551857261448240 - Supplemental material for Ultrafiltration–Diafiltration Inline Monitoring for Protein and Excipient Concentration: A Comparison of Mid-Infrared, Raman, and Variable Pathlength Ultraviolet Spectroscopy
Supplemental material, sj-docx-1-app-10.1177_27551857261448240 for Ultrafiltration–Diafiltration Inline Monitoring for Protein and Excipient Concentration: A Comparison of Mid-Infrared, Raman, and Variable Pathlength Ultraviolet Spectroscopy by João Medeiros Garcia Alcântara, Boris Fessler, Ariana Peredo, Mengyao Li, Niklas Zell, Alexander Geissler and David Garcia in Applied Spectroscopy Practica
Footnotes
Declaration of Conflicting Interest
The author(s) declared the following potential conflicts of interest with respect to the research, authorship, and/or publication of this article: Author Alexander Geissler is shareholder in IRUBIS GmbH.
Ethical Considerations
Ethical approval was not sought for the present study because it did not involve any living beings and complied with all relevant institutional and national guidelines for ethical research.
Funding
The author(s) received no financial support for the research, authorship, and/or publication of this article.
ORCID iDs
Supplemental Material
Supplemental material for this article is available online.
References
Supplementary Material
Please find the following supplemental material available below.
For Open Access articles published under a Creative Commons License, all supplemental material carries the same license as the article it is associated with.
For non-Open Access articles published, all supplemental material carries a non-exclusive license, and permission requests for re-use of supplemental material or any part of supplemental material shall be sent directly to the copyright owner as specified in the copyright notice associated with the article.