
Abstract
Accurate forecasting of tourism demand is critical for policy and business planning yet remains challenging due to the inherent complexity and vulnerability of tourism demand to external shocks. This study introduces a novel predictivity metric based on Weighted Permutation Entropy (WPE) for assessing the intrinsic predictivity of tourism demand data. Building on the limitations of existing entropy measures, particularly Sample Entropy (SampEn) and Multiscale SampEn, WPE is proposed for its effectiveness in capturing both ordinal and amplitude dynamics of the tourism demand, especially under external shocks, such as the COVID-19 pandemic. Using monthly tourist arrival data from Australia, the study evaluates the predictivity of tourism demand across different temporal scales and lengths. The study provides actionable insights for enhancing tourism demand forecasting by optimizing data aggregation scales and adapting the predictivity metric during volatile periods.
Keywords
Introduction
The tourism industry is a vital driver of economic growth for many nations (Vu et al., 2025). Accurate tourism demand forecasting is essential in providing critical insights into emerging trends, evolving tourist preferences, and market dynamics, enabling policy-makers and businesses to make informed decisions (Li et al., 2023). The increasing availability of data and advanced forecasting techniques has fueled efforts to refine these techniques and push the boundaries of predictive potential in tourism data (Zhang et al., 2020).
However, despite these advancements, accurately predicting tourism demand remains a complex challenge (Zhang et al., 2021a, 2021b). Tourism demand is influenced by a multitude of factors, including seasonality, economic cycles, geopolitical events, and unexpected disruptions such as pandemics or natural disasters, all of which introduce significant variability and uncertainty into international tourist flows (Song et al., 2019). These complexities limit the effectiveness of traditional forecasting models, highlighting the need for a deeper understanding of the intrinsic predictivity of tourism demand data—the theoretical upper bound of forecasting accuracy determined by the inherent structure of the data itself (Pennekamp et al., 2019). In the context of tourism, intrinsic predictivity refers to the theoretical maximum accuracy future tourist arrivals can be achieved from historical data patterns (Zhang et al., 2021a, 2021b).
This is particularly relevant, as a recent data-driven meta-method, the RobustSTL-ARIMA-LSTM model proposed from the work of Li et al. (2023), has demonstrated high forecasting accuracy (e.g., up to 98% for Hong Kong tourism data). These results raise fundamental questions about the true predictivity limits of tourism demand data and the reliability of existing predictivity metrics. If forecasting models achieve high accuracy in some cases but fail in others, understanding which predictivity metrics provide the most robust insights into intrinsic predictivity of tourism demand data is essential for future research and practical applications.
Several studies have proposed approaches to evaluate time series predictivity, primarily grounded in Information Theory and entropy-based measures (Zhang et al., 2021a, 2021b). For example, Song et al. (2010) employed variations of Shannon entropy to estimate the upper bound of human mobility predictability, while Pennekamp et al. (2019) quantified the intrinsic predictivity of ecological time series using Weighted Permutation Entropy. Despite the significance of predictivity in tourism demand forecasting, this topic remains underexplored. Zhang et al. (2021a, 2021b) examined the predictivity of Hong Kong’s tourist arrival data by applying Sample Entropy (SampEn) and Multiscale Sample Entropy (MulSampEn) to measure time series complexity and derive maximum predictivity through Fano’s inequality. However, a key limitation of their study lies in the use of these entropy measures, which are not well-suited for accurately capturing the complexity of non-stationary time series (Richman et al., 2004).
The limitation of these measures lies in their methodology, particularly the tolerance distance
Addressing this challenge is the main focus of this research and is essential for developing more robust and reliable metric for assessing the predictivity of tourism demand, especially in the face of unforeseen disruptions (Polyzos et al., 2020). This study proposes a novel Weighted Permutation Entropy (WPE)-based metric for assessing the predictivity of tourism demand data. The motivation for using WPE lies in its sensitivity to temporal dynamics and structural complexity within time series, which other entropy measures often fail to capture (Fadlallah et al., 2013). Thus, this work aims to answer the following research question: How to define a metric that effectively captures the intrinsic predictivity of tourism demand data, particularly under conditions of volatility and disruption?
Building on the work of Zhang et al. (2021a, 2021b) and other related studies, this study assesses the predictivity of tourism demand data and offers the following key contributions. The study proposes a novel and robust metric based on WPE for assessing the predictivity of tourism demand, which is effective in capturing the impacts of external shocks, such as the COVID-19 pandemic. The research identifies the effect of data characteristics, specifically the length and temporal scale of time series data, on predictivity. This helps ensure that forecasting models are built using data with characteristics that offer the highest theoretical potential for accurate prediction. By understanding the relationship between predictivity and actual forecasting performance, practitioners can better select forecasting models that fully leverage the predictive potential of data. These contributions are particularly valuable for risk mitigation strategies within the tourism sectors. For instance, understanding how predictivity declines during external shocks and how quickly it recovers provides an evaluation of the reliability of forecasting models. As a result, government and businesses can formulate more resilient and adaptive strategic plans, minimizing potential losses.
The remainder of this paper is structured as follows: Section literature review evaluates potential metrics to assess the predictivity of tourism demand data. Section at predictivity of tourism deman data presents the calculation and parameter tuning of the predictivity metric based on Weighted Permutation Entropy (WPE). Section at empirical validation of the predictivity metric empirically evaluates and compares predictivity metrics on Australia’s tourist arrival statistics, across time series before and after the COVID-19 pandemic, and explores the relationship between forecasting performance, data characteristics, and these predictivity metrics. Sections at discussion and implications and conclusion discuss the implications and present the conclusion of the study.
Literature Review
This section reviews general predictivity measures from the perspective of time series complexity, which are rooted in two main theoretical frameworks: the Dynamical Systems Theory and Information Theory (Yao et al., 2004). Subsequently, it will focus on entropy measures as a means to quantify intrinsic predictivity, discussing their theoretical foundation and applicability to tourism demand forecasting. Finally, it will examine existing applications of these measures in tourism and highlight the research gap this study aims to address.
General Predictivity Measures
Predictivity in time series forecasting can be categorized into two main types: realized predictivity and intrinsic predictivity. Among them, realized predictivity refers to the actual accuracy achieved by a specific forecasting model when applied to a dataset. For example, the Root Mean Squared Error (RMSE) of a time series forecast quantifies its realized predictivity. In contrast, intrinsic predictivity represents the theoretical upper limit on how well any model can forecast a time series based on the inherent deterministic and stochastic components in the data (Pennekamp et al., 2019). The realized predictivity of forecasting models can then be used to indicate how effectively these models capture the underlying intrinsic predictivity.
This study focuses on assessing the intrinsic predictivity of tourism demand, particularly in univariate time series. While multivariate models often offer improved forecasting potential, they involve complex predictor selection issues that are beyond the scope of this work (Kovantsev & Gladilin, 2020).
Entropy measures offer a practical approximation of intrinsic predictivity by capturing the underlying structure and randomness of time series data. In general, time series that are highly regular (e.g., periodic) are more predictable, while those that are chaotic or purely stochastic exhibit reduced predictivity (Boffetta et al., 2002). Measures of complexity aim to quantify this spectrum and distinguish between deterministic and random behavior (Bandt & Pompe, 2002).
Yao et al. (2004) identified two foundational approaches to quantifying complexity: the dynamical systems approach, which relies on system trajectories and initial conditions; and the information theory approach, which assesses the randomness and structural order in data.
These frameworks form the basis for entropy measures of predictivity.
Dynamical Systems Perspective
From the dynamical systems perspective, predictivity is linked to the rate of error growth and the amount of information produced by the system over time (Boffetta et al., 2002). The key measures in this context are the Lyapunov exponent (LE) that quantifies the time interval
Kolmogorov-Sinai entropy, while theoretically sound, is difficult to compute for empirical datasets, especially those with small data volumes or structural breaks, which is common in tourism demand data. These limitations have led researchers to exploit the statistical description of the data generated by the system to study its dynamical behavior using entropy measures derived from information theory (Barà et al., 2024).
Information Theory Perspective
In information theory, predictivity is inversely related to randomness. A time series with a well-defined structure exhibits lower entropy and therefore higher predictivity, while a fully random sequence has maximum entropy and is inherently unpredictable (Adelyanov et al., 2024). Entropy quantifies the average uncertainty in a sequence of outcomes and serves as a foundation for several complexity measures (Adelyanov et al., 2024).
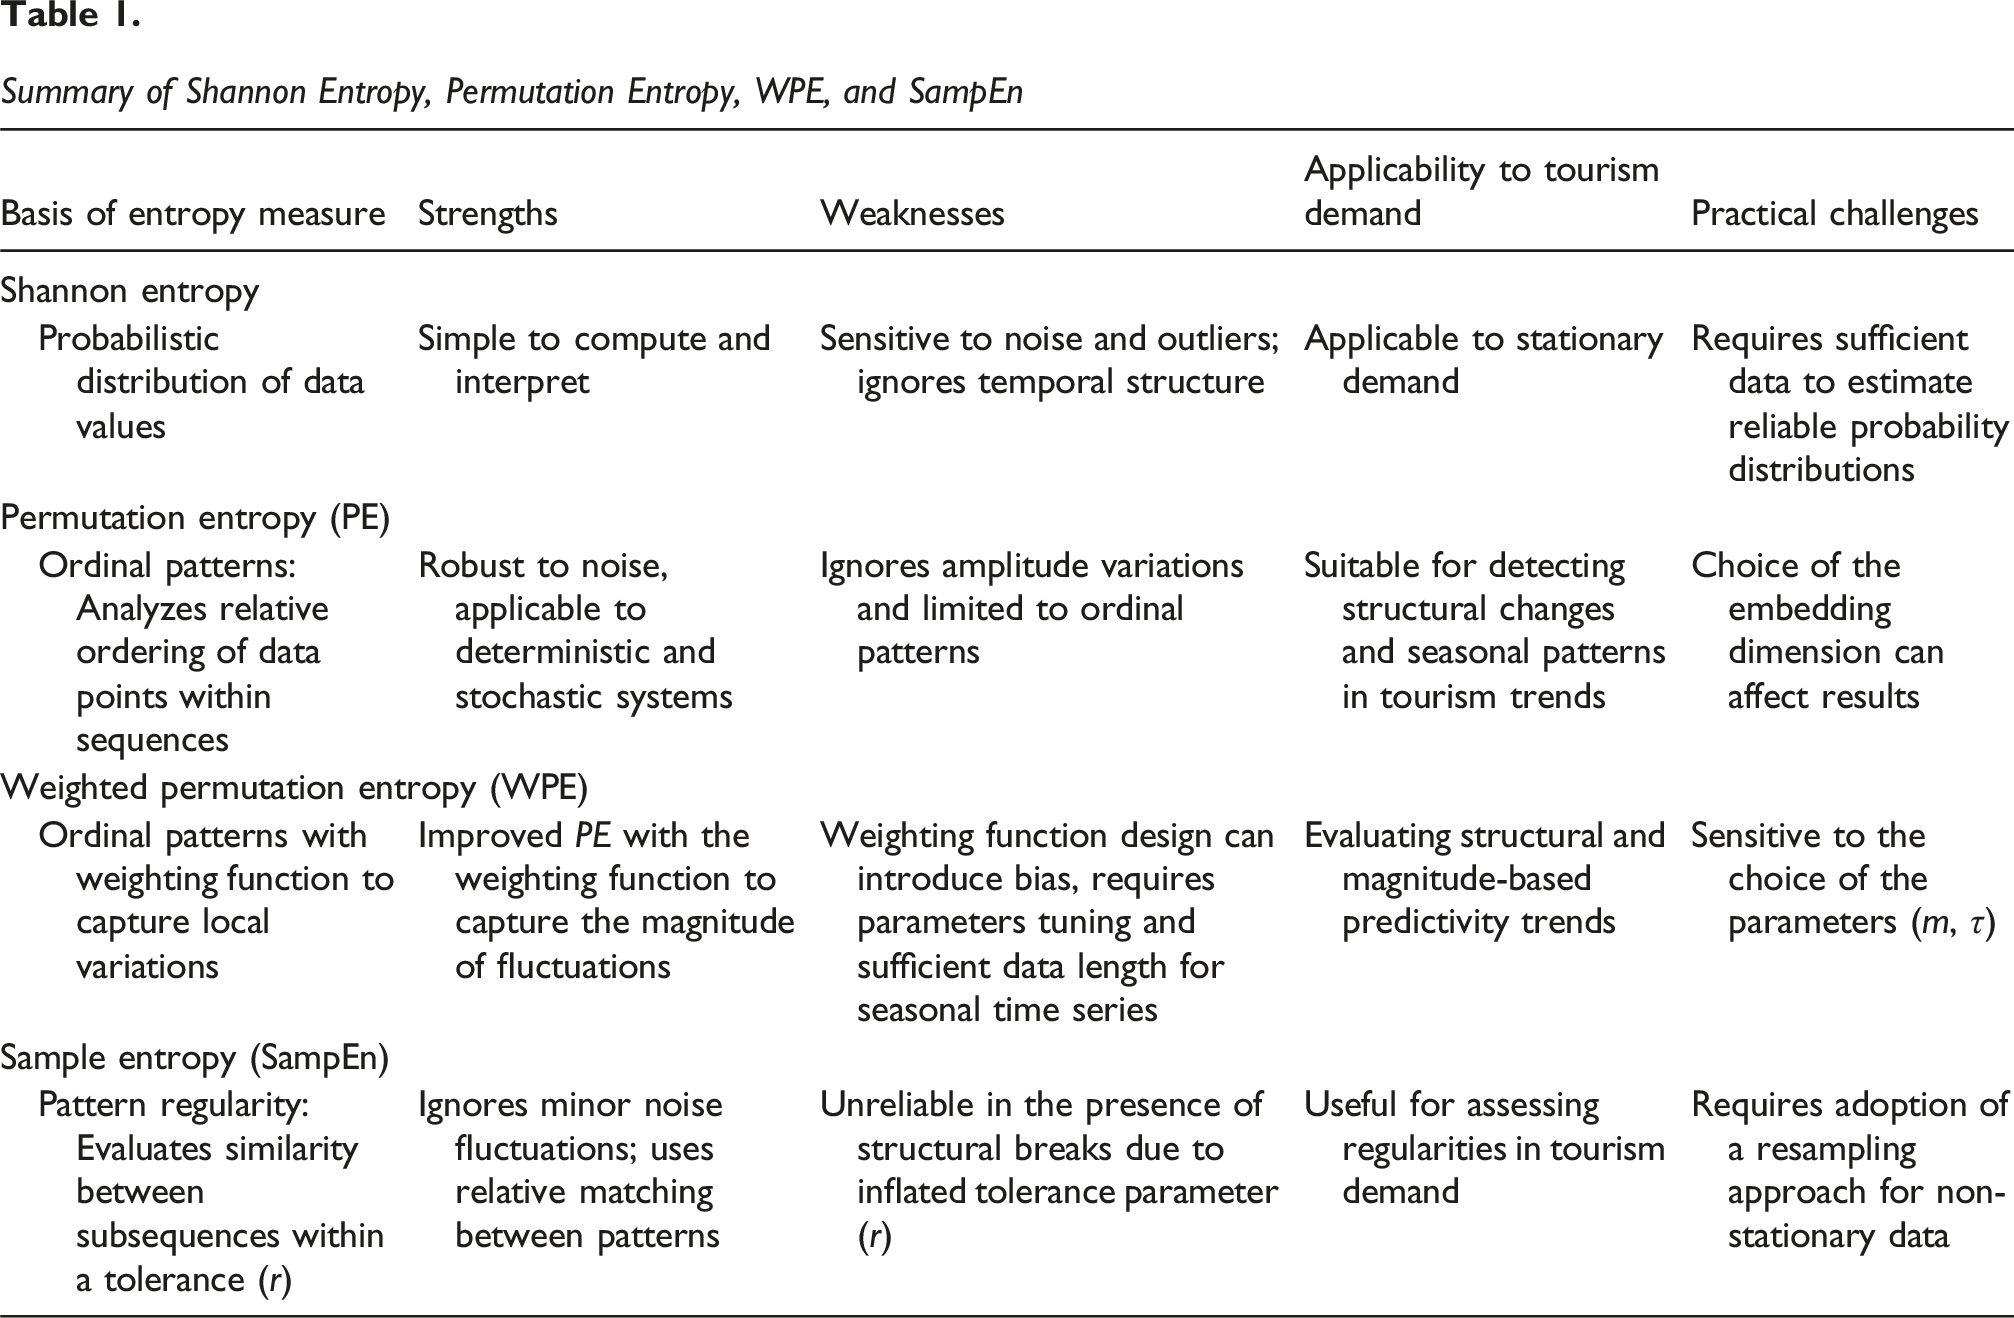
The most widely known entropy measures for time series include Shannon Entropy, Permutation Entropy (PE), Sample Entropy (SampEn), and their variants. These measures differ in the way they encode information, handle noise, and account for data attributes (Adelyanov et al., 2024; Bandt & Pompe, 2002) that are especially relevant in tourism demand data.
Shannon Entropy
Introduced by Claude Shannon in 1948, Shannon Entropy provides a foundational measure of uncertainty by calculating the probability distribution of time series values (Adelyanov et al., 2024). While it is simple to compute, it assumes stationarity and does not account for temporal or ordinal relationships, making it less suitable for non-stationary tourism data characterized by seasonality and structural shifts.
Permutation Entropy (PE)
PE extends Shannon Entropy by incorporating ordinal structure and was proposed by Bandt and Pompe (Bandt & Pompe, 2002). It analyzes the frequency of different order patterns within a time series and is robust to noise (Bandt & Pompe, 2002). However, PE ignores amplitude information and may produce misleading results in time series with low resolution (Adelyanov et al., 2024), which are typical challenges in tourism datasets.
To overcome this, several PE variants have been developed. For example, Weighted Permutation Entropy (WPE) incorporates amplitude information by weighting patterns based on local variability (Fadlallah et al., 2013). Other enhancements include Multiscale WPE (MSWPE) (Xia et al., 2015) and Fine-Grained PE (FGPE) (Xu et al., 2019), which capture dynamics at different scale or levels of detail.
Sample Entropy (SampEn)
SampEn assesses the regularity of patterns by computing the probability that similar sequences remain similar when extended (Richman & Moorman, 2000). It is less sensitive to short time series than Approximate Entropy (AppEn) but relies heavily on the tolerance parameter
Given these properties, entropy measures have been increasingly applied to domains such as tourism, where complex and non-linear dynamics prevail (Law et al., 2019).
Entropy Measures for Tourism Demand Predictivity
The application of entropy measures to tourism demand forecasting requires careful consideration of the data’s specific characteristics; successful applications in related fields provide a basis for their use. For example, Song et al. (2010) effectively employed entropy to quantify predictability in human mobility, a domain closely related to tourism. This demonstrates the potential of entropy to capture underlying regularities and constraints that influence demand patterns, justifying further exploration of entropy measures in the context of tourism demand.
The suitability of entropy measures for tourism demand data depends on their ability to address its complex characteristics, including strong seasonality, non-stationarity, and vulnerability to external shocks (Song et al., 2019). These features make selecting an appropriate entropy measure particularly challenging.
Sample Entropy has been applied in tourism demand predictivity studies due to its robustness to noise and effectiveness in detecting recurring patterns (Zhang et al., 2021a, 2021b). However, its dependence on the tolerance parameter
Summary of Shannon Entropy, Permutation Entropy, WPE, and SampEn
Zhang et al. (2021a, 2021b) provided a methodological framework for assessing the maximum predictivity of tourism data using entropy measures. Their approach involved calculating SampEn (MulSampEn) and then relating these entropy values to maximum predictivity using Fano’s inequality. This approach demonstrates that entropy measures can be adapted to quantify the theoretical limits in the predictivity of tourism demand data.
The methodological framework proposed by (Zhang et al., 2021a, 2021b), while offering valuable insights towards quantifying the predictivity of tourism demand using entropy measures, exhibits several limitations that require further investigation. First, their study lacks a robust rationale for the selection of SampEn as a suitable measure for assessing the intrinsic predictivity of tourism demand data. This lack of clear justification raises concerns about the fundamental validity of using SampEn to accurately reflect the inherent characteristics of tourism demand data. Second, the scope of their analysis regarding external shocks is limited to the SARS outbreak in 2003. While significant, the impact of SARS was relatively contained and short-lived compared to the profound and prolonged impact caused by the COVID-19 pandemic (Song et al., 2022). This limited consideration of external shocks raises questions about the generalizability and robustness of their findings, particularly in the context of more severe and prolonged global crises that significantly alter tourism demand patterns.
Summary
Although entropy measures have shown promise in evaluating the predictivity of time series, their application to tourism demand forecasting remains limited and fragmented. Most existing studies emphasize realized predictivity through model-dependent evaluations (Zhang et al., 2021a, 2021b), with insufficient attention to intrinsic data characteristics.
The work Zhang et al. (2021a, 2021b) has made notable progress using SampEn (MulSampEn) to quantify the intrinsic predictivity of tourism demand data. However, their approach overlooks a key methodological limitation inherent to this entropy measure, which leads to incorrect evaluation of predictivity under external shocks, such as COVID-19 pandemic.
This limitation arises from the use of the tolerance parameter
The Predictivity of Tourism Demand Data
The research gap outlined previously motivates the present study to propose Weighted Permutation Entropy (WPE) as a superior alternative. WPE’s enhanced ability to capture temporal dynamics, coupled with its robustness and efficiency, offers a more reliable and practical approach to assessing the intrinsic predictivity of tourism demand, particularly in the case of disruptive events where existing measures fall short. Additionally, its simplified parameter tuning and lower computational complexity compared to other entropy measures enhance its practicality for real-world applications (Adelyanov et al., 2024). This section presents the calculation and parameter tuning of WPE for assessing the intrinsic predictivity of tourism demand data.
Formalization of Tourism Demand Forecasting
In this study, tourism demand forecasting task is defined as predicting the number of future tourist arrivals at destinations using past tourism data. The forecasting relies exclusively on historical data presented as a univariate time series (Zhang et al., 2020).
Let the time series be represented by the vector
The forecasting model, denoted as
Predictivity Based on Weighted Permutation Entropy (WPE)
The WPE extends the standard Permutation Entropy (PE) by capturing the dynamic changes in the amplitude of the time series (Pennekamp et al., 2019). The embedding procedure forms 
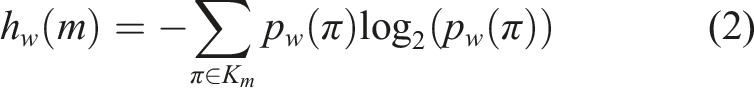
Then the WPE is normalized by the possible maximum PE, and the predictivity (WPE) is calculated as: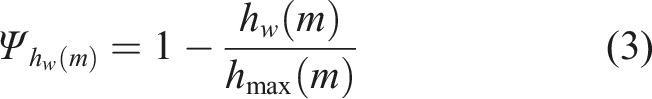
Parameter Tuning for WPE
The calculation of WPE relies on the selection of key parameters: the embedding dimension (m) and the time delay (
Choosing appropriate values for m and
For measuring the complexity of the main oscillation (seasonal cycle), (Riedl, Oertel, and Wessel, 2013) suggests setting the time delay
Figure 1(a) and (b) illustrates an example of WPE parameters tuning for a monthly time series of length WPE With 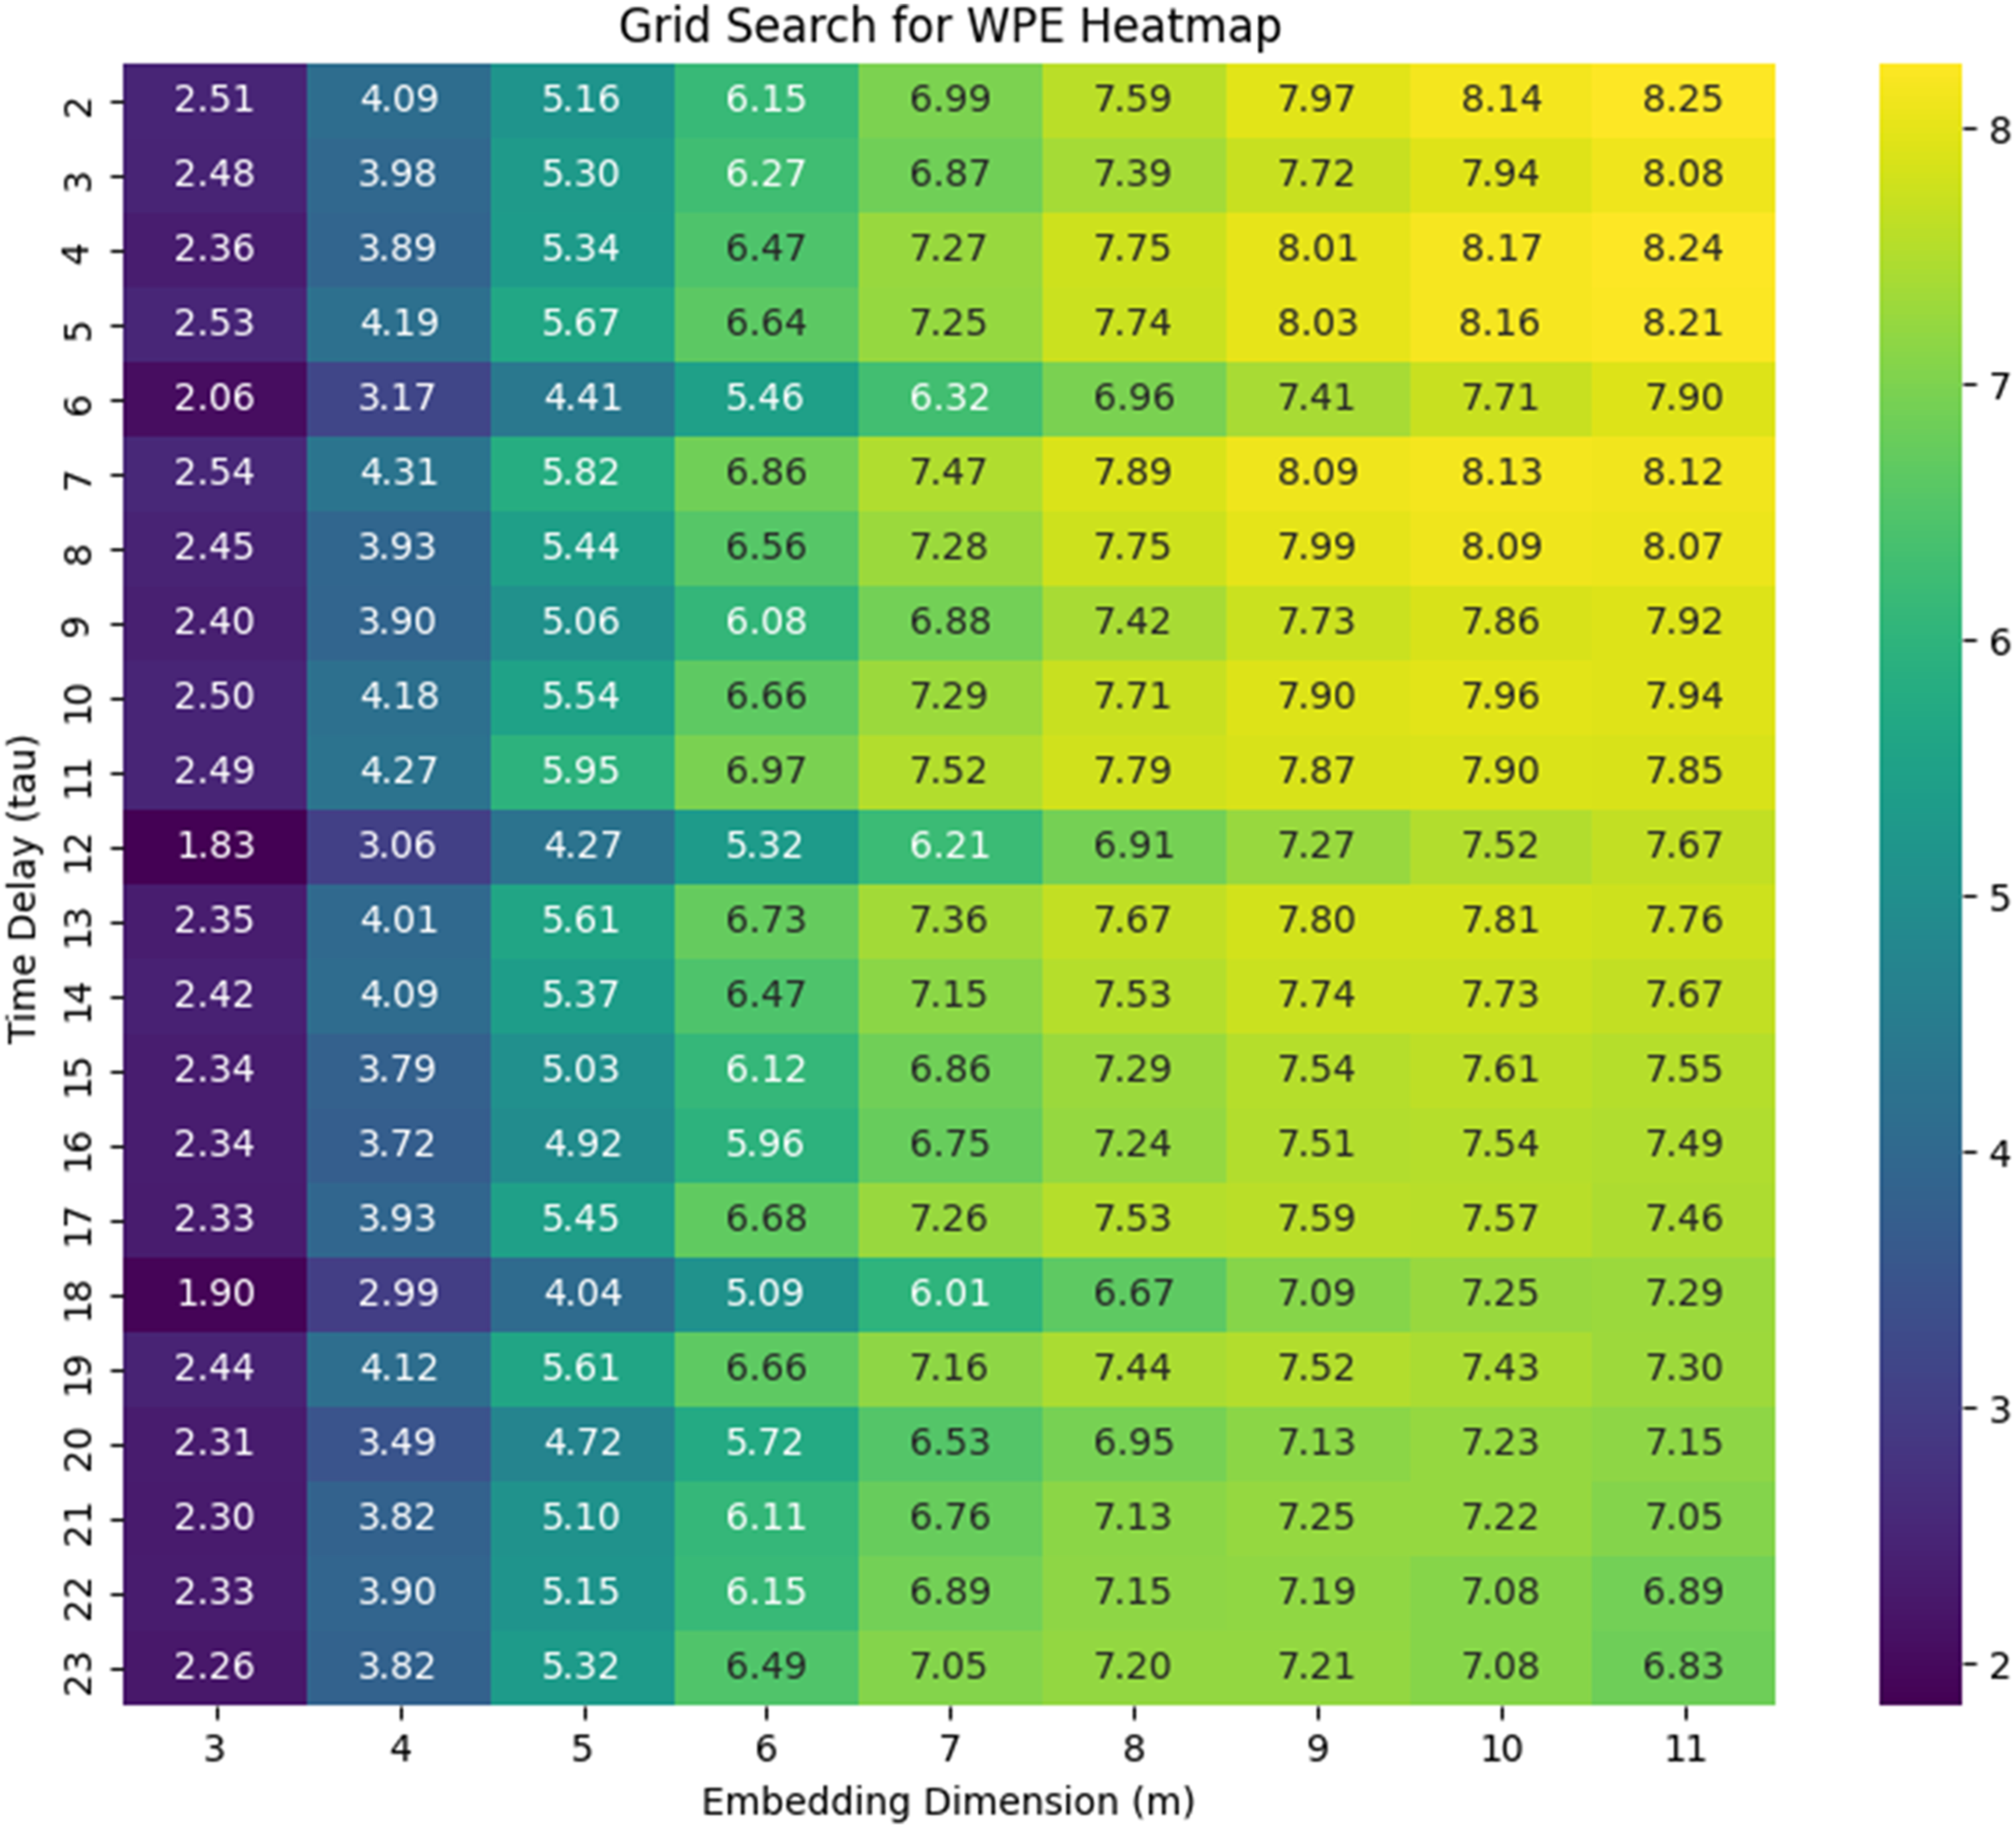
To optimally select the embedding dimension m and time delay
The Empirical Validation of the Predictivity Metric
This section empirically assesses the predictivity of tourism demand data by addressing the core research question: How to define a metric that effectively captures the intrinsic predictivity of tourism demand data, particularly under conditions of volatility and disruption?
The section begins by presenting the validation framework and methods used to validate the metric. This is followed by a detailed rationale and description of the data used in the analysis. The predictivity of Australia’s tourism demand is then assessed using the proposed predictivity metric and compared against the baseline metric based on SampEn (MulSampEn). Subsequently, the empirical validation of the proposed predictivity metric is carried out within the established framework. All experiments are implemented using the Python programming platform.
The Predictivity Metric Validation Framework
The framework, illustrated in Figure 2, assesses the effectiveness of the predictivity metric by defining its correlation with the realized predictivity of tourism demand data. The Predictivity Metric Validation Framework
The validation framework involves the following steps: (1) Calculate the predictivity for a diverse set of tourism demand datasets. (2) Apply established time series forecasting models (e.g., ARIMA, ARIMAX) to these datasets and quantify their realized predictivity with forecasting error (e.g., RMSPE). (3) Analyze the correlation between the predictivity metric and forecasting error.
A strong negative correlation would indicate that higher predictivity (lower complexity) corresponds to lower forecasting errors (higher realized predictivity), thus validating the proposed metric.
Methods Used in the Predictivity Validation Framework
The methods used in the predictivity metric validation framework include predictivity metrics, forecasting models, forecasting error, and correlation coefficients.
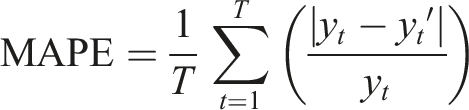
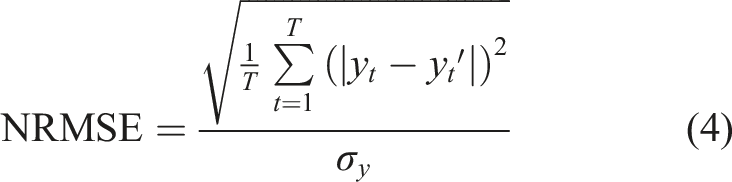
As the code of CIR# (Bufalo & Orlando, 2023b) is not available, therefore autoregressive Integrated Moving Average (ARIMA), its variations, Prophet and CIR (Bufalo & Orlando, 2023a) are adopted as baseline approaches for forecasting tourist arrivals. Forecast results are evaluated using the Root Mean Squared Percentage Error (RMSPE), Mean Absolute Percentage Error (MAPE), and Normalized Root Mean Squared Error (NRMSE) as equation (4).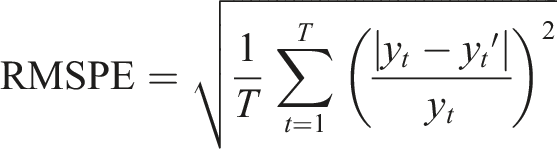
The rank-based non-parametric correlation coefficients Kendall’s and Spearman’s correlation coefficients are employed to assess the relationship between the intrinsic and realized predictivity. Non-parametric methods are suitable when the underlying data distribution is unknown or when dealing with small sample sizes (Denœux et al., 2005), conditions that are common for tourism demand data. These coefficients assess the strength and direction of the monotonic association between predictivity metric rankings and the corresponding RMSPE rankings.
Kendall’s coefficient is a conjoint unweighted rank measure, which reflects the agreement between the rankings and provides a direct probabilistic interpretation that 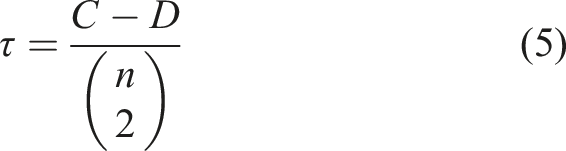
and the total number of possible pairs is for
Spearman’s correlation coefficient measures the strength and direction of a monotonic relationship between two ranked variables, it is computed by first determining the differences between the ranks of the corresponding values and then applying the formula: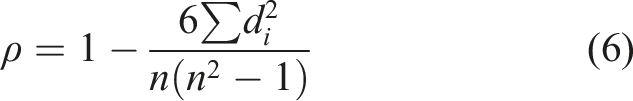
Both correlation coefficients range from
Rationale and Description of the Australian Tourism Demand Data
This study uses monthly statistics of short-term international visitor arrivals to Australia, sourced from the Australian Bureau of Statistics (ABS, 2024), spanning multiple years and including both national and state-level data, which allows for analysis across different temporal and spatial scales. Australia is chosen for three main reasons. First, tourism is one of Australia’s fastest-growing industries and a major export sector, and during the COVID-19 pandemic, the country experienced losses of nearly A$9 billion per month in tourism revenue and over 300,000 job losses (Pham et al., 2021), making it economically significant for assessing tourism demand predictability. Second, the richness of the data enables robust testing of the Weighted Permutation Entropy (WPE) predictivity metric across multiple datasets with varying lengths and seasonal patterns. Third, no previous study has specifically applied WPE to Australia’s tourism demand, making this research novel and providing insights into a diverse tourism market, which can support the development of more accurate forecasting models. By leveraging this comprehensive dataset, the study assesses WPE’s ability to capture intrinsic predictability in a real-world, economically important setting. The data consist of 406 monthly records of international tourist arrivals in the Australian states and territories from January 1991 to October 2024 and include nine distinct datasets that are presented in Figure 3. It is observed that the tourist flow increased from 1991 to February 2020, followed by a sharp decline due to the COVID-19 travel restrictions introduced in March 2020. The international border restrictions were subsequently lifted on July 6, 2022 (The Department of Home Affairs, 2022). The Graph Shows Monthly International Tourist Arrivals in Australia and Its States and Territories From January 1991 to October 2024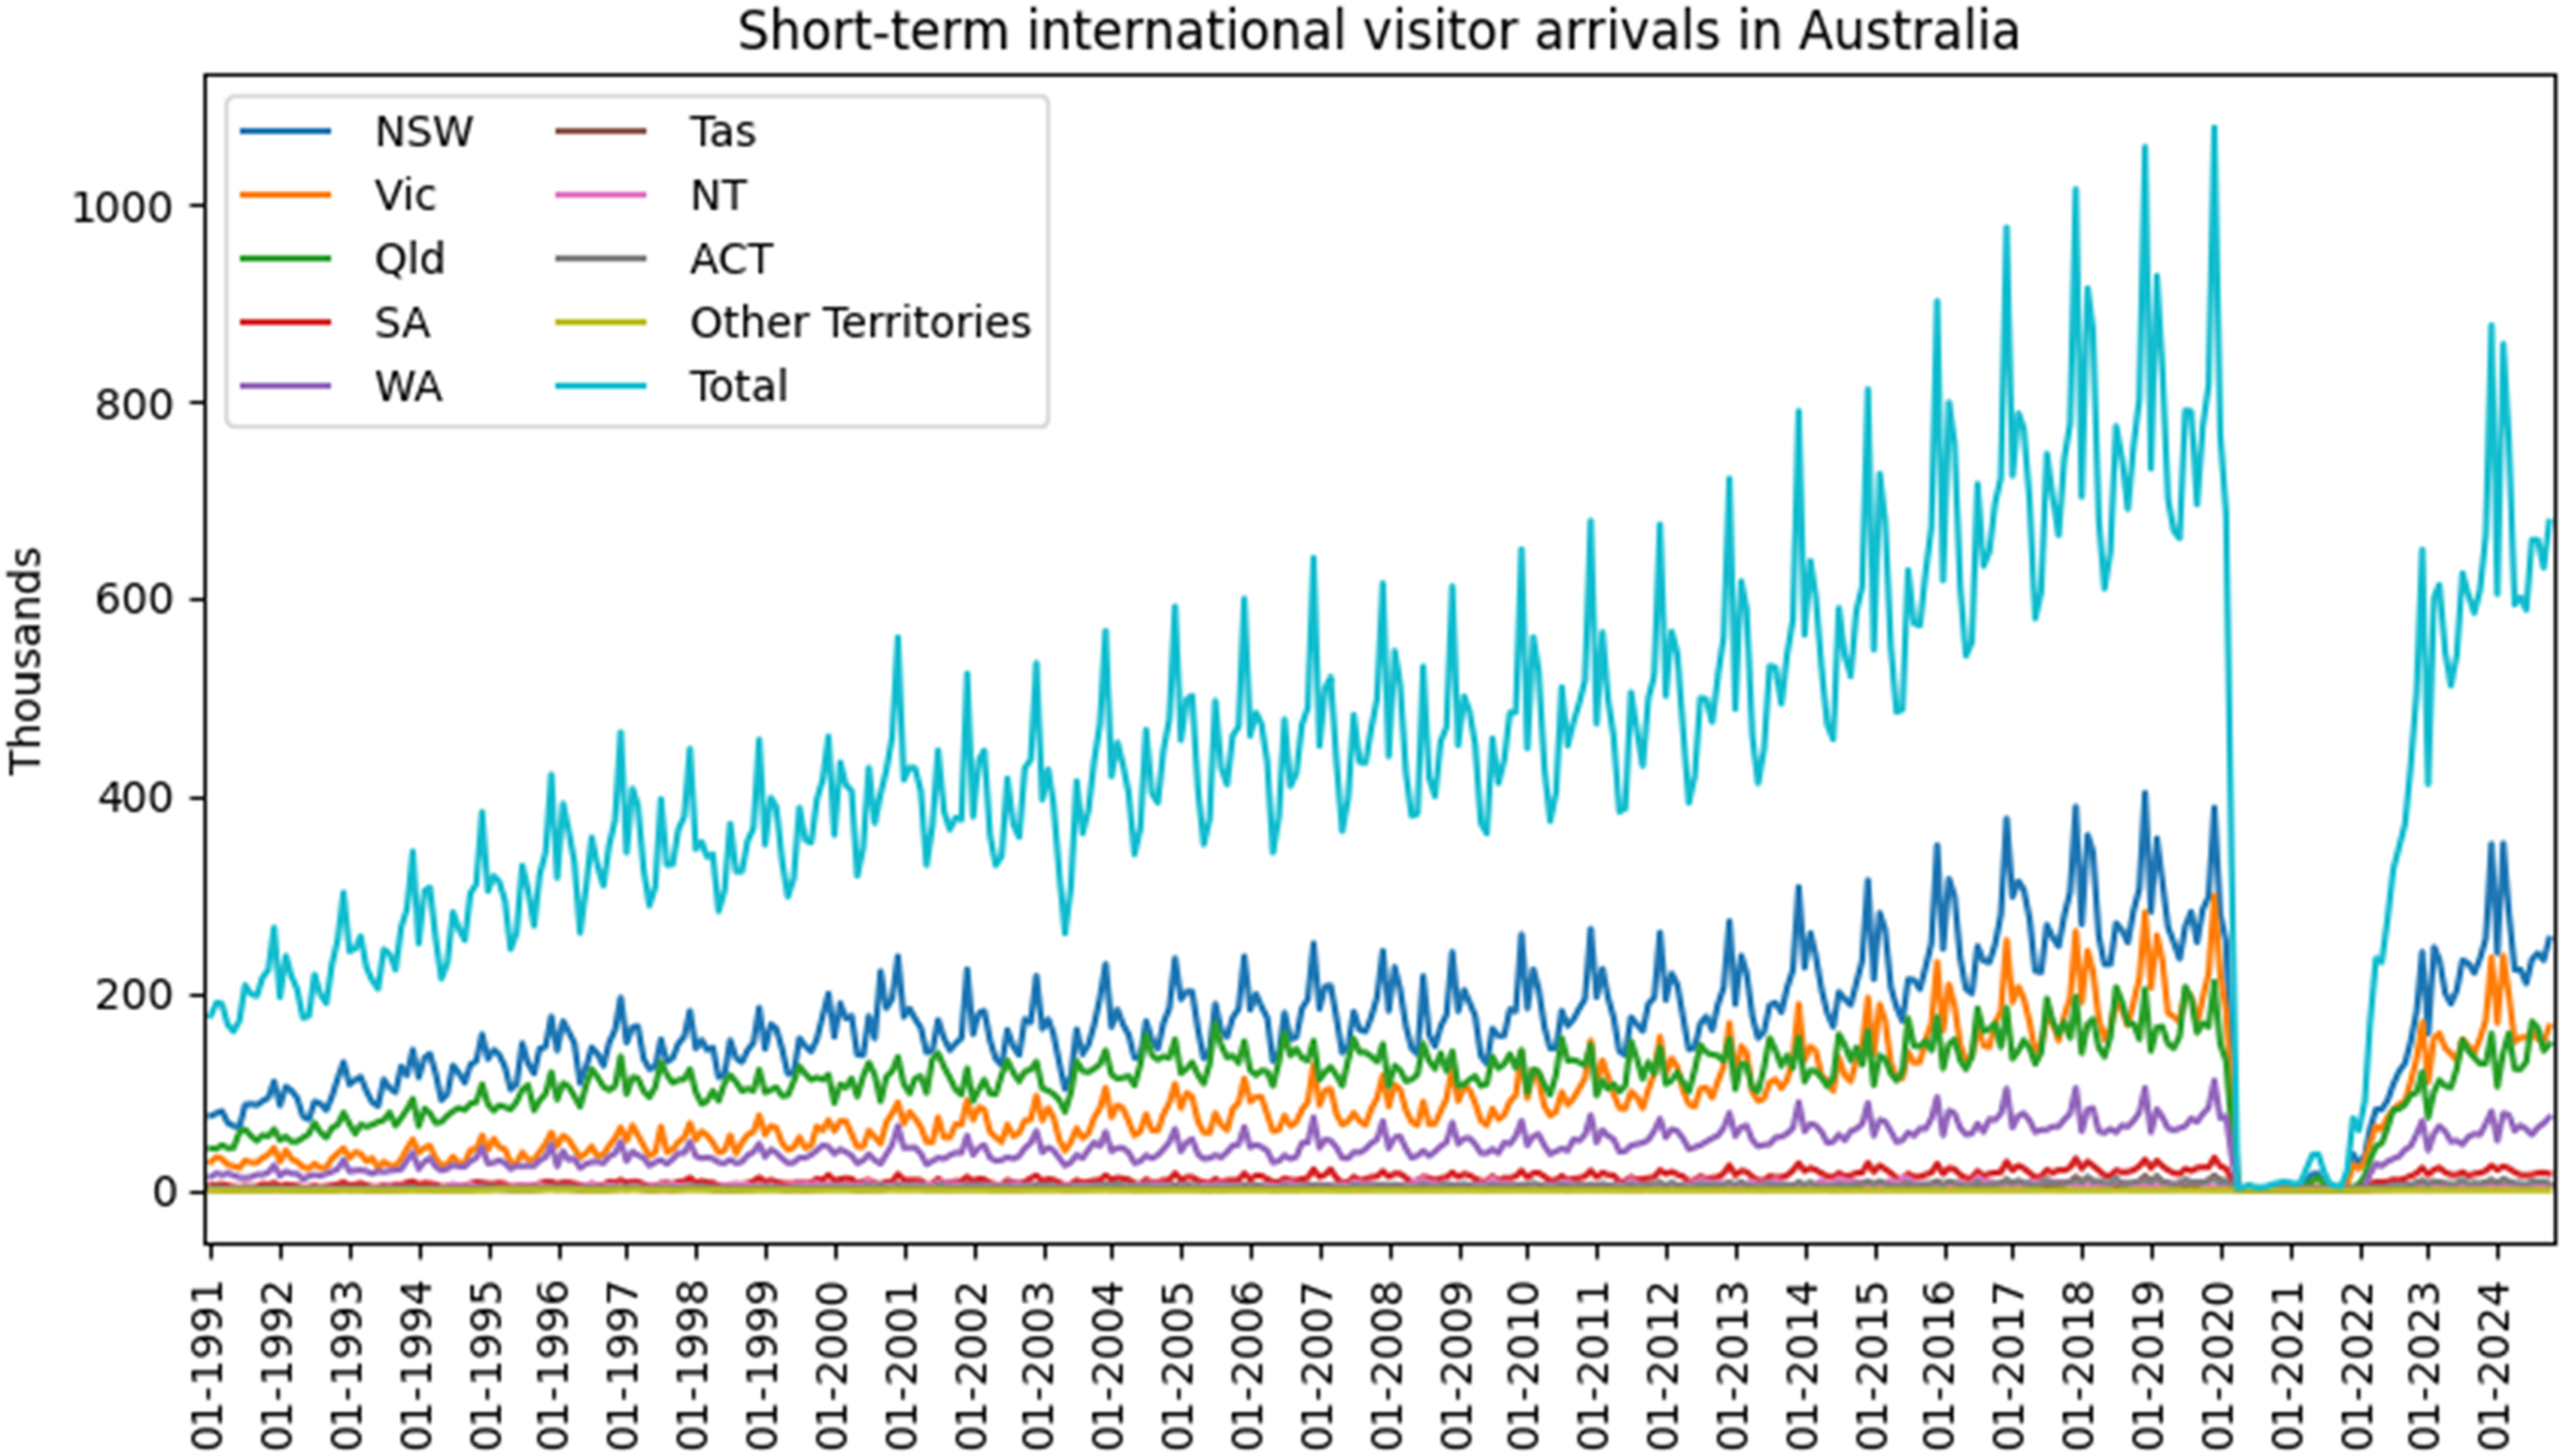
All analyses are conducted using the complete historical datasets, each dataset is divided into sub-series of varying lengths using a sliding-window approach. This approach involves sequentially moving a sub-series of a specific length along the full time series to generate multiple overlapping sub-series. During the validation with forecasting models, each sub-series is split into training and test sets. Forecasting models are trained on the training sets, and forecasts are generated for the test periods. Forecast accuracy is then assessed by calculating the forecasting error over these test sets. The analysis is conducted across three periods: the full period (January 1991 to October 2024), the pre-COVID period (up to February 2020), and the post-COVID period (from February 2020 onward). The monthly time series are also scaled to generate corresponding quarterly (3-month) and half-yearly (6-month) series to define the impact of data characteristics on predictivity. The analysis is conducted with python version 3.1 and numpy version 2.0. Also, the version of statsmodels is 0.13.
Predictivity and Complexity Assessment Using WPE and SampEn (MulSampEn)
This section compares intrinsic predictivity and complexity measured by WPE and SampEn (MulSampEn) across time series of varying lengths and scales (granularity). The assessment is conducted on the time series of the “Total” dataset, with data lengths ranging from 5 to 32 years and temporal scales of monthly, quarterly and half-yearly, separately on the full and the pre-COVID periods. Mean predictivity and entropy values are calculated using a sliding-window approach: for each sub-series, the entropy measures and predictivity metrics are calculated, and the average value is taken across all sub-series of a given length.
Predictivity Assessment With WPE
The complexity of the time series is measured using WPE, with the embedding dimension set to
Figure 4(a) and (b) presents the complexity and predictivity assessed with WPE for the full and pre-COVID time series. As observed for the pre-COVID series, where external shocks are absent, the complexity tends to decrease, and predictivity (WPE) improves with larger scale, being maximized at the largest scale (half-yearly) and the longest series (29 years). However, the impact of COVID disrupts this trend in the full series, leading to an increase in complexity and a decrease in predictivity. This suggests that COVID increases volatility, leading to reduced predictivity, which in turn makes forecasting more challenging to model. The WPE and Predictivity of the Full and Pre-COVID Series by Time Scales: Monthly, Quarterly, and Half-Yearly. The COVID Period Introduces Additional Volatility, Resulting in a Decrease in Predictivity, Which Makes Predictions Less Reliable and More Complex to Model. This Requires Adjustments to Forecasting Models to Account for Structural Breaks and Changing Dynamics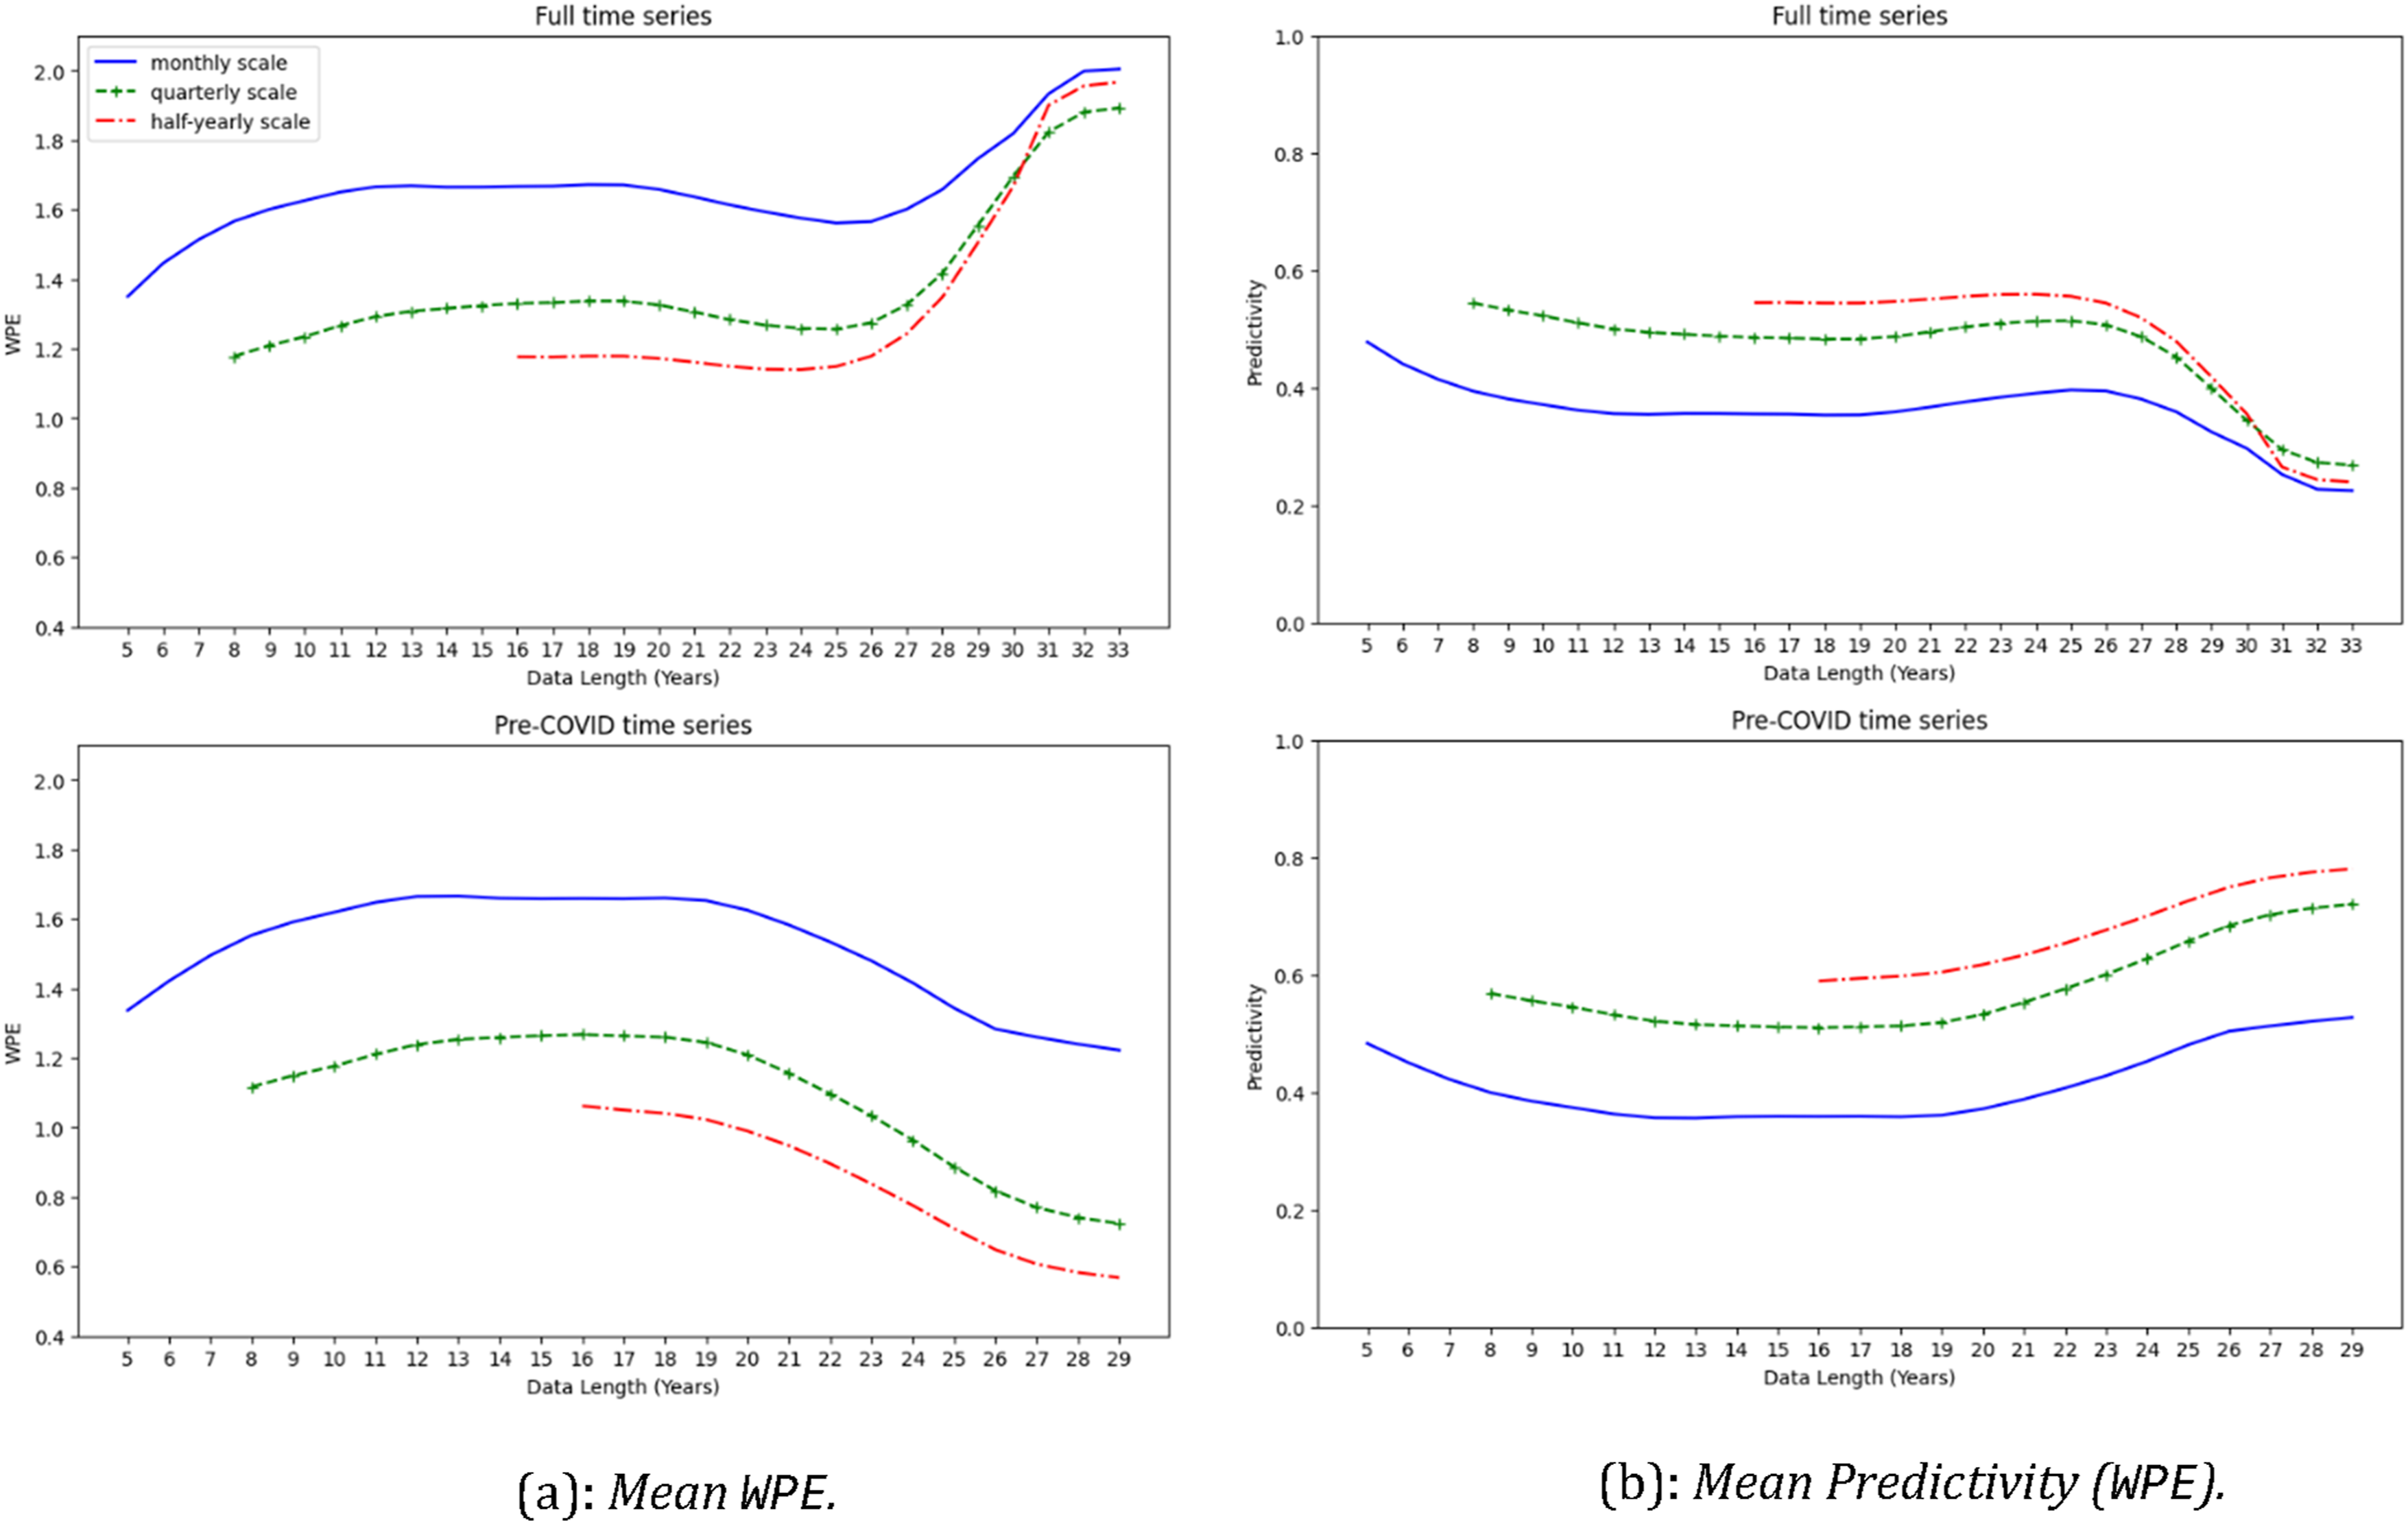
The results indicate that larger data scales can enhance predictivity during stable periods, whereas significant disruptions can alter the underlying structure and predictivity of the data. This demonstrates that WPE effectively captures changes in predictivity caused by external shocks.
Predictivity Assessment With SampEn, MulSampEn, Shannon, and Permutation Entropy
The complexity of the monthly time series is assessed using SampEn, and the quarterly and half-yearly series are assessed using MulSampEn. Similar to SampEn, MulSampEn captures the complexity of the time series data with multiple scaling levels (Zhang et al., 2021a, 2021b). The resulting predictivity metric based on these entropy measures, denoted as
For SampEn and MulSampEn the following parameters are set: the embedding dimension SampEn, MulSampEn Is Unable to Detect Disruptions Like COVID-19 in Tourism Demand Data, Due to a Methodological Limitation Rooted in the Tolerance Parameter r
The limitation of SampEn and MulSampEn highlights the potential of WPE in assessing the intrinsic predictivity of tourism demand data, especially under external shocks.
Similarly, Shannon and Permutation Entropy are evaluated on both the full and pre-COVID time series, based on the corresponding predictivity measures. In this experiment, the embedding dimension is set to Shannon and Permutation Entropy Are Unable to Detect Disruptions Like COVID-19 in Tourism Demand Data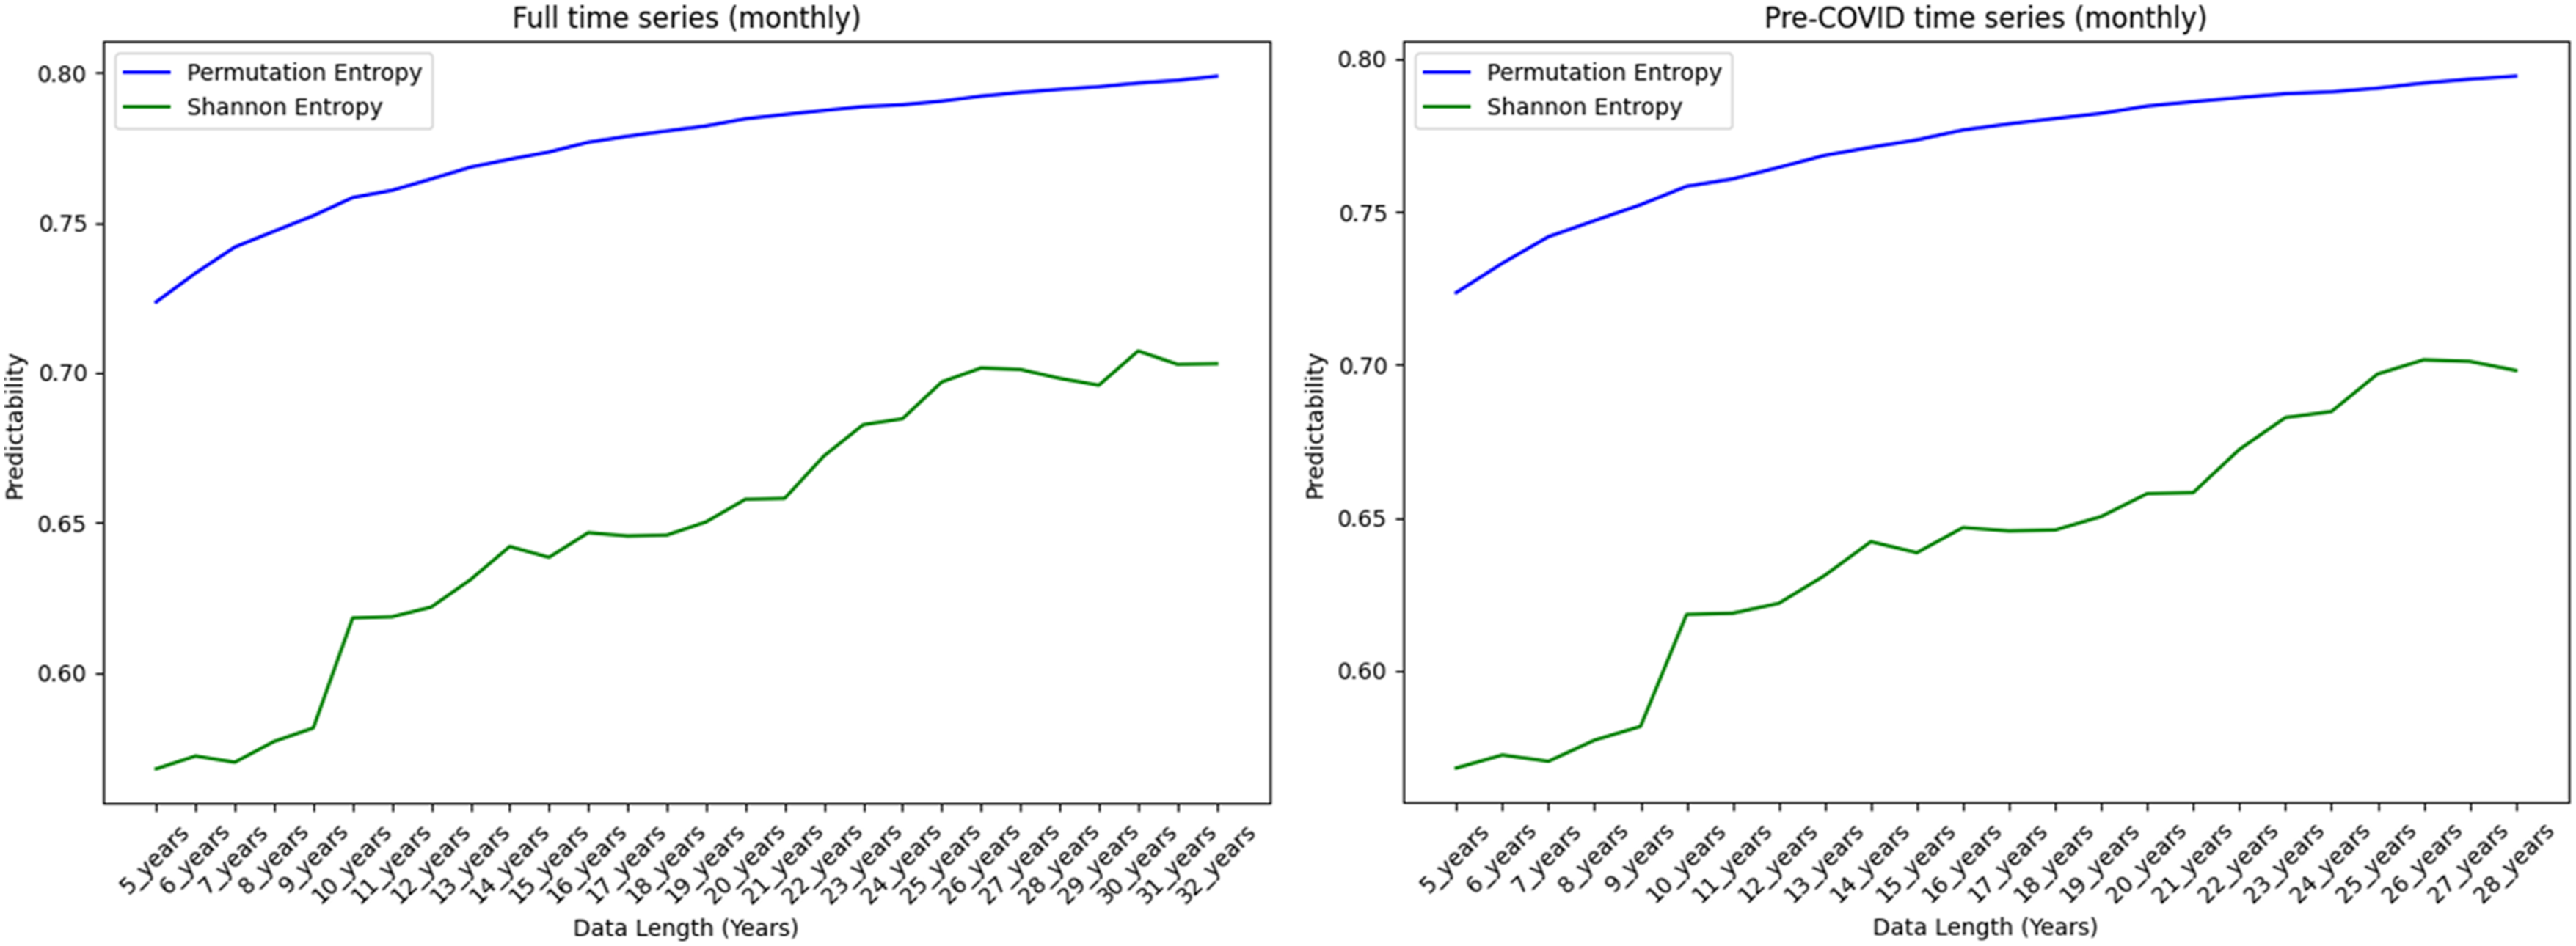
Predictivity Assessment Over External Shock
The COVID-19 pandemic caused global shifts in all industries, including tourism. Understanding how this structural shock affected the predictivity of tourism data is crucial for tourism analysts in developing robust forecasting models that incorporate structural shifts and external disruptions. This section examines how the impact of COVID-19 on predictivity varies across different data lengths. These insights are valuable for practitioners aiming to identify the optimal data length for forecasting models.
As shown in Figure 7, the impact of COVID-19 is evident in the widening gap between the mean predictivity (WPE) of the full and pre-COVID time series. This widening occurs due to the growing proportion of COVID-affected sub-series as the data length increases. Mean Predictivity (WPE) of the Full and Pre-COVID Monthly Time Series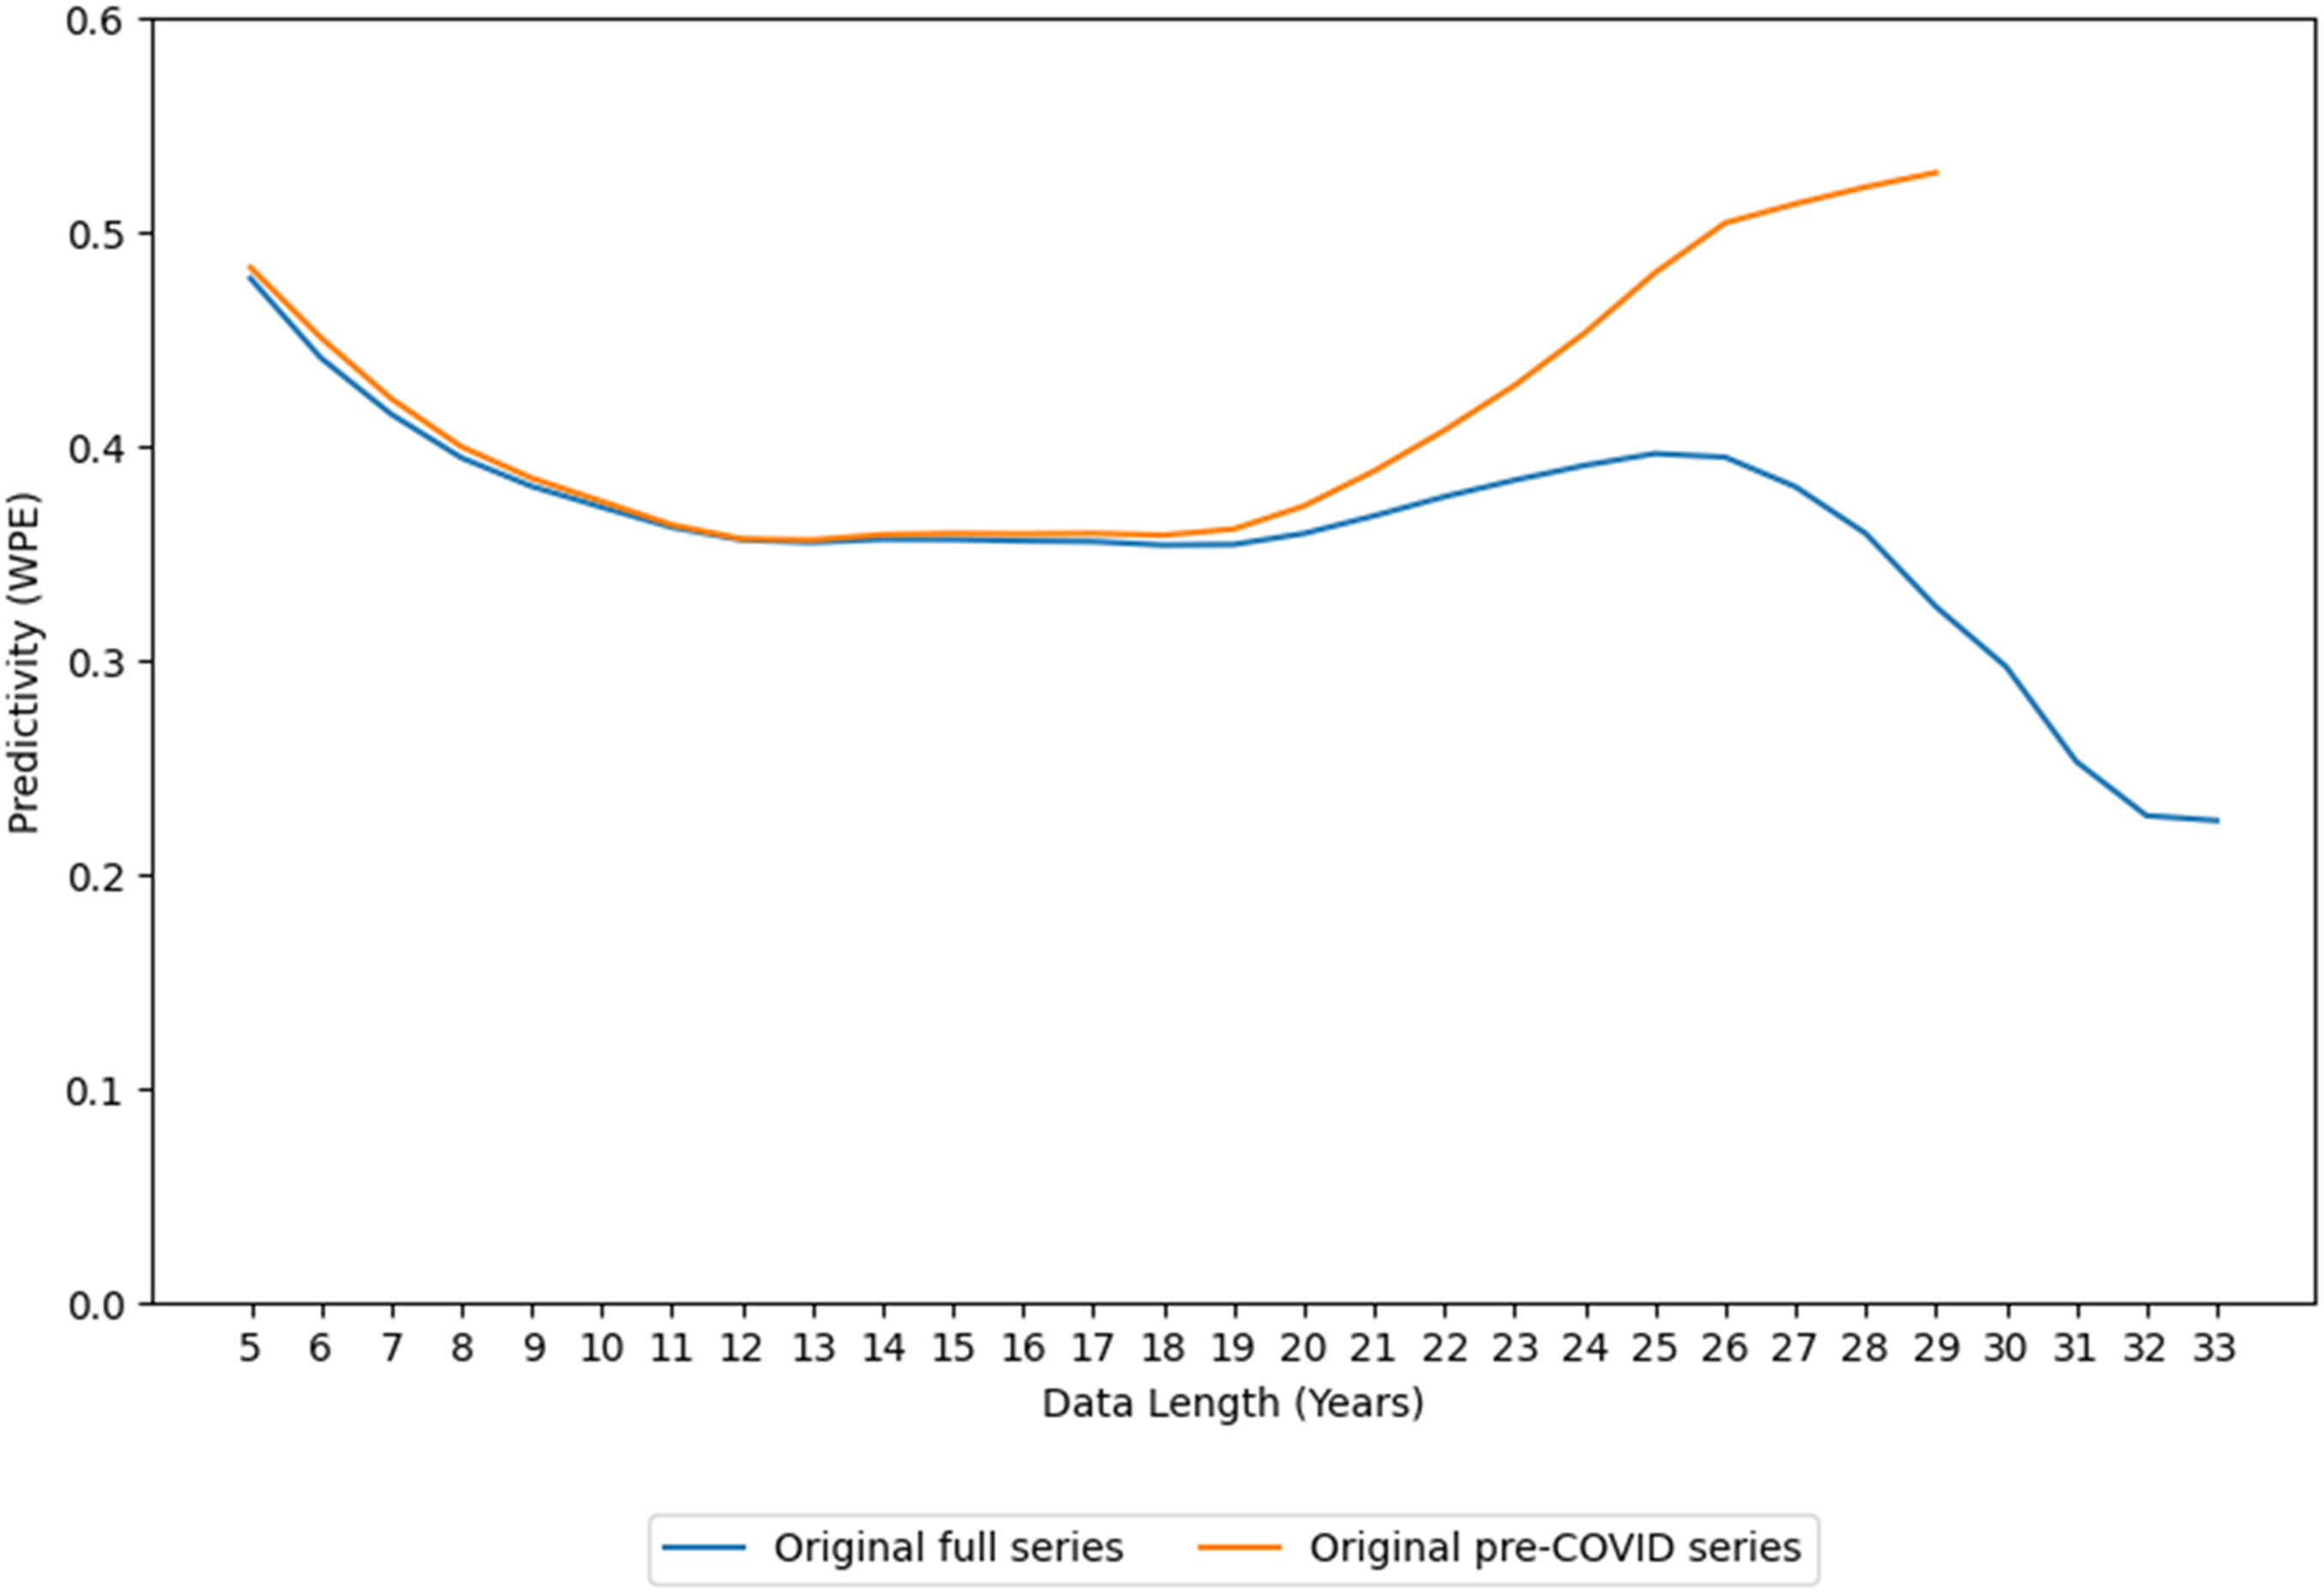
To illustrate this effect, the predictivity distributions are compared for two different data lengths: 144 months (12 years), where the gap is minimal, and 288 months (24 years), where the gap becomes more pronounced.
In Figure 8(a), the predictivity distributions of the full and pre-COVID series are nearly identical for a data length of 144 months (12 years), as the proportion of COVID sub-series is low and has an insignificant impact on the mean predictivity. However, for a data length of 288 months (24 years) in Figure 8(b), the proportion of COVID-affected sub-series with low predictivity, ranging between 0.0 and 0.3, becomes substantial, leading to a decrease in mean predictivity (WPE). It is also observed that some sub-series within the COVID period exhibit higher predictivity values compared to those from the pre-COVID period. To further investigate the effect of COVID-19, the trend of sub-series predictivity for the two data lengths is illustrated in Figure 9(a) and (b). The Predictivity Distribution of the Pre-COVID Series Becomes Narrower With Increasing Series Length, as More Recurring Patterns Are Captured. Therefore, Longer Time Series Can Enhance the Reliability of Forecasting Models in the Absence of External Shocks. In Contrast, the COVID-Affected Sub-series Cause a Broader Distribution in Longer Series, Reflecting Increased Volatility and Reduced Pattern Consistency The Predictivity (WPE) Trend of Sub-series With Lengths of 144 Months (12 Years) and 288 Months (24 Years) for the Full Series. The Effect of COVID-19 on the Predictivity Is Evident With the First Sub-series Including the Initial Month Affected by the Pandemic. As the Pandemic Disrupted the Cyclical Pattern of the Time Series, the Assessment of Predictivity (WPE) on the COVID-Affected Periods Must Be Conducted With an Adjusted Delay Parameter 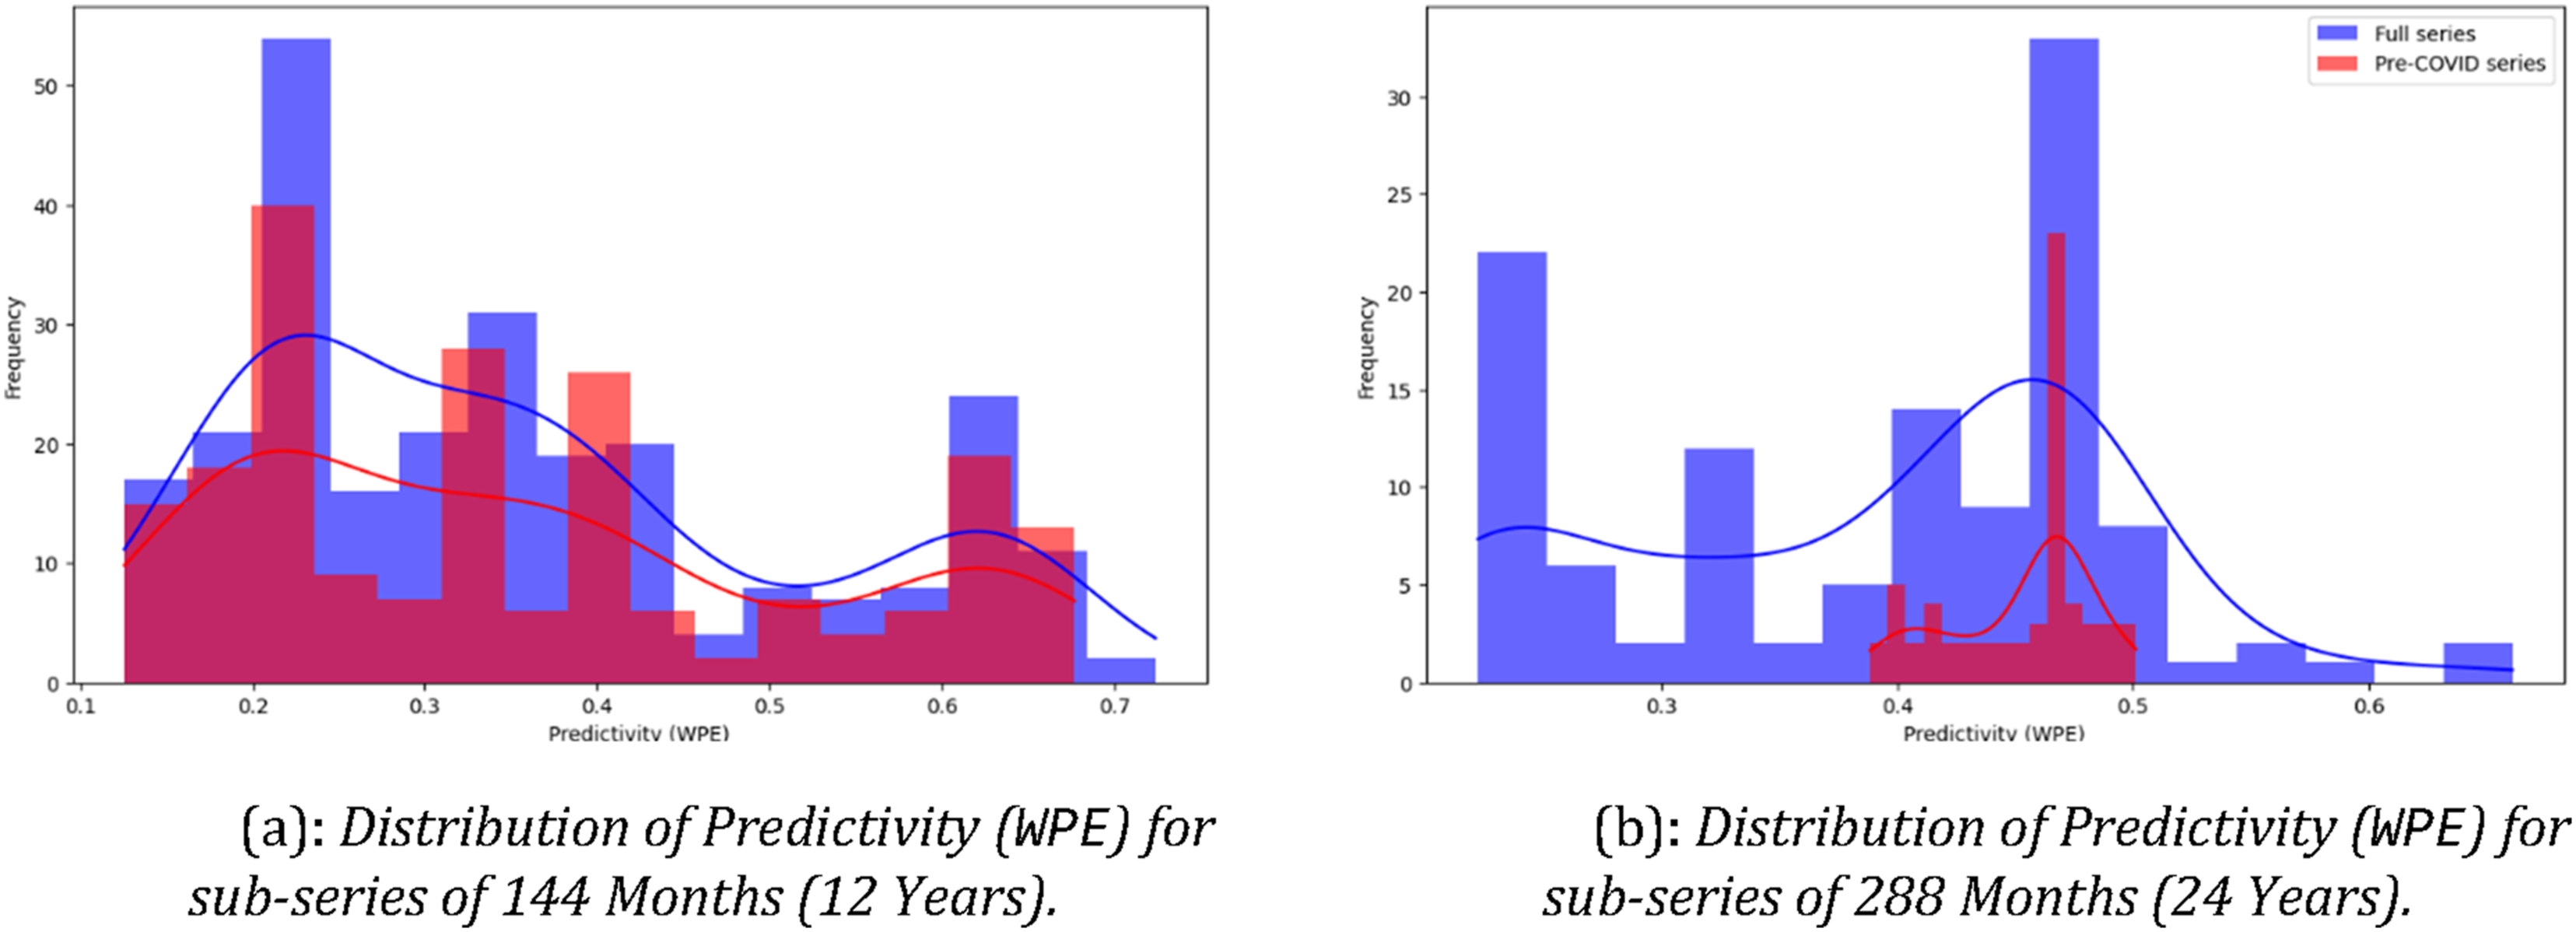

The red dot in Figure 9(a) and (b) represents the predictivity of the last pre-COVID sub-series. The effect of COVID-19 is observed within the length of the oscillation period, or the delay parameter (
As Figure 9(a) and (b) demonstrates, during the pre-COVID period, the volatility in predictivity of the shorter series (12 years) is considerably higher compared to the longer series (24 years). As the data length increases, the range of the predictivity (WPE) distribution of the pre-COVID series narrows, indicating that longer time series better capture the underlying structure and repeating patterns. The longer 24-year series also better illustrate the extent of COVID-19’s impact on predictivity: while the pre-COVID predictivity was around 0.4, the stabilized post-COVID predictivity levels, observed in sub-series with an index of 100 or higher, drop to approximately 0.2. Therefore, for cyclical data like tourism demand, longer time series offer more stable predictivity assessments than shorter ones. This suggests that tourism forecasters can benefit from using longer historical data, as it helps capture stable and repeatable trends, leading to more reliable predictions.
The Validation of the Predictivity Metric
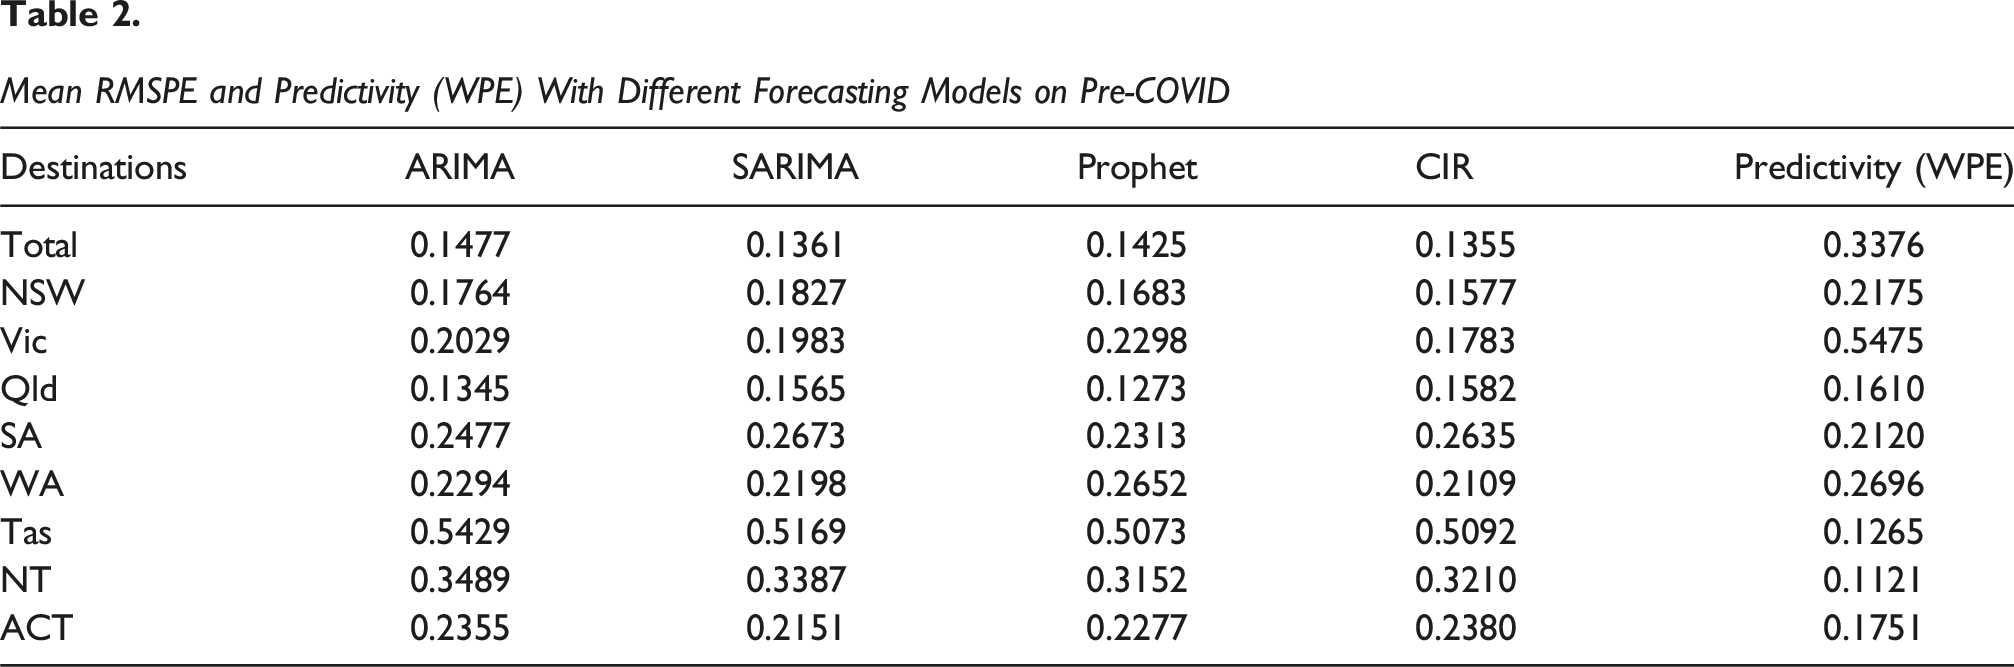
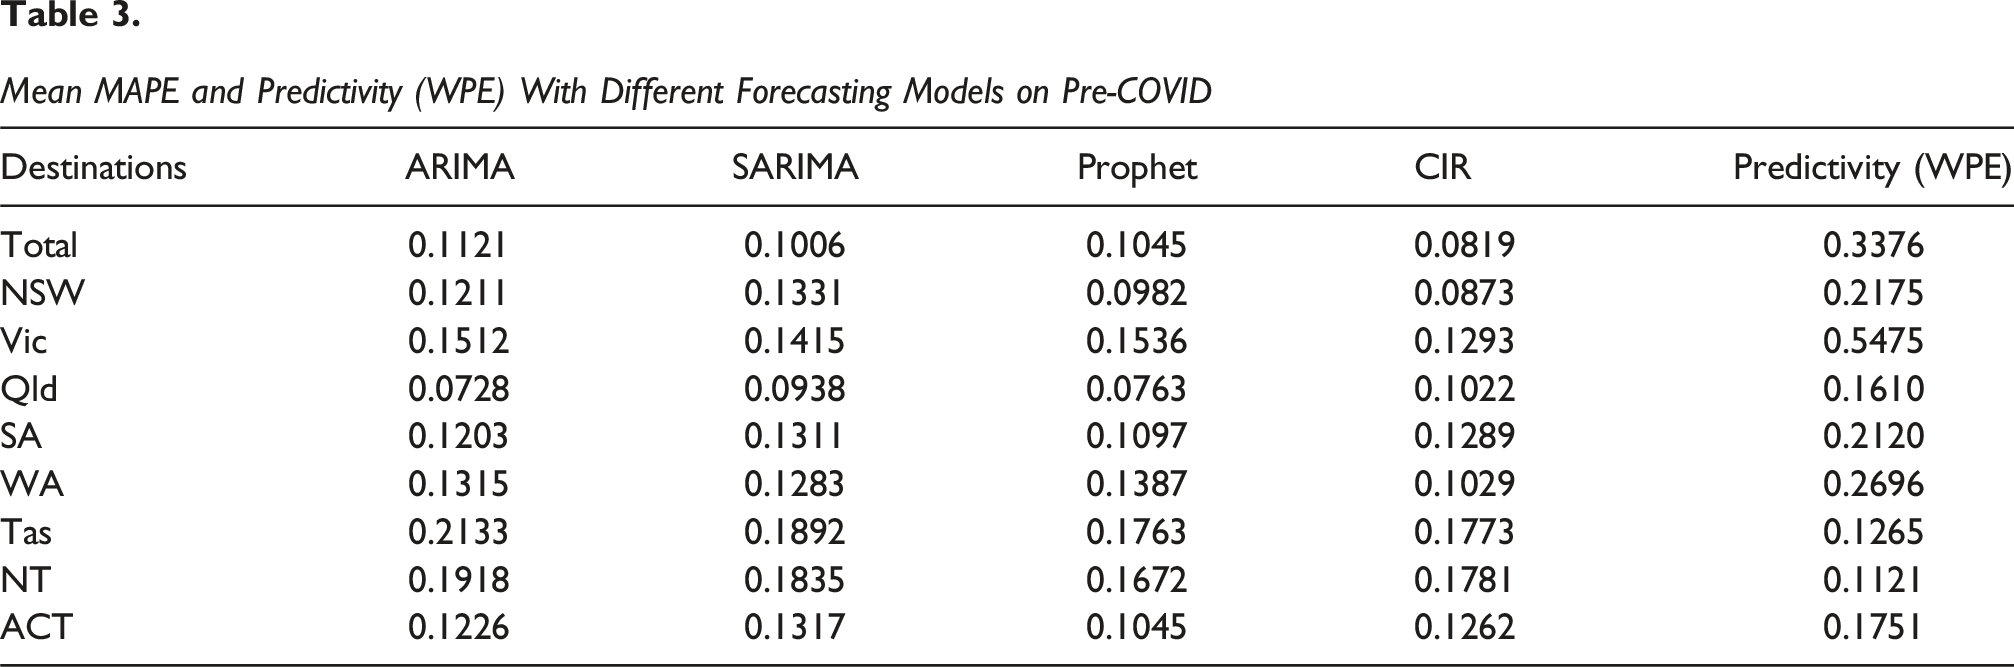
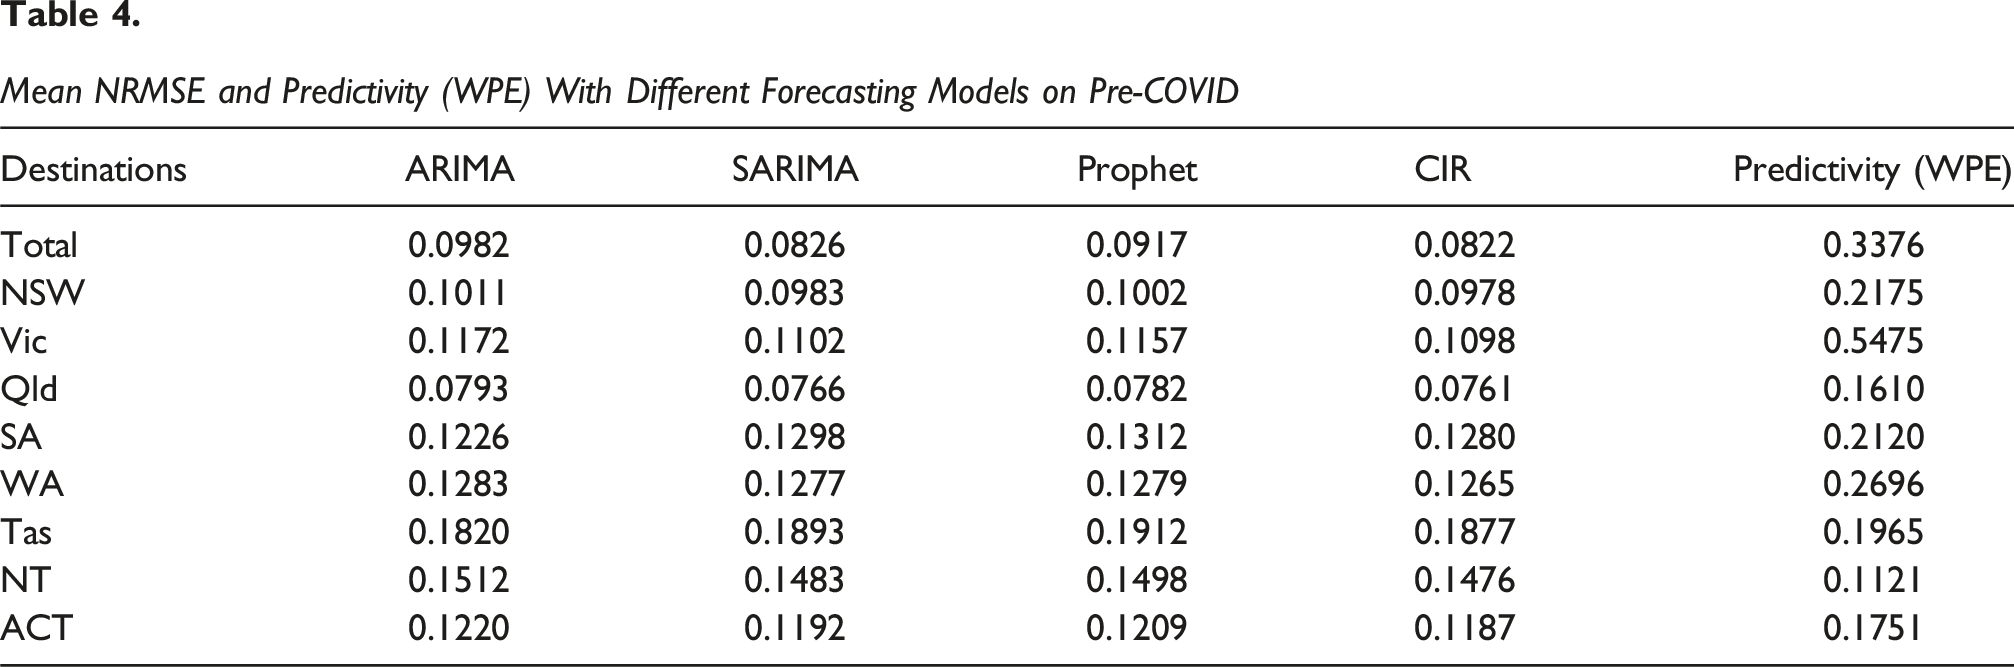
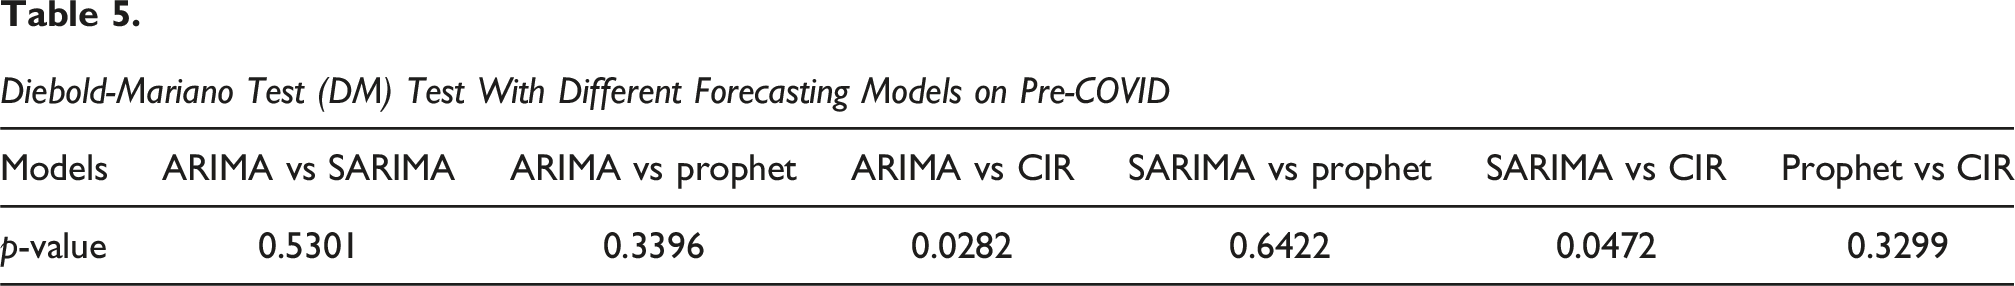
This section validates and compares forecasting performance across different models to identify which approach most effectively reflects the intrinsic predictability of the time series. Following Zhang et al. (2021a, 2021b), three forecasting models are applied to 12 years of tourism demand data, and predictivity is evaluated using Weighted Permutation Entropy (WPE).
Mean RMSPE and Predictivity (WPE) With Different Forecasting Models on Pre-COVID
Mean MAPE and Predictivity (WPE) With Different Forecasting Models on Pre-COVID
Mean NRMSE and Predictivity (WPE) With Different Forecasting Models on Pre-COVID
Diebold-Mariano Test (DM) Test With Different Forecasting Models on Pre-COVID
Mean RMSPE, MAPE, NRMSE,

Correlation Results Between Forecasting Results and Predictivity (WPE), and Between Forecasting Results and

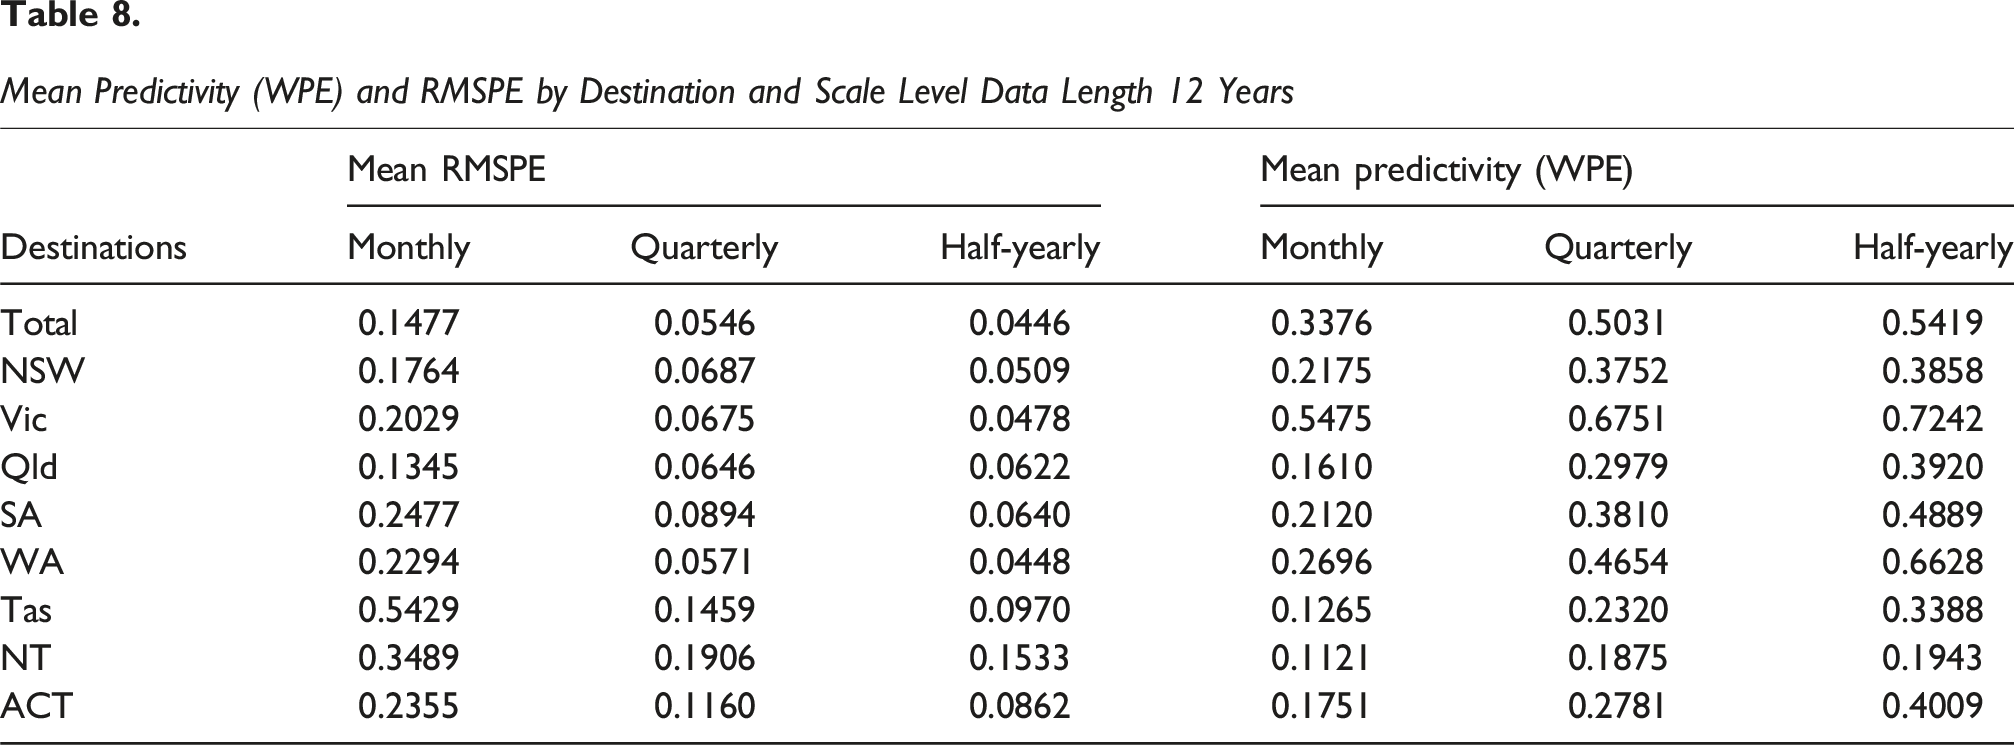
Predictivity Validation Over Varied Data Scale
Mean Predictivity (WPE) and RMSPE by Destination and Scale Level Data Length 12 Years
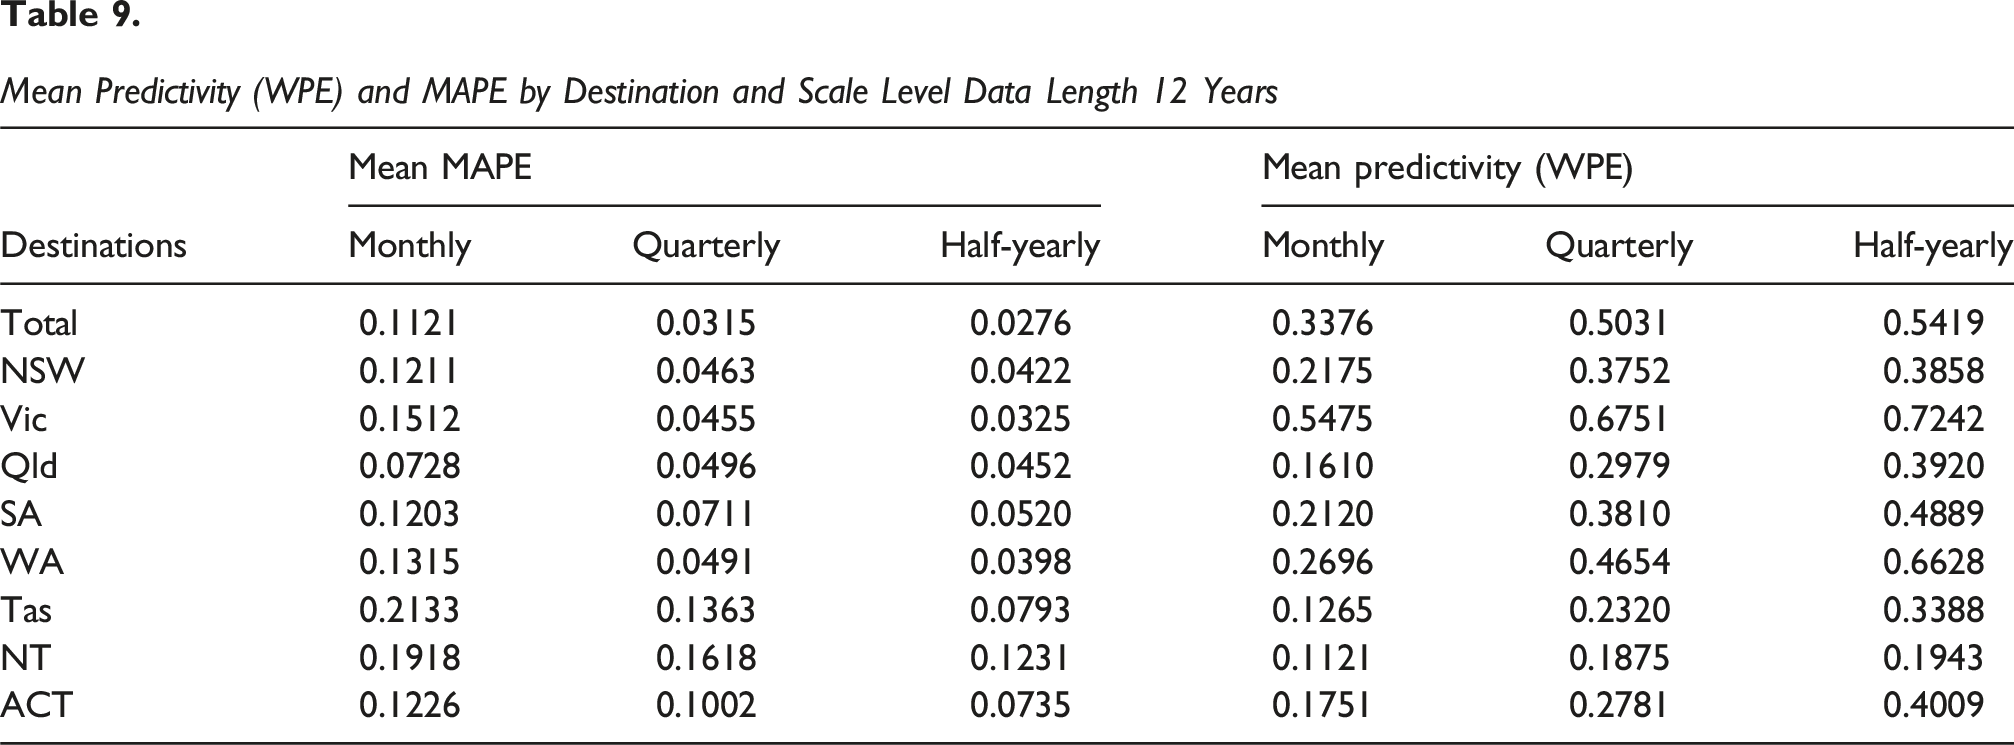
Mean Predictivity (WPE) and MAPE by Destination and Scale Level Data Length 12 Years
Mean Predictivity (WPE) and NRMSE by Destination and Scale Level Data Length 12 Years

Correlation Results Between Predictivity (WPE) and Error Metrics Across Different Data Scales for Pre-COVID Time Series of 12 and 24 Years in Length

Predictivity Validation Over External Shock
In this section, the predictivity metric is evaluated using COVID-affected time series. To account for the structural shift introduced by the pandemic, ARIMAX and CIR models are applied alongside ARIMA. ARIMAX extends the standard ARIMA framework by incorporating an exogenous dummy variable representing the COVID-19 period, allowing the model to adjust for external shocks and improve forecast robustness under regime changes. Similarly, the CIR model has been reported as resilient to disruptive events (Bufalo & Orlando, 2023b) and is therefore included as a comparative benchmark to assess predictivity under external shocks. Also in this section, the RMSPE is the error metric used here.
Given the diverse impact of COVID-19 across Australian states, the “Total” level is selected to evaluate the overall effect of the pandemic on the predictivity. To ensure an accurate assessment, the delay parameter
Figure 10(a) and (b) illustrates the trend in predictivity metrics and RMSPE across 45 sub-series of length 288 months (24 years) with ARIMAX model. The first sub-series spans from March 1996 to February 2020, with the latter marking the beginning of the COVID-affected period. The results show that forecast performance, indicated by a decrease in RMSPE, improves in parallel with increases in predictivity (WPE). In contrast, RMSPE (Red Line) and Predictivity Metrics (Blue Line), for 45 Monthly Sub-series of the “Total” Dataset, Each Length of 24 Years. The Plot Demonstrates That the Model’s Adjustment to the COVID-19 Impact Corresponds With an Initial Increase in the Predictivity (WPE), Followed by Stabilization in Both Predictivity and Forecasting Performance. This Pattern Suggests That, After a Short-Term Adaptation Period, the Forecasting Model Becomes More Resilient to Pandemic-Related Volatility. Such Insights Can Be Utilized to Inform the Selection of Training Windows That Account for External Shocks, Enhancing Model Robustness and Accuracy During Periods of Structural Change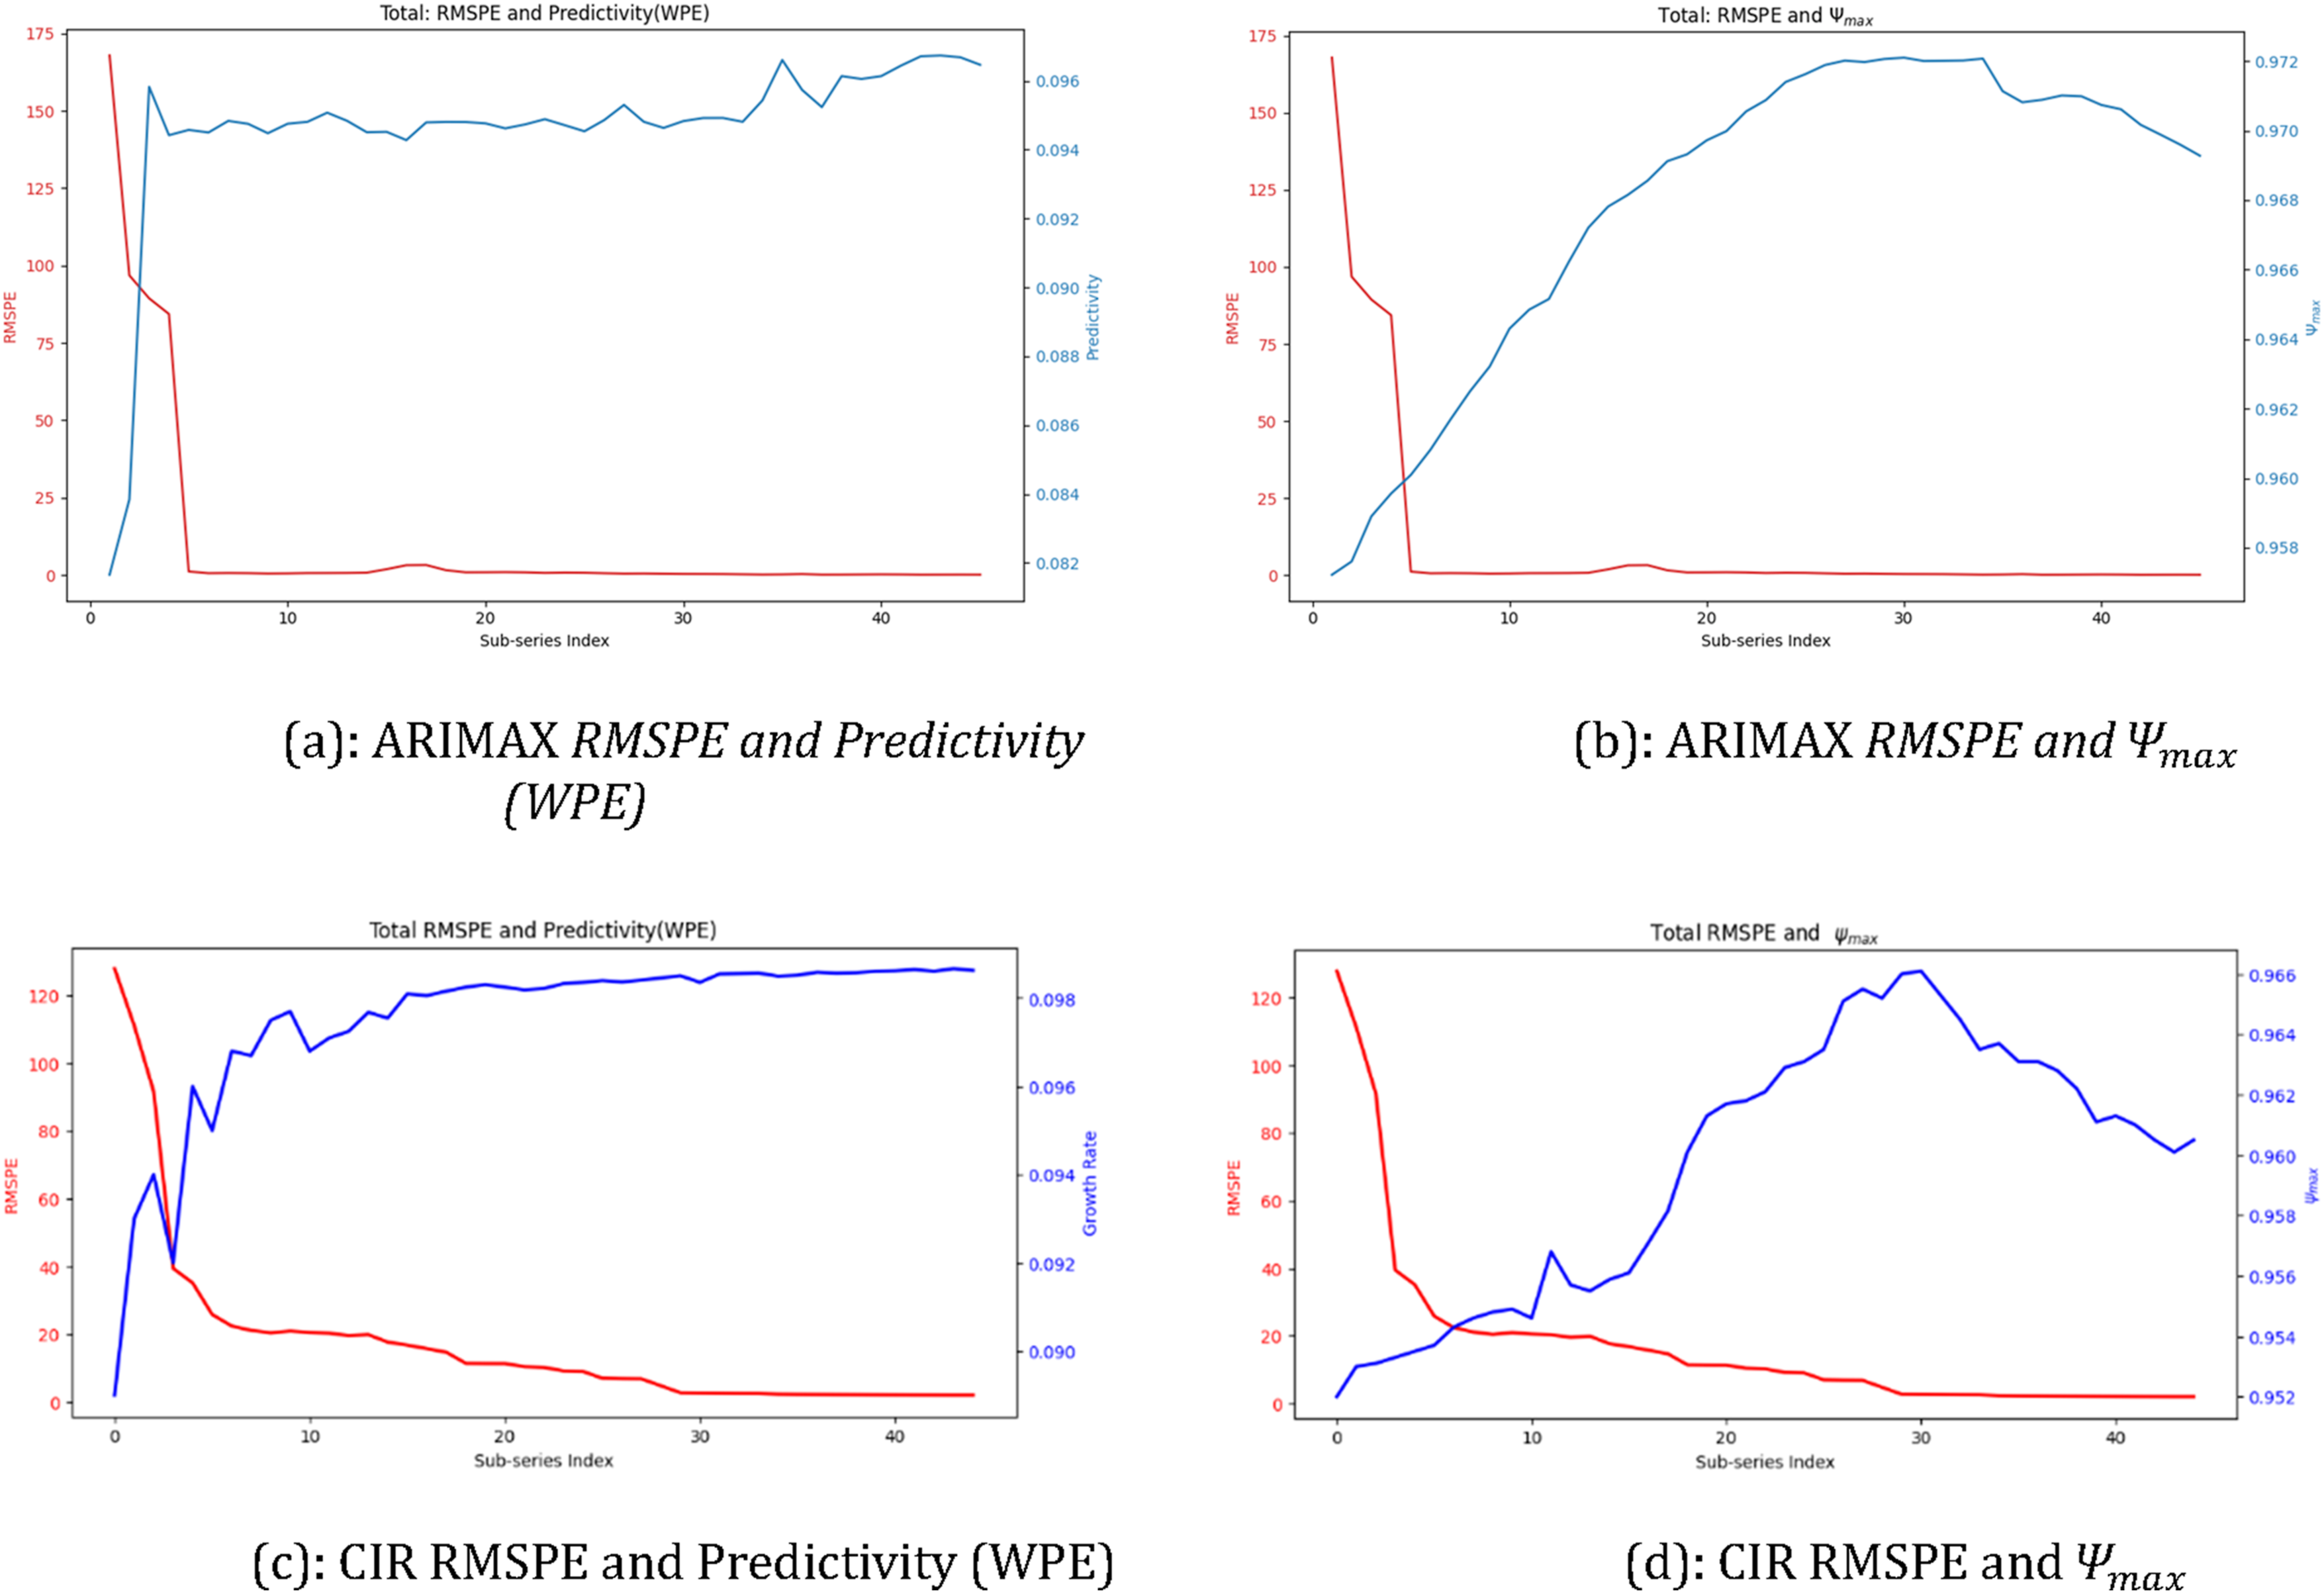
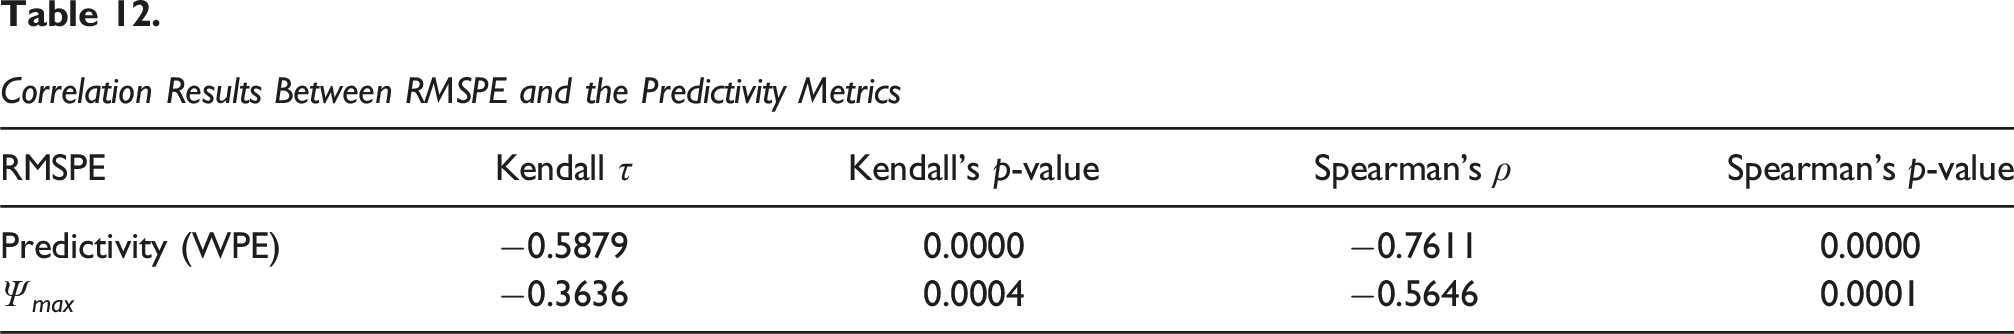
Correlation Results Between RMSPE and the Predictivity Metrics
Discussion and Implications
The empirical findings of this study offer profound insights into the assessment of tourism demand predictivity, particularly under volatile conditions induced by external shocks. This work demonstrates the effectiveness of WPE in capturing the intrinsic predictivity of tourism demand data and validates its superior robustness compared to SampEn (MulSampEn).
Theoretical Implications
This research significantly advances the theoretical understanding of time series predictivity, especially within complex, non-stationary systems like tourism demand. From a theoretical standpoint, this study contributes to the broader literature on time series predictivity by proposing WPE as a more robust alternative for estimating the intrinsic predictivity of tourism demand data. This advancement is significant because it challenges the existing approach, where entropy measures are applied without sufficient consideration of their limitations.
By exposing a key flaw in SampEn (MulSampEn), its reliance on the tolerance parameter (
The research contributes to theoretical development by showing how intrinsic predictivity varies with data length and temporal scale. Theoretical frameworks in Information Theory and Dynamical Systems Theory assume that predictivity is tightly linked to structural order (Boffetta et al., 2002). This study confirms that predictivity tends to stabilize and improve with longer time series and coarser aggregation (e.g., quarterly or half-yearly), thereby implying that longer and coarser data enhance the underlying structural order.
The study shows that the effectiveness of entropy measures depends on the system’s context, thereby deepening our understanding of their appropriate application and reinforcing their theoretical importance as means for assessing intrinsic predictivity. This contributes to the theoretical role of entropy measures not only as a descriptor of complexity but also as a predictor of forecasting potential, making them much more useful for real-world planning and decision-making in complex environments.
Practical Implications
The practical implications of this study are particularly relevant for tourism analysts, policy-makers, and business strategists who rely on accurate and resilient forecasting to support planning, investment, and operational decisions. One of the most persistent challenges in tourism demand forecasting lies in determining the appropriate data length and temporal scale for model input (Zhang et al., 2021a, 2021b), a decision that significantly affects predictive performance.
The study’s findings provide concrete guidance on this issue. By empirically demonstrating that longer time series and coarser temporal scales (e.g., quarterly or half-yearly) yield higher intrinsic predictivity, the results suggest that practitioners can improve forecast accuracy by aggregating the data to a coarser scale. In practice, this insight helps streamline the forecasting pipeline by enabling more informed decisions about how to prepare input data to maximize predictive potential.
In volatile environments, such as during a global pandemic, the study demonstrates that WPE responds effectively to structural breaks. By adjusting WPE parameters, particularly the delay parameter, to reflect shifts in the data’s underlying structure, practitioners can better capture the changes in the intrinsic predictivity. This is especially critical in real-world forecasting contexts, where abrupt changes in travel restrictions, health policies, or geopolitical events can drastically alter tourism demand patterns.
The validation of WPE-based predictivity metric against realized predictivity (RMSPE) confirms its effectiveness. Unlike SampEn (MulSampEn), which may misleadingly indicate high predictivity during volatile periods, WPE provides a more truthful reflection of forecasting difficulty. This capability is invaluable for risk management and model selection. Forecasting models that are guided by WPE-based predictivity assessments are more likely to deliver robust performance, especially in high-uncertainty scenarios. Additionally, WPE’s computational efficiency and relatively simple parameter tuning, compared to other entropy measures, facilitate easier adoption by the industry practitioners.
Overall, this research introduces a superior metric for assessing the intrinsic predictivity of tourism demand. By integrating a theoretically grounded and empirically validated metric, this study not only advances the understanding of tourism demand predictivity but also equips practitioners with a more adaptive and robust tool for navigating uncertainty in a rapidly evolving global landscape.
Conclusion
Forecasting tourism demand plays a pivotal role in guiding strategic planning, resource allocation, and risk mitigation for governments and tourism-related businesses (Li et al., 2023). However, the volatility and complexity of tourism data, especially during external shocks like the COVID-19 pandemic, make it difficult to assess the theoretical limits of forecasting accuracy. Accurately quantifying intrinsic predictivity is therefore essential to improve the reliability of forecasting models under both stable and disrupted conditions.
This research was motivated by the limitations of existing entropy measures, particularly SampEn and MulSampEn. There was a clear need for a more robust, interpretable, and sensitive metric capable of accurately assessing the intrinsic predictivity of tourism demand data, especially under conditions of volatility and sudden change.
The key contribution of this study is the introduction of a WPE-based predictivity metric for quantifying the intrinsic predictivity of tourism demand with greater reliability. Empirical results demonstrate that the proposed metric is more sensitive to structural changes and more strongly correlated with the realized predictivity compared to the predictivity metric based on SampEn (MulSampEn). The study also reveals the impact of data characteristics, specifically verifying that coarsely scaled data increases predictive potential. These findings validate the effectiveness of WPE as a robust entropy measure for assessing the intrinsic predictivity of tourism demand data.
Despite these contributions, this study has several limitations: 1. The analysis is restricted to the COVID-19 pandemic as a representative external shock. While this event provides a relevant and impactful case study, broader generalizations to other types of disruptions require further investigation to assess the robustness of the proposed metric. 2. The empirical analysis is based solely on tourism demand data from a single country (Australia). Although Australia’s state level tourism demand presents a diverse context, the geographic specificity may limit the generalizability of the findings. 3. The forecasting component focuses on univariate time series, potentially overlooking multivariate dependencies. Therefore, the maximum achievable forecasting accuracy may not have been achieved, and the relationship between intrinsic and realized predictivity may remain partially unverified.
Therefore, future research could extend the analysis to other types of disruptions to assess the generalizability of the predictivity metric (WPE) in capturing structural volatility beyond the COVID-19 context. As well as its broader application to a wider range of tourism-related time series beyond international tourist arrivals. Expanding the study to include tourism demand data from multiple countries would enhance the external validity of the findings and uncover potential regional differences in predictivity behavior. Incorporating forecasting models such as CIR# could offer a more complete understanding of the link between intrinsic and realized predictivity.
Footnotes
Ethical Considerations
This article does not contain any studies with human or animal participants.
Author Contributions
•
•
•
•
•
Funding
The authors disclosed receipt of the following financial support for the research, authorship, and/or publication of this article: This project was partly supported by a research grant funded by the Deakin University.
Declaration of Conflicting Interests
The authors declared no potential conflicts of interest with respect to the research, authorship, and/or publication of this article.