
Abstract
The present study had two primary aims. First, we examined the role of perceived local environmental conditions in the production of subjective well-being. Second, we tested the validity of a city quality-of-life indicators model in a global context. To address these aims, we analyzed data from the 2019 Gallup World Poll, which included 162,740 respondents from 137 countries and provided subjective indicators of urban conditions across a broad international sample. Guided by the concept of personal utility, the model proposed that residents’ perceived quality of life in the city would be positively associated with satisfaction with the city’s conditions and services, including infrastructure, social services, and the physical, economic, and social environment. The model further proposed that perceived city quality of life would mediate the associations between satisfaction with these conditions and services and subjective well-being, indexed by life satisfaction and affective well-being. This mediating process was interpreted through the lens of bottom-up spillover theory. Results from multilevel modeling supported these hypotheses. In particular, satisfaction with local economic, social, and environmental conditions emerged as a coherent domain that was associated with subjective well-being through perceived city quality of life. We discuss the policy implications of these findings, along with the study’s limitations and directions for future research.
Introduction
Many public policymakers interested in urban and community development have broadened the concept of economic development to socio-economic development (Wiseman & Brasher, 2008). That is, inspired by the seminal work by Stiglitz et al. (2009), which emphasized the need to measure individuals’ actual living conditions, progress, and quality of life in broad terms, various social indicators have been used to complement narrowly defined economic indicators such as GDP. In doing so, they use both subjective and objective social indicators of community well-being to assess the quality of life in each community (e.g., Jones, 2024; Kim & Jeong, 2024; Yamaguchi & Oshima, 2024). In that vein, quality-of-life researchers have addressed many related issues concerning community quality of life (e.g., see Sirgy, 2022, for a literature review).
More recently, the geography of happiness perspective has attracted considerable attention from scholars, partly because it helps capture well-being at the local level, which cannot be fully explained by national-level indicators (e.g., the OECD Better Life Index; Burger et al., 2026). For example, Kourtit et al. (2024) introduced the concept of neighborhood love, a place-specific sense of well-being that can be affected by a set of physical and immaterial conditions of one’s neighborhood.
Research has shown that judgments of life satisfaction are influenced by judgments of satisfaction in specific life domains (e.g., Andrews & Withey, 1976; Bowling, 1995; Campbell et al., 1976; Cummins, 1996; Rogerson et al., 1996; Van Praag & Ferrer-i-Carbonell, 2010). In other words, people tend to segment their life experiences into specific spheres or domains. Well-being researchers have identified myriad life domains that are thought to be relevant to overall life satisfaction. Examples of these life domains include health and safety, family life, standard of living, social relationships, leisure life, work life, love life, residential life, self-worth, and educational life. As such, affect-related life experiences in those life domains are captured through judgments of what well-being researchers call “domain satisfaction.” As such, the research reported here seeks to demonstrate the role of perceived local environmental conditions in the well-being production function. Using global data, we will empirically demonstrate that satisfaction with local economic, social, and environmental conditions constitutes a coherent domain that influences subjective well-being through a mediating channel of perception (i.e., perceived city quality of life).
The purpose of this paper is not to compare city-level differences in terms of residents’ subjective well-being. Rather, the focus of this study is to empirically demonstrate the role of residents’ perceived city quality of life and to validate a city quality-of-life indicators model aligned with the OECD’s multidimensional well-being approach, which is universally applicable to individual countries. It is worth noting that OECD’s regional well-being indicator is based on its national level indicator (the Better Life Index) and they share 11 out of 12 dimensions (income, jobs, housing, health status, education and skills, environmental quality, personal security, civic engagement and governance, social connections, and subjective well-being) with slight modifications to the original measurements (OECD, 2025). Therefore, the national-level city quality-of-life indicators model we are developing in this study can be refined into a regional-level model for further specification.
In sum, our study has two goals. The first goal is to demonstrate the role of perceived local environmental conditions in the well-being production function. Using global data, we will make an attempt to empirically demonstrate that satisfaction with local economic, social, and environmental conditions constitutes a coherent domain that influences subjective well-being through a mediating channel of perception (i.e., perceived city quality of life). The second goal is to demonstrate the validity of a city quality-of-life indicators model in a global context. We will test this model using a social survey that includes the same set of subjective indicators across multiple communities in an international context, namely the Gallup World Poll.
We begin by reviewing major conceptualizations of city quality of life that use subjective indicators. We then describe research on the role of city quality of life in subjective indicators of personal well-being, as well as on predictors of city quality of life. We then make the case for our theoretical model and its contribution to developing a worldwide model of city well-being, and then test the model’s validity using survey data from the 2019 Gallup World Poll (N = 162,740 respondents across 137 countries). Policy implications are also discussed with study limitations and suggestions for future research.
Background
There are several major conceptualizations of community quality of life evidenced in the research literature (Sirgy, 2011, 2022). These include personal utility (e.g., Atkinson et al., 2020; R. Widgery, 2004), opulence (e.g., Lukkarinen, 2005; Schuster & Ciurczak, 2018; Simon, 2001), a just society (e.g., Browne et al., 2022; Moreno Minguez, 2009; Warner, 2009), the satisfaction of human needs (e.g., Cradoso et al., 2022; Molix & Nichols, 2013), sustainability (e.g., Jamieson, 2004; Prescott-Allen, 2001; United Nations Commission on Sustainable Development, 2001), capability (e.g., Tonon, 2018), socio-economic security (e.g., Chambers, 1995; Glewwe & van der Gaag, 1990), a slow pace of life (e.g., Cittaslow, 2006; Mayer & Knox, 2009), cultural diversity (e.g., Mohanty, 2009), and innovation ecosystems (e.g., Martinez-Fernandez & Potts, 2009).
Based on this literature review of the major conceptualizations of community quality of life, we believe that the personal utility framework is highly instrumental in establishing the contribution of residents’ perceptions of community quality of life to their own personal well-being (i.e., subjective well-being; cf. Atkinson et al., 2020).
Many community indicators projects have been developed guided by the concept of personal utility (e.g., Atkinson et al., 2020; Richards & Kamman, 2006; Sirgy & Cornwell, 2001; R. Widgery, 2004). The basic premise of these projects is that a community rated highly on quality-of-life dimensions is one whose conditions and services meet the needs of its residents (as measured by surveys of residents’ satisfaction with community conditions and services). Community conditions are outcomes of the quality of the environment (air, water, land, etc.), rate of change to the natural landscape (deforestation, housing/commercial development, loss of agricultural land, etc.), race relations, cost of living, crime, ties with people in the community, and housing conditions (e.g., Caffaro et al., 2019). In contrast, community services involve businesses, non-profit organizations, and government organizations. Examples of business organizations include financial service providers (e.g., banks) and retailers across varying categories and services (e.g., shopping malls; Sirgy & Cornwell, 2001). Non-profit organizations may include adoption/foster care services, counseling and support services, cultural/recreation services, educational services, and healthcare facilities, among others. Government organizations include law enforcement, fire protection, transportation, public utilities, public recreation facilities, and public schools, among others (Sirgy & Cornwell, 2001).
As such, we attempt, in this paper, to test a model of city well-being, guided by the concept of personal utility, in a global context. Specifically, the model highlights the key factors shaping residents’ perceptions of quality of life in the city. The model also captures the connection between residents’ perceptions of the city’s quality of life and their personal well-being.
Theoretical Model and Hypotheses
Much of the research on subjective indicators of community quality of life is based on surveys of selected cities and populations. As such, the findings of this research may be limited to the selected geographic cities and populations. That is, these study findings may not be generalizable across all regions globally. We aim to develop a universal model applicable across international regions and validate it through a survey that incorporates a comprehensive set of subjective indicators across multiple areas in a global context. For this purpose, we used the Gallup World Poll (https://www.gallup.com/analytics/318875/global-research.aspx).
Our theoretical model is grounded in the three streams of research as described above: (1) research related to the use of the personal utility conceptualizations of city quality of life, (2) the contribution of residents’ perceptions of city quality of life to their subjective well-being, and (3) the significant factors influencing residents’ perception of city quality of life. Specifically, concerning the first stream of research (research related to the use of the personal utility conceptualizations of city quality of life), the model we are about to describe below is based on the research that conceptualizes city quality of life in terms of residents’ overall satisfaction with the city as well as its specific conditions and amenities (Sirgy & Cornwell, 2001). For the second research stream, which concerns the contribution of residents’ perceptions of city quality of life to their subjective well-being, our theoretical model is grounded in research on the impact of residents’ perceived city quality of life on their personal well-being (i.e., subjective well-being). For the third research stream, which explores the significant factors influencing residents’ perceptions of city quality of life, the model focuses on a composite of institutional, social, environmental, and economic factors. The institutional factor in this study has been operationalized into two components: the city’s infrastructure and its social services. We believe that a model focusing on this composite set of predictors of perceived city quality of life is likely to be most useful to city planners and other public policymakers globally. This approach would help address weak correlations between objective city quality-of-life measures (e.g., cost of living) and subjective perceptions of city quality of life.
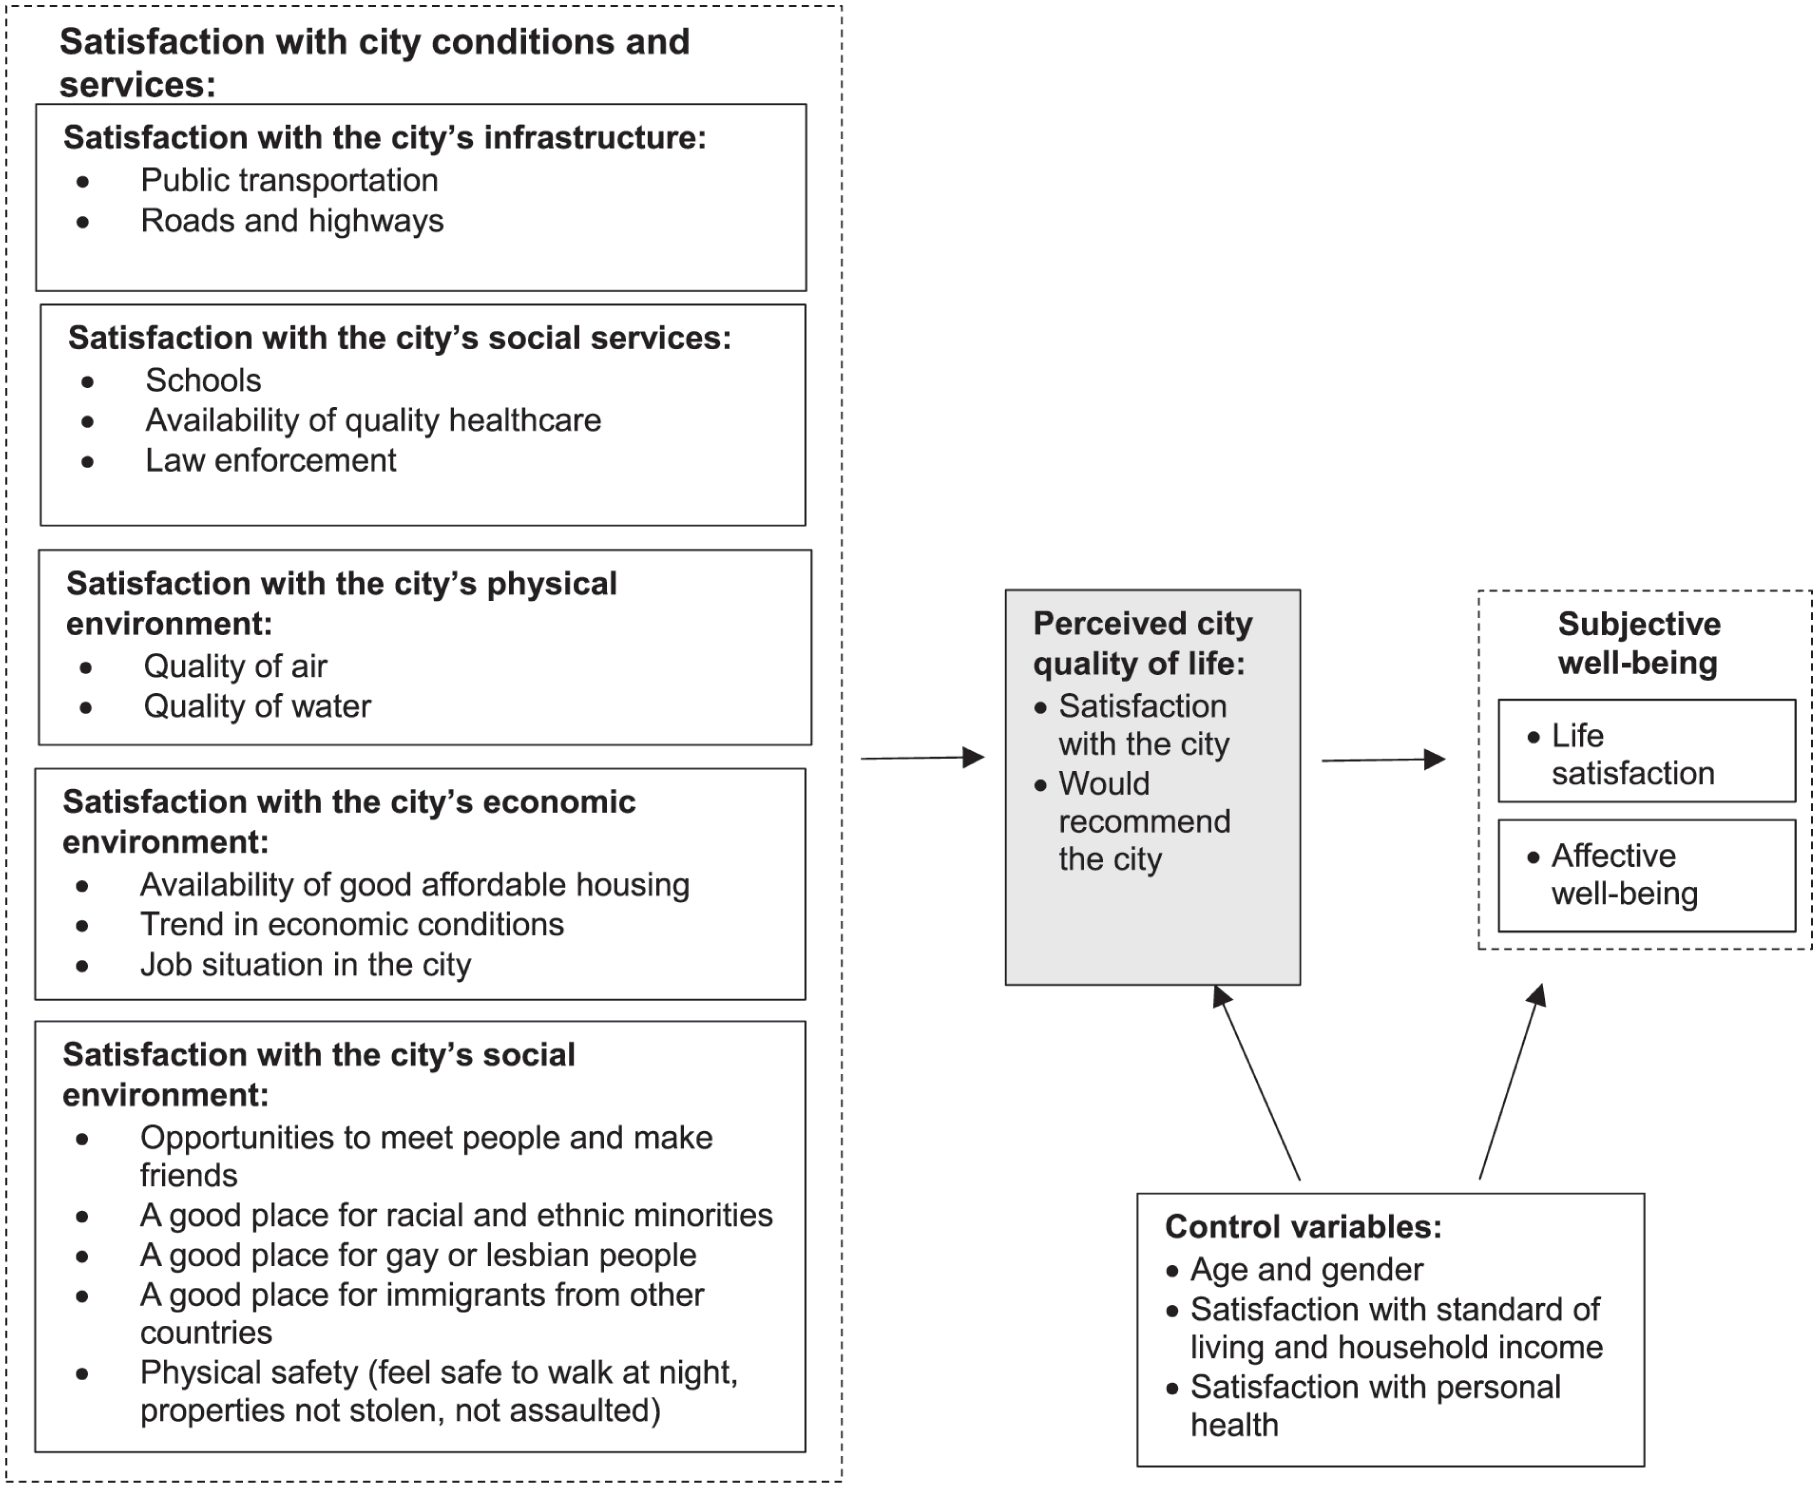
The theoretical model is shown in Figure 1. As shown in the figure, the model involves four major sets of constructs: (1) satisfaction with city conditions and services, (2) perceived city quality of life, (3) subjective well-being, and (4) control variables.
Does residents’ satisfaction with city conditions and services influence residents’ satisfaction with the city at large and their subjective well-being?
Satisfaction With City Conditions and Services
Based on item availability in the Gallup World Poll, the constructs were included regarding residents’ satisfaction with necessary city conditions and services (infrastructure, social services, physical environment, economic environment, and social environment). Specifically, satisfaction with the city’s infrastructure is captured in two dimensions: public transportation and roads and highways. Satisfaction with the city’s social services is captured across three dimensions: schools, quality healthcare, and law enforcement. Satisfaction with the city’s physical environment is captured in two dimensions: air quality and water quality. Satisfaction with the city’s economic environment is captured across three dimensions: affordable housing availability, favorable economic conditions, and good employment opportunities. Satisfaction with the city’s social environment is captured across five dimensions: opportunities to meet people and make friends; a good place for racial and ethnic minorities; a good place for gay and lesbian people; a good place for immigrants from other countries; and physical safety.
Given that we are using the Gallup World Poll, the inclusion of selected dimensions of the constructs in our model was restricted by data availability. We address this issue in the Study Limitations section of the Discussion.
Perceived City Quality of Life
This construct comprises two dimensions: overall satisfaction with the city and the proclivity to recommend it to others. Residents’ overall satisfaction with the city has been widely used as an indicator of city quality of life (e.g., Biagi et al., 2020; del Mar Martínez-Bravo et al., 2019; Węziak-Białowolska, 2016). Also, studies have shown correlations between city residents’ perceptions of quality of life and their intention to recommend the city (e.g., Gim, 2023; Kang et al., 2023).
Subjective Well-being
This construct comprises two dimensions: life satisfaction and affective well-being. These two aspects of subjective well-being are measured in the Gallup World Poll across countries and have been extensively used in prior research (e.g., Helliwell et al., 2022; Joshanloo & Jovanović, 2019). They capture two key aspects of subjective well-being: cognitive (life evaluation) and affective (affect balance; e.g., Diener et al., 1999).
Control Variable
Control variables included constructs held constant due to prior-established relationships: age, gender, satisfaction with the standard of living, household income, and satisfaction with personal health. These factors (age and gender as basic demographics; satisfaction with standard of living and household income as indicators of socioeconomic status; and satisfaction with personal health as indicators of health and functioning) have been shown to be significant correlates of subjective well-being (e.g., Das et al., 2020). Despite debate over the nature of age’s impact on subjective well-being, it is common to control for its effects in survey research (e.g., Blanchflower, 2021). Studies have shown that household income positively affects subjective well-being through satisfaction with the standard of living (e.g., Pleeging et al., 2021; Yu et al., 2020). Furthermore, satisfaction with personal health has long been understood as a prerequisite for subjective well-being (e.g., Mouratidis, 2021).
Underlying Theory
What is the underlying theory that connects these constructs? We believe that the bottom-up spillover theory of life satisfaction effectively explains the theoretical connections (e.g., Andrews & Withey, 1976; Campbell et al., 1976; Diener, 1984). The basic premise of the theory is the trickle of affect from a concrete state of affairs to more abstract states. Specifically, residents’ satisfaction with city conditions and services (i.e., concrete evaluations of city conditions and services) influences the more abstract assessment of the city at large. This abstract concept, in turn, influences the most abstract concepts of life satisfaction and affective well-being (i.e., bottom-up spillover).
In other words, residents’ overall satisfaction with their city is likely to be influenced by their satisfaction with
the city’s infrastructure (satisfaction with public transportation and satisfaction with roads and highways),
the city’s social services (schools, availability of quality healthcare, and law enforcement),
the city’s physical environment (quality of air and water),
the city’s economic environment (availability of good, affordable housing, trend in economic conditions, and job situation), and
the city’s social environment (opportunities to meet people and make friends, a good place for racial and ethnic minorities, a good place for gay and lesbian people, a good place for immigrants from other countries, and physical safety).
Ultimately, perceived city quality of life, together with control variables (e.g., satisfaction with other relevant life domains such as standard of living, household income, and personal health) as well as age and gender, is expected to influence residents’ subjective well-being (i.e., life satisfaction and affective well-being). In brief, applying the bottom-up spillover theory, we argue that residents’ overall satisfaction with a city is determined by their satisfaction with its sub-domains. Similarly, the affect invested in the global judgment about the city at large spills over vertically to the most abstract global judgment (i.e., life satisfaction and affective well-being).
Hypotheses
Based on this theoretical model, we articulate a set of hypotheses to be tested empirically using data from the Gallup World Poll.
Methods
Participants
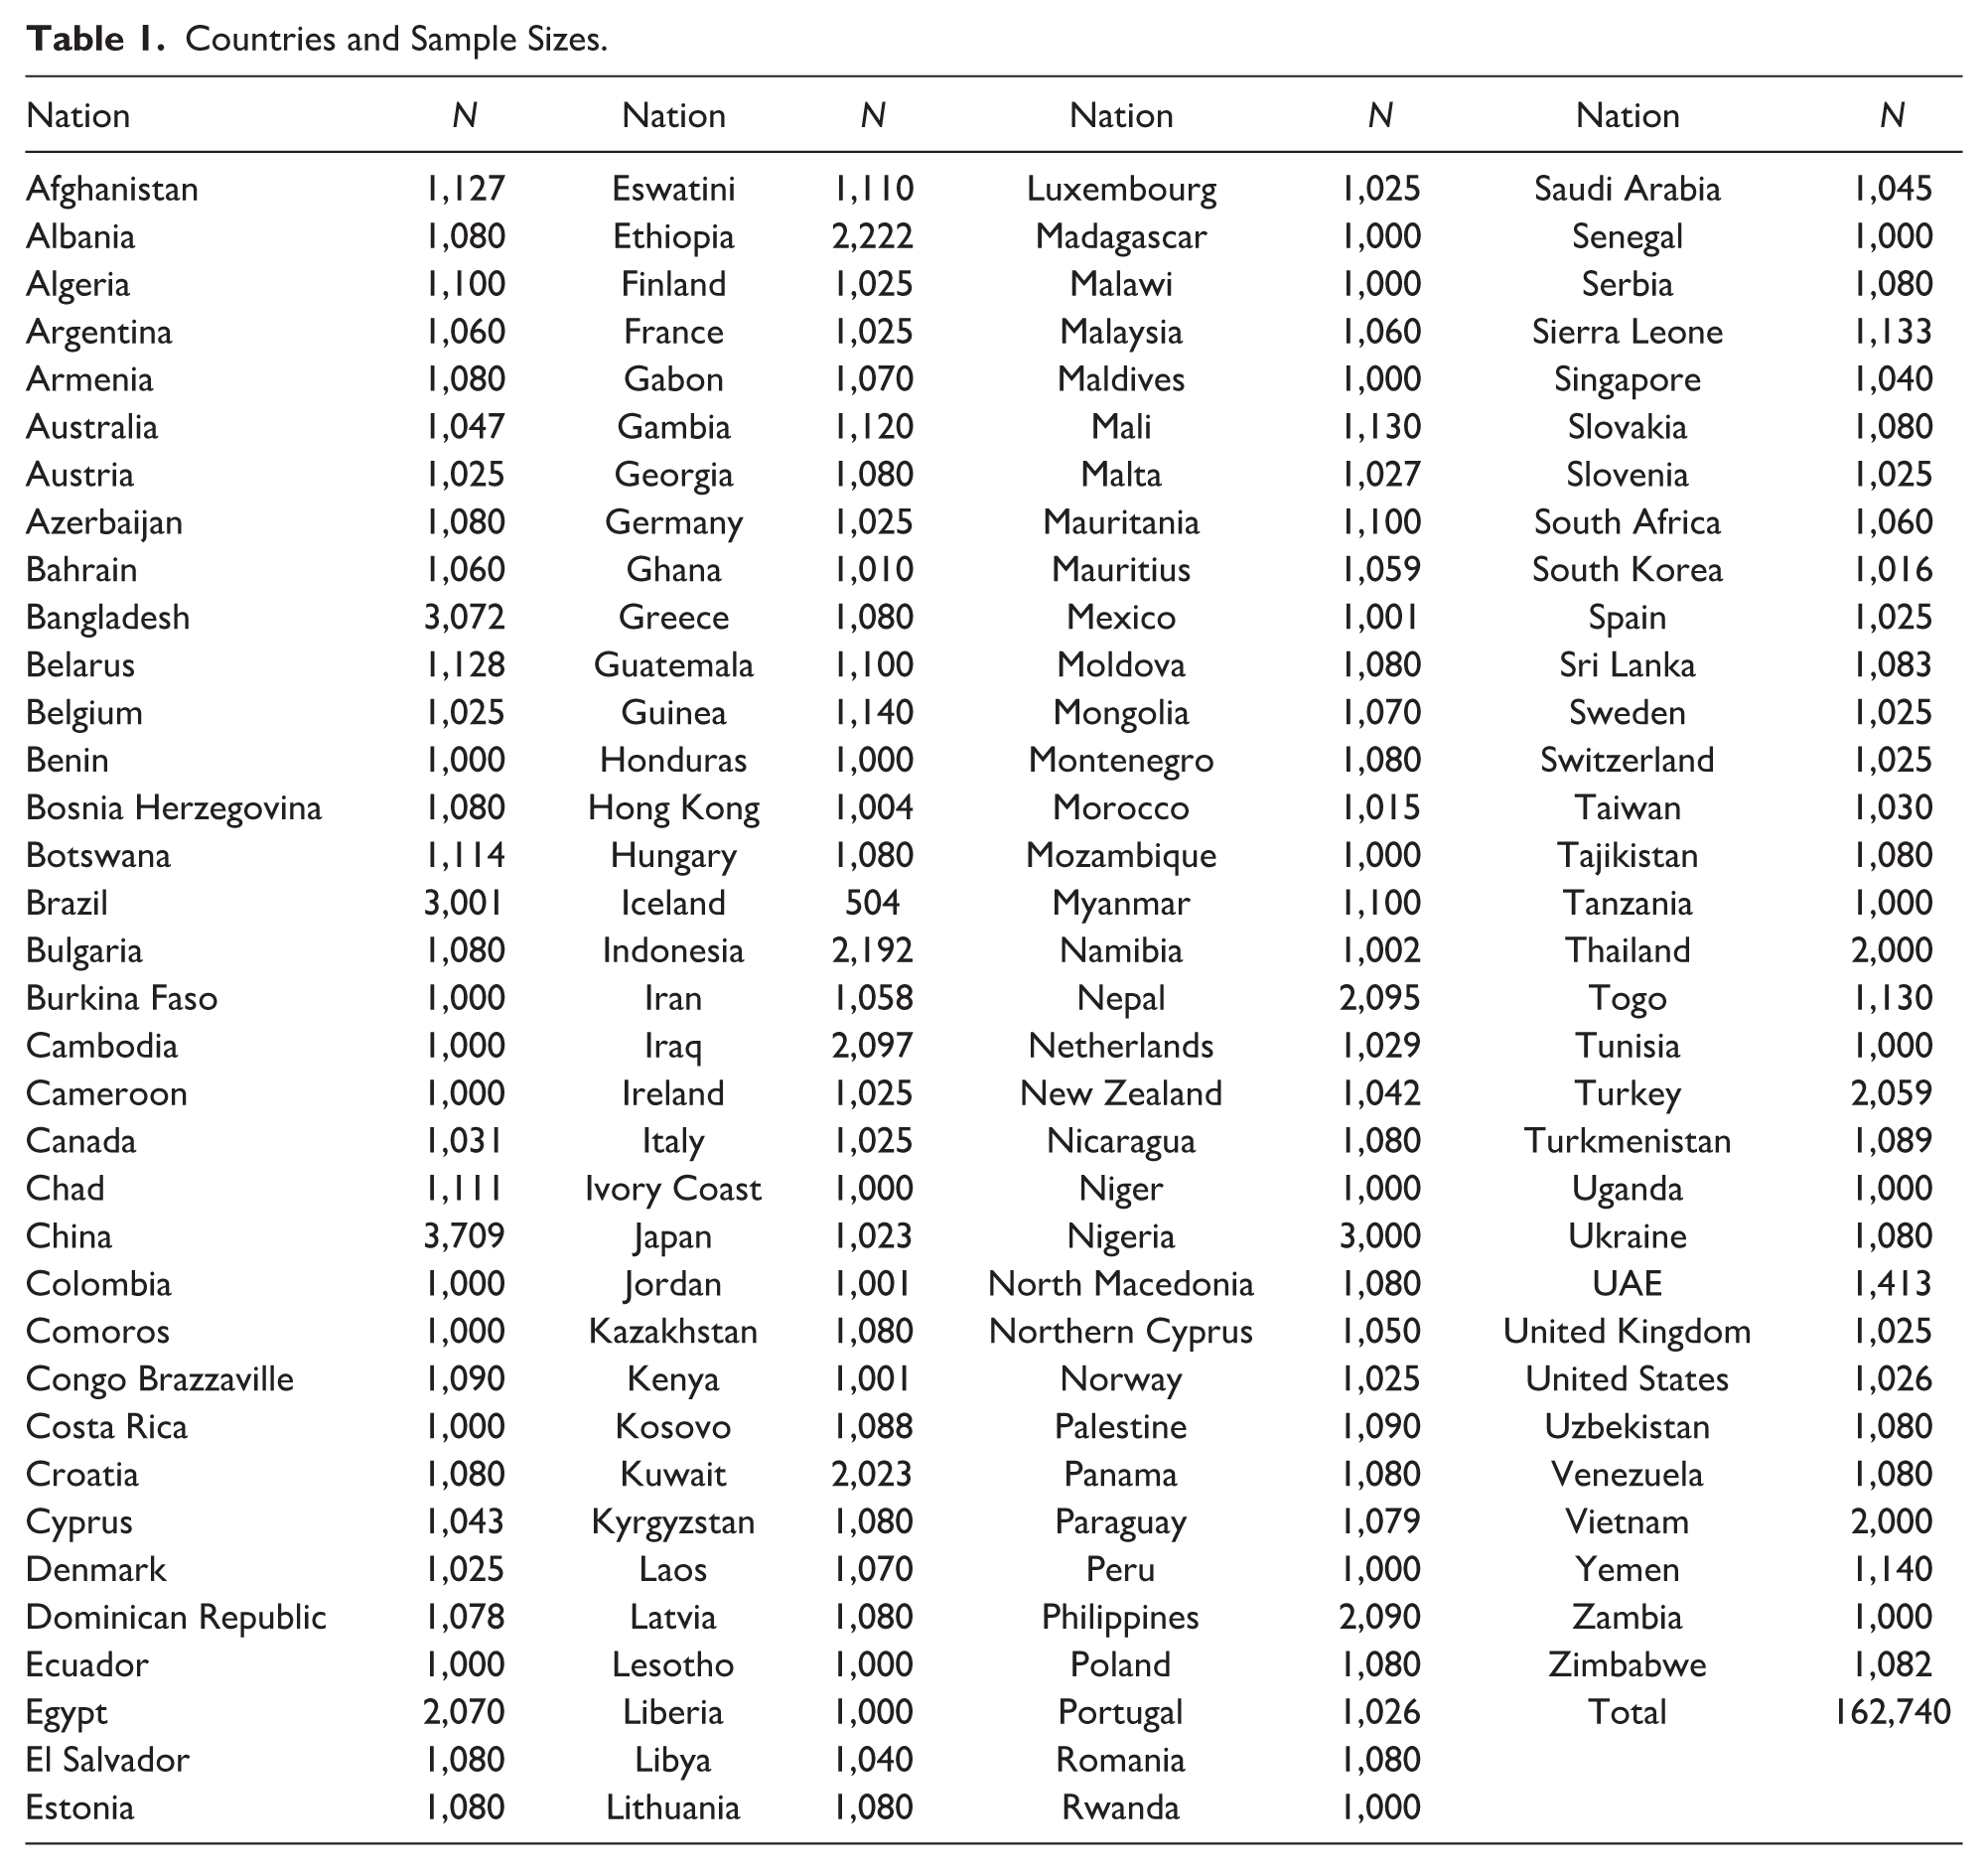
We used the Gallup World Poll data collected in 2019. The sample consists of 162,740 participants from 137 nations. The survey covers a wide range of topics, including well-being, employment, politics, law and order, food and shelter, health, and more, offering critical insights into global trends and public sentiment. For our study, we selected survey items relevant to our research questions. The Gallup World Poll employs a rigorous method to collect data from a diverse global population. Gallup uses a standardized questionnaire, translated into the major languages of each country, and face-to-face or telephone interviews. The sampling is probability-based and nationally representative of the resident population aged 15 and older. In most countries, approximately 1,000 individuals are surveyed annually, with larger samples in more populous nations (Tortora et al., 2010). Table 1 shows the countries included in the global survey and their respective sample sizes. The median age of participants across the sample was 39, with a mean age of 41.8 and a standard deviation of 18.1. Female respondents made up 53.5% of the dataset.
Countries and Sample Sizes.
Measures
To measure the concepts in our study, we used items from the Gallup World Poll. While these items provided partial coverage of our theoretical constructs, they were the most appropriate measures accessible within the dataset. Despite the incomplete representation of some concepts, the Gallup World Poll remains strong in its global scope and extensive coverage. This level of international representation is crucial for the generalizability of our findings, as no other survey offers such a comprehensive dataset. Consequently, we had to work within these constraints, acknowledging the limitations while leveraging the unique strengths of the Gallup World Poll to enhance our understanding of the quality of life in cities across diverse global contexts.
We identified the most relevant items from the 2019 Gallup World Poll to operationalize our constructs of interest. The number of applicable items varied by concept, with some constructs represented by only two items, while several indicators measured others. Life satisfaction, a key dependent variable, was assessed using the “ladder of life” question, which uses an 11-point Likert scale ranging from 0 (worst possible life) to 10 (best possible life). Except for the life satisfaction measure and the household income satisfaction item (used as a covariate in both models), all other items in the study were binary (e.g., yes/no and satisfied/dissatisfied).
Detailed information on the scales used in this research, including their internal consistency, is presented in Table 2. It is noteworthy that some Cronbach’s alpha coefficients fall below conventionally acceptable thresholds, primarily due to the scales’ brevity and the presence of binary items. Despite this constraint, in the context of global-level research where space for longer scales is limited, adopting lower thresholds than those typically applied in single-country research may be more practical.
Variable Characteristics.

Statistical Analysis
To account for the hierarchical nature of the data, this research employed multilevel modeling. Traditional regression methods, which assume independence among observations, are inappropriate for this type of data because individuals from the same country are likely to be influenced by common contextual elements. Multilevel modeling addresses this data characteristic and facilitates the examination of relationships among variables while accounting for the nested structure of individual participants within their countries (Finch et al., 2019).
The analysis was conducted using Bayesian estimation in Mplus. We used non-informative priors because there was no strong prior knowledge of parameter values. This approach ensures that the results are primarily driven by the observed data, minimizing potential biases from incorrect prior assumptions (Depaoli & van de Schoot, 2017). Our estimation procedure involved two Markov Chain Monte Carlo (MCMC) simulations, each running 10,000 iterations with the GIBBS (PX1) algorithm. The first 5,000 iterations were discarded as burn-in. We specified a random-intercept model without group-level covariates, centering mediators and predictors around their respective group means, except for binary variables (Enders & Tofighi, 2007). The Bayesian estimator uses all available data during estimation, similar to the full-information maximum-likelihood estimator, without excluding respondents with incomplete data, thereby maximizing data utilization and power.
To assess model convergence, we examined the potential scale reduction factor (PSRF) and visually inspected trace plots and autocorrelation plots (Brooks & Gelman, 1998). A PSRF value close to 1.000 indicates satisfactory convergence across chains. Model fit was evaluated using the posterior predictive p-value: values close to .500 suggest that the model adequately reproduces the observed data. In Bayesian analysis, statistical significance is typically determined using credible intervals rather than p-values (Kruschke & Liddell, 2018). A credible interval represents the range of plausible values for an effect based on the posterior distribution. Effects are considered statistically significant if their credible intervals do not include zero. One advantage of Bayesian estimation is its ability to compute the posterior distribution of indirect effects directly, eliminating the need for bootstrapping procedures often used in frequentist approaches (Miočević et al., 2018). This iterative process, implemented via MCMC simulations, generates samples from the joint posterior distribution of model parameters, including indirect effects, allowing for straightforward computation of indirect effects and their credible intervals during model estimation.
Ruling Out an Alternative Explanation
We began the analysis by comparing the fit of the two competing models to rule out an alternative explanation. To reiterate, our model is based on the bottom-up theory of life satisfaction (e.g., Andrews & Withey, 1976; Campbell et al., 1976). As described earlier, the basic premise of the theory is the trickle of affect from concrete states of affairs to more abstract ones. Specifically, residents’ satisfaction with city conditions and services (viewed as concrete evaluations of city conditions and services) impacts the more abstract assessment of the city at large. This abstract concept, in turn, influences the most abstract concepts of life satisfaction and affective well-being (i.e., bottom-up spillover). In contrast, a competing theory is the top-down theory (Diener, 1984). Specifically, the top-down theory argues that global life satisfaction determines satisfaction in specific life domains, which in turn influences satisfaction with life events. Evidence suggests that both models are viable (e.g., Lance et al., 1989; Malvaso & Kang, 2022). The alternative model, top-down theory, can be captured as follows: subjective well-being is hypothesized to influence perceived city quality of life, which in turn may influence perceptions of city conditions and services.
For this initial model comparison (between the bottom-up and top-down models), only the focal variables were included, and all covariates were excluded to focus on the core theoretical structure and avoid potential confounding from the control variables. Model fit was evaluated using posterior predictive p-values and the Deviance Information Criterion (DIC). Posterior predictive p-values closer to .5 indicate better model fit, as they suggest minimal discrepancy between the observed and replicated data. Lower DIC values indicate a better trade-off between model fit and complexity (Muthén et al., 2017). The bottom-up model yielded a posterior predictive p-value of .526 and a DIC value of 3,731,889.916. In contrast, the top-down model produced a posterior predictive p-value of .463 and a DIC value of 3,747,262.269. Both metrics indicated superior performance of the bottom-up model. Specifically, the posterior predictive p-value of the bottom-up model was closer to .5, suggesting better replication of the observed data, and the lower DIC value indicated a better balance between model fit and complexity. Based on these results, we concluded that the bottom-up model was more parsimonious and better supported by the data. Accordingly, we tested the hypotheses of our primary model, the bottom-up model, and present the results in the following section.
Results
To test our main model, we conducted Bayesian analyses to examine the relationships between our predictor variables, the mediator (perceived city quality of life), covariates (age, gender, satisfaction with standard of living, household income, and satisfaction with personal health), and two outcome variables: personal life satisfaction and affective well-being. This model yielded an acceptable posterior predictive p-value of .505 and a potential scale reduction factor (PSRF) of 1.001, indicating satisfactory fit and convergence. Inspection of the trace plots and autocorrelation plots provided supporting evidence of sound mixing and acceptable autocorrelation levels. Table 3 shows the parameter estimates derived from the model. To facilitate comparison of predictor importance across outcomes, standardized coefficients are provided as effect-size measures.
Parameter Estimates.

Note. The presence of an asterisk for an effect denotes that the associated 95% credible interval does not contain zero, thereby signifying a statistically significant effect. LS = Life satisfaction; AWB = Affective well-being; PCQOL = Perceived city quality of life; Point estimate = median.
H1 states that residents’ perceived city quality of life is a positive function of residents’ satisfaction with city conditions and services. This overarching hypothesis was broken down into five sub-hypotheses, each hypothesis focuses on different city conditions and services (H1a: effect of residents’ satisfaction with city infrastructure on residents’ perceived quality of life; H1b: effect of residents’ satisfaction with city social services on residents’ perceived quality of life; H1c: effect of residents’ satisfaction with city physical environment on residents’ perceived quality of life; H1d: effect of residents’ satisfaction with city economic environment on residents’ perceived quality of life; H1e: effect of residents’ satisfaction with city social environment on residents’ perceived quality of life). These hypotheses were mainly supported, with the most significant effects on residents’ satisfaction with the city’s economic and social environments (see the standardized coefficients in the bottom portion of Table 3). The results in Table 3 indicate that perceived city quality of life was significantly associated with all predictors, the mediator, and all covariates (R2 = 20%). All coefficients were in the expected direction.
Hypotheses 2 and 3 focus on mediation effects: how residents’ perceived city quality of life mediates the impact of satisfaction with city conditions and services on residents’ subjective well-being—residents’ life satisfaction (H2a-e) and residents’ affective well-being (H3a-e). These hypotheses were all supported. We then directly examined the 10 indirect effects, and their results are shown in Table 4. All ten indirect effects proved significant, implying that the five predictors (residents’ satisfaction with the city’s infrastructure, satisfaction with the city’s social services, satisfaction with the city’s physical environment, and satisfaction with the city’s economic environment) influence residents’ life satisfaction and affective well-being through their positive impact on residents’ perceived quality of life. These results provide substantial evidence for the 10 partial mediation hypotheses proposed in this study, supporting H2a-e and H3a-e.
Indirect Effects via Perceived City Quality of Life.
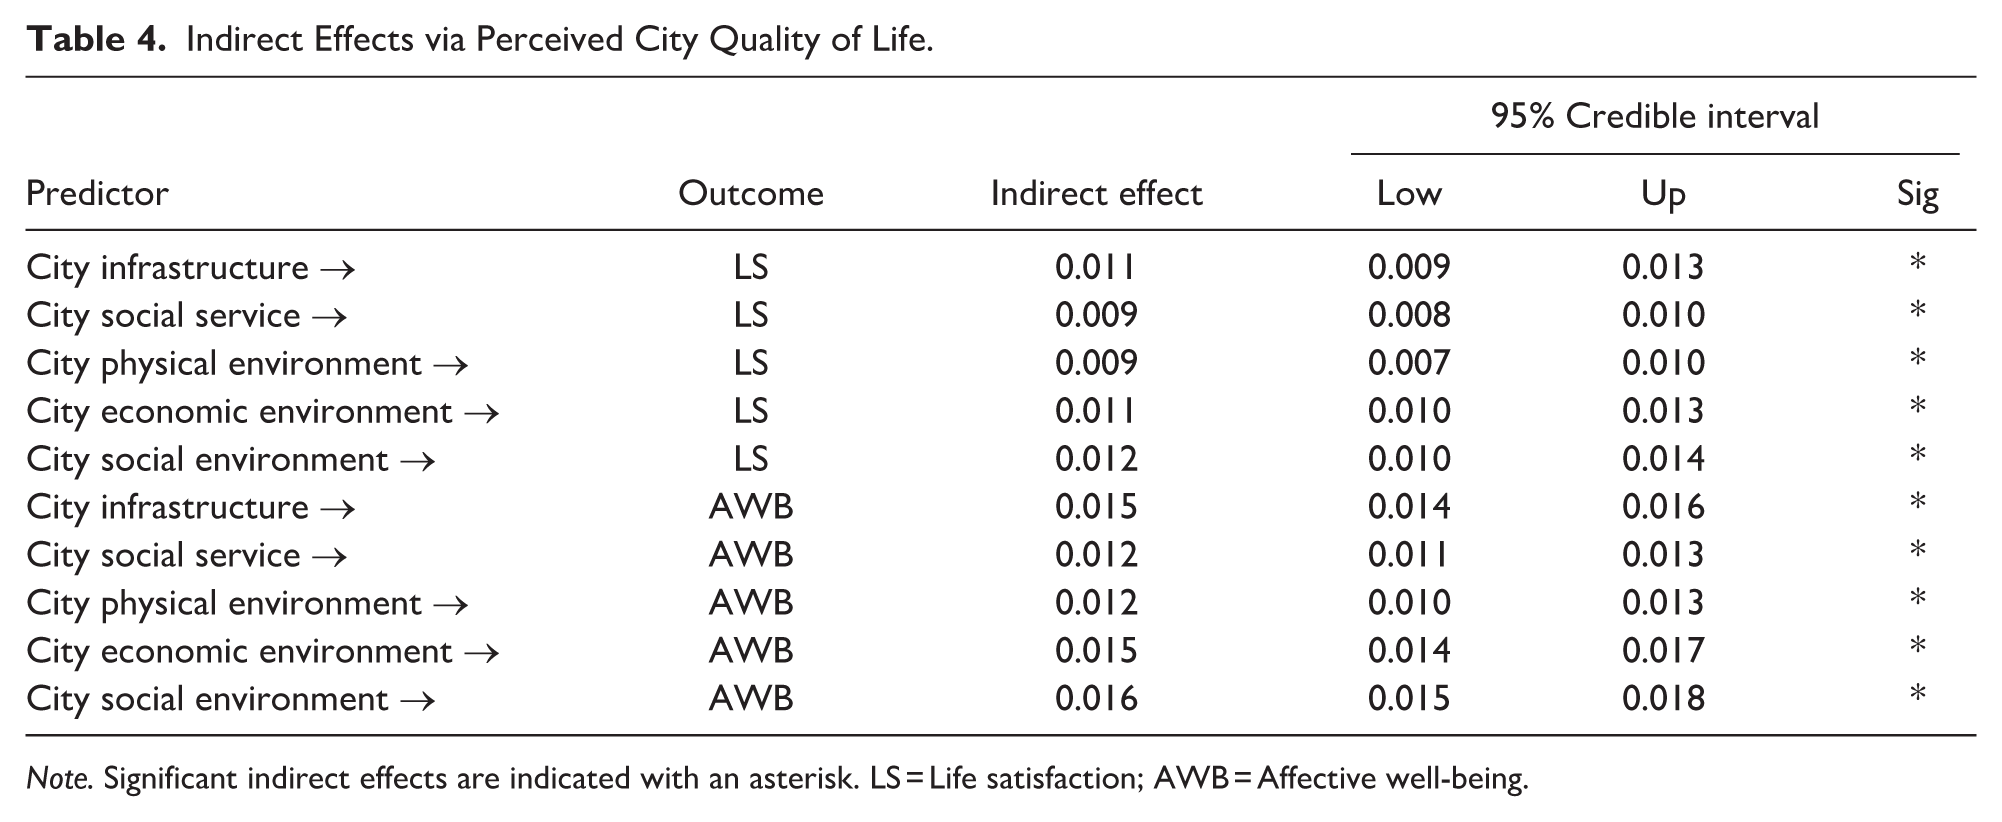
Note. Significant indirect effects are indicated with an asterisk. LS = Life satisfaction; AWB = Affective well-being.
Notably, the results indicate that life satisfaction was significantly associated with all predictors, the mediator, and covariates (R2 = 14%). Affective well-being showed significant relationships with all variables except satisfaction with city infrastructure (R2 = 19.6%); therefore, many direct effects were also significant. It is worth noting that two of the life satisfaction coefficients were unexpectedly negative, though small in magnitude. This may represent a suppression effect resulting from the inclusion of an extensive set of predictors. The observed negative direct effects suggest that these predictors have little direct influence on life satisfaction. However, their strong predictive power for residential area satisfaction suggests that they can still indirectly contribute to well-being.
To assess potential multicollinearity, we examined a Spearman correlation matrix (see Table 5). As shown in this matrix, there is no evidence of problematic multicollinearity among the study variables. Two unexpected associations were observed between city infrastructure, city physical environment, and life satisfaction. However, both of these associations were extremely small in magnitude. These weak effects are likely to have reached statistical significance due to the large sample size. Moreover, these associations are not directly relevant to our primary hypotheses. Therefore, we did not modify the analytic approach. However, we included the correlation matrix to rule out multicollinearity.
Spearman Correlation Matrix for Predictors and Covariates.
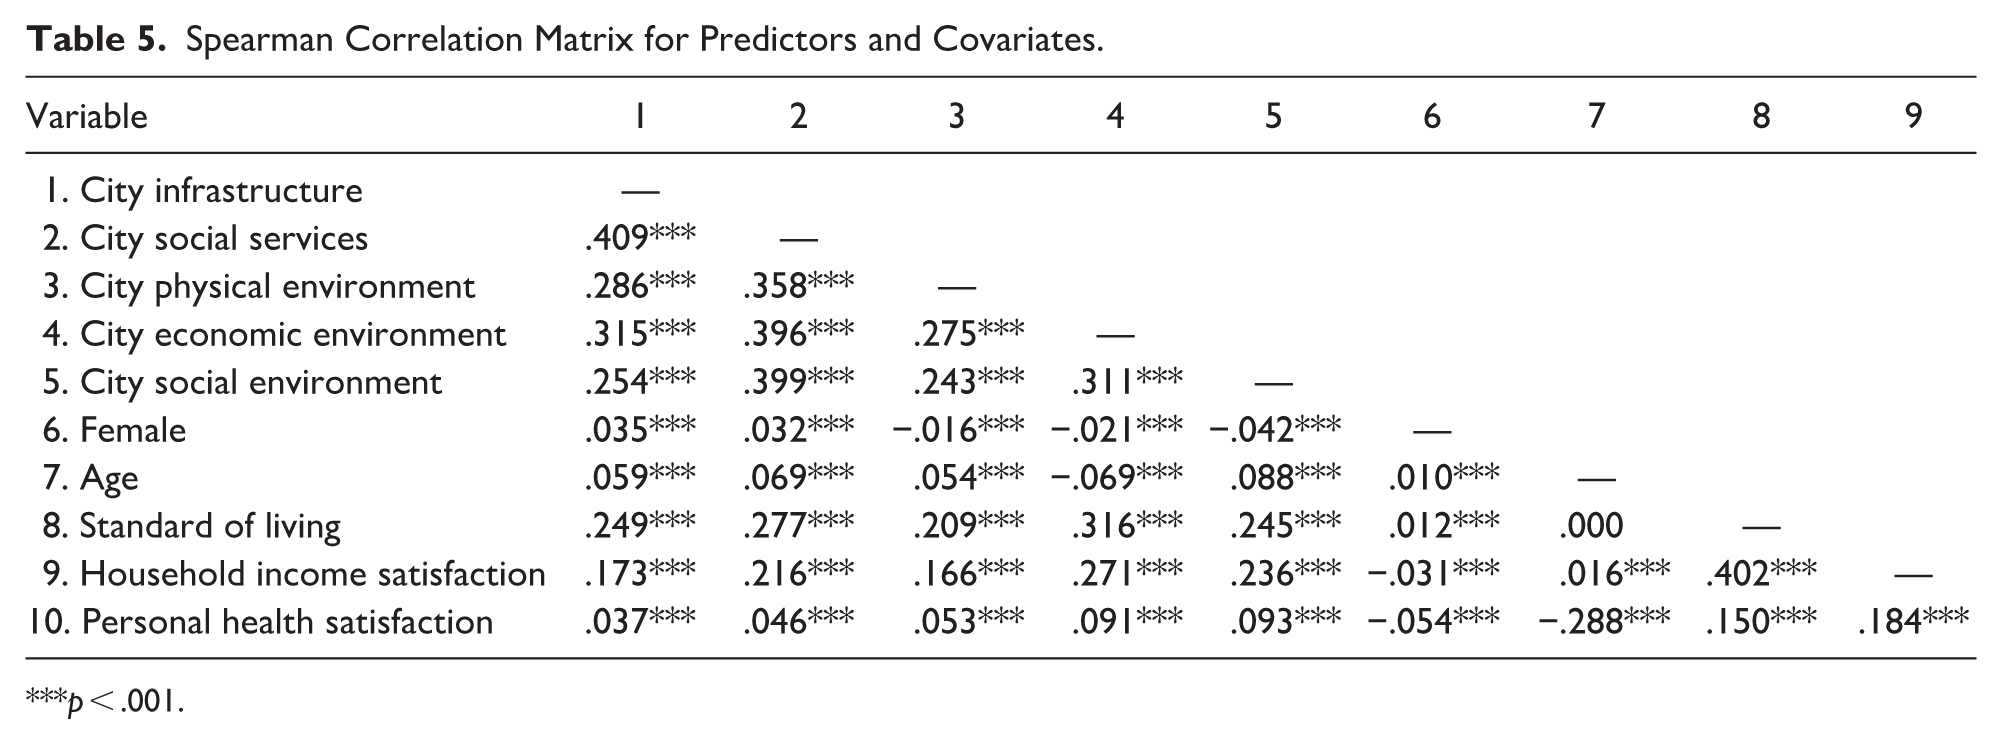
p < .001.
Discussion
Based on bottom-up spillover theory, this study examined the mediating role of perceived city quality of life in the relationship between residents’ satisfaction with the city’s conditions and services and their subjective well-being using survey data collected in 2019 by the Gallup Poll from 137 countries, ensuring generalizability of the study findings across the globe. We also argued that our theoretical model is grounded in the three streams of research as described in the background section of this paper: (1) research related to major conceptualizations of city quality of life using subjective indicators, (2) contribution of residents’ perceptions of city quality of life to their subjective well-being, and (3) the major factors influencing residents’ perception of city quality of life.
Accordingly, the theoretical model comprised three major hypotheses. Hypothesis 1 stated that residents’ perceived city quality of life is a positive function of satisfaction with the city’s conditions and services. This hypothesis was broken down by the various city conditions and services (i.e., the city’s infrastructure, social services, physical environment, economic environment, and social environment). Hypotheses 2 and 3 examined the mediating effect of residents’ perceived city quality of life. In other words, we made the theoretical case that residents’ satisfaction with the city’s conditions and services affects residents’ subjective well-being (i.e., life satisfaction and affective well-being) through residents’ perceived city quality of life.
The results supported our hypotheses. Specifically, the results supported the hypothesis that residents’ perceived city quality of life is a positive function of residents’ satisfaction with city conditions and services (H1a: effect of residents’ satisfaction with city infrastructure on residents’ perceived quality of life; H1b: effect of residents’ satisfaction with city social services on residents’ perceived quality of life; H1c: effect of residents’ satisfaction with city physical environment on residents’ perceived quality of life; H1d: effect of residents’ satisfaction with city economic environment on residents’ perceived quality of life; H1e: effect of residents’ satisfaction with city social environment on residents’ perceived quality of life).
The results also supported the second and third hypotheses, capturing the mediating effect of residents’ perceived city quality of life. That is, the effects of residents’ satisfaction with the city’s conditions and services (concrete life events) on residents’ subjective well-being (most abstract judgments about residents’ happiness at large) are mediated by domain satisfaction (in this case, residents’ satisfaction with the city at large). By demonstrating the statistical superiority of the bottom-up model over the top-down model, this study supported the notion that the mediation effect is theoretically grounded in the bottom-up theory of life satisfaction.
Policy Implications
Based on the study findings, we conclude that we successfully developed and tested a model of subjective city quality-of-life indicators that applies to all geographic communities (e.g., towns, cities, and counties) worldwide. We also believe that our model clearly articulates the predictors of perceived city quality of life that are most likely to benefit city planners and other public policy makers globally. Specifically, surveying any city guided by our theoretical model should allow city planners to develop policies directly related to the predictors of residents’ perceived city quality of life, predictors related to city conditions and services:
policies related to the city’s infrastructure (i.e., public transportation and roads and highways),
policies related to the city’s social services (i.e., schools, availability of quality healthcare, and law enforcement),
policies related to the city’s physical environment (i.e., quality of air and quality of water),
policies related to the city’s economic environment (i.e., availability of good, affordable housing, trend in economic conditions, and the job situation in the city),
policies related to the city’s social environment (i.e., opportunities to meet people and make friends, a good place for racial and ethnic minorities, a good place for gay and lesbian people, a good place for immigrants from other countries, and physical safety).
Our model allows policymakers from any geographic city to apply these indicators to measure strengths and weaknesses, thereby developing policies to reinforce strengths and remedy weaknesses. For example, communities with residents’ satisfaction with infrastructure below the average may need to focus on enhancing their respective indicators (e.g., satisfaction with public transportation, roads, and highways). However, it should be noted that every city has its own unique characteristics, both strengths and weaknesses, that are unlikely to be captured by the “global model.” Given that our model is global, it should be complemented by a “local model.” The local model should capture the residents’ unique set of city-specific issues. For example, suppose that a city has a particular problem with graffiti and homelessness. Residents complain that the city is an “eyesore” because of the graffiti and the many homeless people who panhandle on the streets with their sleeping bags and other paraphernalia. City leaders and policymakers wish to gauge the extent to which residents feel dissatisfied about graffiti and homelessness. The global indicators of our model do not capture these issues. As such, a local model must be developed to complement the global model, producing a comprehensive set of indicators that capture residents’ satisfaction with all essential city conditions and services.
Study Limitations and Future Research
One can argue that the Gallup Poll missed essential indicators that should have been incorporated into the “global model,” indicators such as residents’ satisfaction with the city’s light and power (i.e., the city’s power distribution infrastructure). Shouldn’t this indicator be included in the set of subjective indicators related to the city’s infrastructure? How about residents’ satisfaction with the city’s water, sewer, and garbage collection? Yes, this seems to be an essential dimension of the city’s quality of life as well. As such, the global model should be revisited to ensure a more comprehensive account of global dimensions of city quality of life. See Sirgy (2018) for a discussion on what constitutes a “comprehensive” set of city quality-of-life indicators. One way to develop a comprehensive set of subjective indicators of city quality of life is to better understand the theoretical concept that guides their formulation. The global model we develop in this paper is implicitly guided by the concept of personal utility (Sirgy & Cornwell, 2001). That is, a city rated high on well-being is one in which its residents evaluate their lives positively. City conditions can be classified into three categories: economic (e.g., cost of living, commercial development), social (e.g., crime, ties with neighbors), and physical (e.g., deforestation). Note that many city conditions are outcomes of city action through city services that serve city residents and influence city outcomes. City services are typically grouped into three major categories: business organizations, non-profit organizations, and government organizations. Normally, city indicator projects guided by the personal utility perspective employ city surveys to capture residents’ perceptions and evaluations of city conditions and services. As such, the global model can be “fine-tuned” to better understand the underlying theoretical concept by including salient dimensions that capture the entire domain of personal utility.
Our study also has methodological limitations that warrant further research. First, most constructs from the Gallup World Poll were measured with a single item on a binary scale. One can argue that such measures are not optimal from a construct validity view (e.g., Diamantopoulos et al., 2012). Furthermore, the Gallup World Poll does not report on the theoretical rationale for selecting survey items to capture the entire domain of the chosen constructs. Although it is not uncommon to use single items to capture constructs for brevity, especially when testing models based on globally collected data (OECD, 2025, p. 32), the potential issues associated with using binary items need to be systematically addressed in future research.
Furthermore, although our study was designed to test the validity of a personal utility model of city well-being in a global context, critics may raise concerns about its claim to universality. In other words, city well-being is likely to differ as a function of specific geographic, cultural, and economic conditions of the local areas of residence that were included in the Gallup World Poll. As such, we encourage future research to address heterogeneity.
Concluding Remarks
The current study significantly advances research on subjective indicators of city quality of life by providing a comprehensive, globally applicable model. To reiterate, our study was motivated by two goals. The first goal is to demonstrate the role of perceived local environmental conditions in the well-being production function. Using global data, we empirically demonstrated that satisfaction with local economic, social, and environmental conditions constitutes a coherent domain that influences subjective well-being through a mediating channel of perception (i.e., perceived city quality of life). The second goal is to demonstrate the validity of a city quality-of-life indicators model in a global context. Using data from 137 countries, our study met the 2 goals.
Our findings not only support the hypothesis that satisfaction with various city conditions and services directly influences perceived city quality of life but also highlight the mediating role of this perception on residents’ overall subjective well-being, thereby more thoroughly applying the bottom-up spillover theory to practical model development. This underscores the importance of considering both global and local indicators when assessing perceived city quality of life. Policymakers and city planners can use our results to identify and address specific areas in need of improvement while acknowledging the unique challenges and strengths of their cities. Integrating these insights can lead to more targeted and effective policies, enhancing the quality of life for urban residents worldwide.
Footnotes
Author Contributions
Conceptualization: M. Joseph Sirgy, Mohsen Joshanloo, Grace B. Yu.
Formal analysis: Mohsen Joshanloo.
Writing for the original draft: M. Joseph Sirgy, Mohsen Joshanloo, Grace B. Yu.
All authors have read and agreed to the submitted version of the manuscript.
Data Availability Statement
Declaration of Conflicting Interests
The authors declared no potential conflicts of interest with respect to the research, authorship, and/or publication of this article.
Funding
The authors disclosed receipt of the following support for the research, authorship, and/or publication of this article: This research was partially supported by a grant from the Well-Being for Planet Earth Foundation (#2021).