
Abstract
Background:
Key drivers of type 2 diabetes (T2D) health care costs include acute diabetes events (ADEs) and long-term complications. Continuous glucose monitoring (CGM) could lead to cost savings by improving glucose management and reducing the incidence of ADEs and complications. However, coverage of CGM by the US Medicaid system is currently heterogeneous.
Aim:
To explore the budget impact of increasing CGM reimbursement to all people living with T2D who are beneficiaries of Medicaid.
Methods:
Budget impact analysis modeling an increase in CGM use of 1% per year for people on multiple daily injections of insulin (MDI) and 2% per year for those on basal insulin or non-insulin therapies. The effect of CGM was modeled as reductions in the costs associated with all-cause hospitalizations (ACH) and all-cause emergency room visits (ACER), based on US data.
Results:
The annual acquisition cost of CGM was calculated to be $1921, which is partly offset by reductions in test strip and lancet use. After applying reductions in ACH and ACER, the annual net budget impact of CGM for an individual with T2D was estimated to be −$13,034, −$2066, and −$917 for MDI, basal insulin, and non-insulin therapy, respectively. The overall impact on the national Medicaid budget would be net savings of $357 million in year 1, $719 million in year 2, and $1.088 billion in year 3.
Conclusions:
Increasing CGM use by Medicaid beneficiaries with T2D, including those on non-insulin therapy, resulted in cost savings from the perspective of the US Medicaid system.
Keywords
Introduction
Diabetes is one of the leading causes of morbidity, disability, and death and is one of the leading drivers of annual health care costs in the USA. 1 Among US adults aged 18 years or older, 29.4 million people (11.3%) were estimated to have a diagnosis of diabetes in 2021. 2 As a result, diabetes is associated with a high economic burden, with a total estimated cost of diagnosed diabetes in the USA of $413 billion in 2022, including $307 billion in direct medical costs. 3
The vast majority of US adults diagnosed with diabetes (94.3% of those aged 20 years and older) have type 2 diabetes (T2D). 2 Key drivers of T2D health care costs include acute diabetes events (ADEs; severe hypoglycemia, diabetic ketoacidosis, and hyperglycemia-related events) and long-term complications.4–7 Both ADEs and complications are related to inadequate glycemic control, and their incidence can be reduced by effective glucose monitoring. 8
Self-monitoring of blood glucose (SMBG) involves fingerstick tests and only measures glucose at a single point in time, whereas continuous glucose monitoring (CGM) systems can provide comprehensive information about glucose variability and trends, alert people living with diabetes to high and low glucose levels, and help them keep their glucose levels in the targeted range, which can decrease their glycated hemoglobin (HbA1c) levels. CGM systems could thus help to reduce the risk of ADEs and long-term complications.8,9
According to the American Diabetes Association Standards of Care in Diabetes, CGM systems should be recommended to people living with diabetes on any type of insulin therapy and should also be considered for adults with T2D treated with glucose-lowering medications other than insulin to help them achieve and maintain individualized glycemic goals. 8
Almost a quarter of American adults living with diabetes rely on Medicaid for access to health care, medications, and technology.10,11 Medicaid coverage for CGM devices remains heterogeneous across US states. As of 2023, most state Medicaid programs restricted CGM reimbursement to individuals with type 1 diabetes (T1D). However, policy reforms have progressively reduced access barriers, and in 2025, over 80% of Medicaid beneficiaries nationwide are eligible for CGM coverage if they are prescribed any form of insulin, regardless of whether they have T1D or T2D. 12
Although the acquisition costs for CGM are higher than those for SMBG, glucose monitoring supplies account for a small fraction of the total cost of treating diabetes. 3 Investing in CGM can lead to cost savings overall by improving glucose management and reducing the cost of treating complications and ADEs. Acquisition of CGM has previously been associated with reduced health care resource utilization (HCRU) and costs compared with SMBG in Medicaid beneficiaries receiving insulin. For example, a claims database analysis found that CGM use was associated with significant reductions in all-cause hospitalizations (ACH) and all-cause emergency room visits (ACER) among Medicaid beneficiaries with T2D receiving insulin. 13 Results of a budget impact model suggested that CGM can offer cost savings compared with SMBG in Medicaid beneficiaries treated with intensive insulin therapy. 4 In addition, the use of CGM was also found to be cost effective compared with SMBG in patients with T2D receiving basal insulin in an analysis conducted from a US perspective with relevance to state Medicaid programs. 14
Studies have also shown a positive impact of CGM on glucose management, HCRU, and costs for people with T2D receiving non-insulin therapy. CGM has been associated with reductions in HbA1c compared with SMBG in people with T2D inadequately controlled with non-insulin therapy in multiple randomized controlled trials15,16 and retrospective database analyses.17–19 A recent cross-sectional study found that frequent CGM use (>75% sensor wear) was associated with greater improvements in HbA1c than infrequent or no use of CGM. 19
A claims database study in France showed a 65% reduction in ADEs associated with CGM, compared with SMBG, among patients receiving oral insulin secretagogues without insulin. 20 In the FRONTIER real-world study in Canada, emergency department visits and hospitalization were reduced after CGM acquisition in patients with T2D receiving only oral therapy. 21 In addition, from a Canadian private payer perspective, CGM was found to be cost effective compared with SMBG in patients with T2D receiving non-insulin therapy. 22 Together, these studies suggest that substantial cost savings could be realized through increased use of CGM.
Objectives
The objective of this budget impact analysis was to explore the financial impact of increasing CGM reimbursement for all adults living with T2D who are beneficiaries of Medicaid across all states in the USA, including those receiving insulin and non-insulin therapies.
Methods
Modeling approach
Microsoft Excel® (Microsoft, Redmond, WA, USA) was used to construct a budget impact model, with all costs calculated in 2025 US dollars. The impact on the Medicaid budget of increasing CGM use was investigated for people living with T2D according to their treatment: multiple daily injections of insulin (MDI), basal insulin, or non-insulin therapies. A 3-year time horizon was applied for each analysis.
Population
The population of interest was the 72,058,701 people estimated by the Centers for Medicare & Medicaid Services (CMS) to be Medicaid beneficiaries in October 2024. 23 The prevalence of diabetes in the adult Medicaid population was estimated as 7.8% based on rates reported by age group (18–44 years and 45–64 years) in the US population for 2021, 2 adjusted for age composition in the same year. 24 Of adults with diagnosed diabetes in the US in 2021, 5.7% were reported to have type 1 diabetes. 2 For the current analysis, the prevalence of T2D in the adult Medicaid population with diabetes was therefore estimated to be 94.3%. The percentage of people living with T2D receiving insulin therapy is 29.8%, 25 of whom 50% are using MDI 26 (Fig. 1). The US Census Bureau 0.78% estimate of annual population growth was applied. 27

Estimation of size of eligible population. DM, diabetes mellitus; MDI, multiple daily injections of insulin; T2D, type 2 diabetes.
Market share estimates
The proportion of people living with T2D and using MDI who were using a CGM device was assumed to increase by 1% of its population per year. Reflecting the lower level of baseline utilization of CGM, the increase among people living with T2D and using basal insulin or non-insulin therapies was assumed to be 5% of their population per year.
Therefore, in years 1, 2, and 3, respectively, the proportion of new CGM users compared with baseline was assumed to be 1%, 2%, and 3% among people living with T2D and using MDI, and 5%, 10%, and 15% among those using basal insulin or non-insulin therapies.
Clinical inputs
The effect of CGM was modeled as a reduction in the 1-year incidence of ACH and ACER post-CGM initiation, based on data from US real-world studies.13,28 ACH and ACER for people with T2D using insulin were taken from an insurance claims study conducted among the US Managed Medicaid population. 13 Compared with the previous 12-month period, ACH in the 12 months following CGM acquisition was reduced by 0.96 and 0.24 events per person per year among people using MDI and basal insulin, respectively. The corresponding reductions in ACER were 0.29 and 0.17 events per person per year (Table 1).
Reductions in HCRU Associated with CGM Acquisition

ACER, all-cause emergency room visits; ACH, all-cause hospitalization; CGM, continuous glucose monitoring; HCRU, health care resource utilization; MDI, multiple daily injections of insulin.
Among people with T2D who were not using insulin, 1-year ACH and ACER reductions were based on a retrospective, real-world claims study of 20,468 patients initiating CGM between 2016 and 2024. Compared with the year before CGM initiation, ACH and ACER were reduced by 0.183 and 0.034 events per person per year, respectively, during the year after initiation of CGM, after adjustment for age, sex, race, ethnicity, and payer (Table 1). 28
Cost inputs
Acquisition costs for SMBG test strips, lancets, and readers were based on Medicare cost codes and the Medicare reimbursement limit of 100 tests per 90 days for patients who are not using insulin (Table 2).30,31 The acquisition cost for CGM sensors was the wholesale acquisition price of the FreeStyle Libre 3 Plus sensor as documented by AnalySource®. 32
Acquisition Cost of Glucose Monitoring
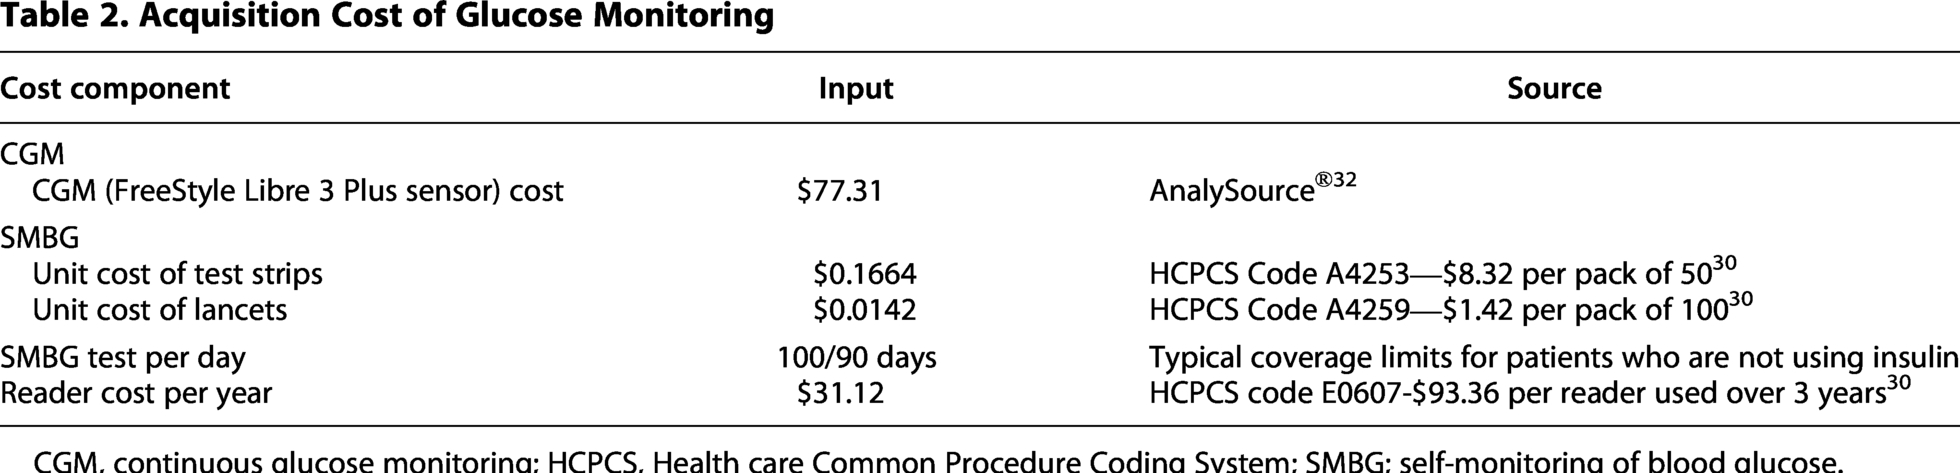
CGM, continuous glucose monitoring; HCPCS, Health care Common Procedure Coding System; SMBG; self-monitoring of blood glucose.
The cost of ACH was based on 2018 hospital facility costs, 33 inflated to 2025 values and adjusted to capture actual payer spending. First, the mean cost among patients hospitalized for diabetes who were aged 18–64 years with T2D was taken from an analysis of the 2018 National Inpatient Sample; this was $12,100 in 2018, which after inflation corresponds to $14,385 in 2025 US dollars. 33 Next, a facility cost-to-facility payment ratio of 0.87, which was taken from an analysis conducted by the US Congressional Budget Office, was used to adjust the hospital facility cost to Medicaid’s reimbursement payment. A further adjustment was made to include professional fees in addition to facility payments at a 1.178 ratio, 34 resulting in a total adjusted cost per ACH of $14,742.
The cost for an ACER was based on the work of Parker et al., 3 who estimated an average cost of $1218 per emergency department visit among people with diabetes in the US in 2022, corresponding to $1302 in 2025 US dollars.
Sensitivity analysis
One-way sensitivity analyses (SAs) were run, examining the impact of 20% increases or decreases in parameters including ACH frequency and cost among SMBG users, CGM costs, T2D prevalence, and insulin use among people with T2D. Because the three treatment cohorts (MDI, basal, and non-insulin) exhibit different reductions in HCRU, additional one-way SAs were performed to evaluate the per-patient-per-year (PPPY) budget impact when ACH reduction rates were set to 50%, 75%, and 100% of their respective base-case values. The frequency of SMBG testing among MDI users was also explored.
Given that this budget impact analysis evaluates three distinct diabetes treatment populations, a two-way SA was also undertaken to examine the joint influence of varying CGM uptake (low, medium, and high adoption scenarios) and ACH reductions (50%, 75%, and 100% of base case) on overall budget impact across all treatment.
Results
CGM uptake
The estimated Medicaid population eligible for CGM is shown in Figure 1, while the estimated number of new CGM users is presented in Table 3. In total, 233,421, 470,483, and 711,230 more plan members were estimated to be using CGM in years 1, 2, and 3, respectively. Most new CGM users were expected to be using non-insulin therapies.
Estimated Number of Additional CGM Users by Diabetes Treatment
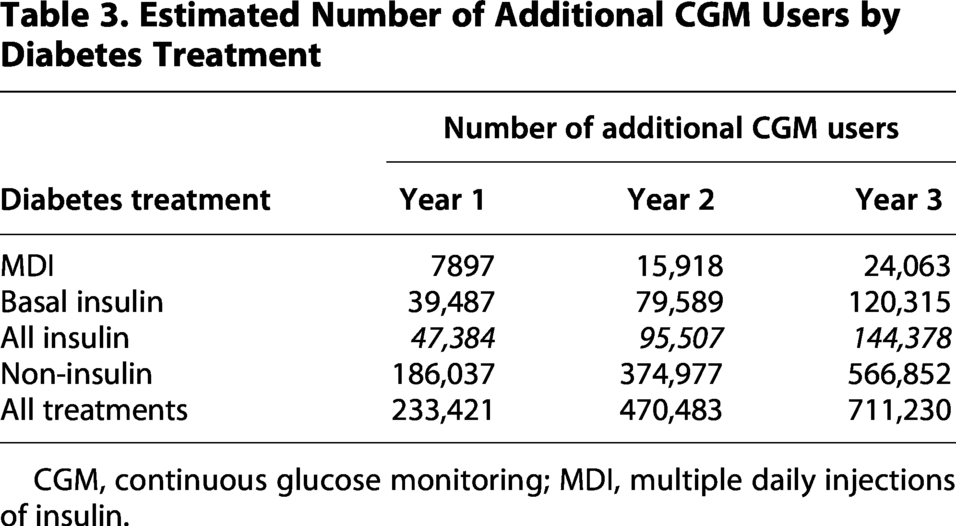
CGM, continuous glucose monitoring; MDI, multiple daily injections of insulin.
Cost per Medicaid beneficiaries living with T2D and initiating CGM
The budget impact of CGM per person per year is shown in Table 4. The annual acquisition cost of CGM was calculated to be $1921, which is partly offset by reductions in SMBG use.
Budget Impact Model Results, per Person Living with T2D and Initiating CGM
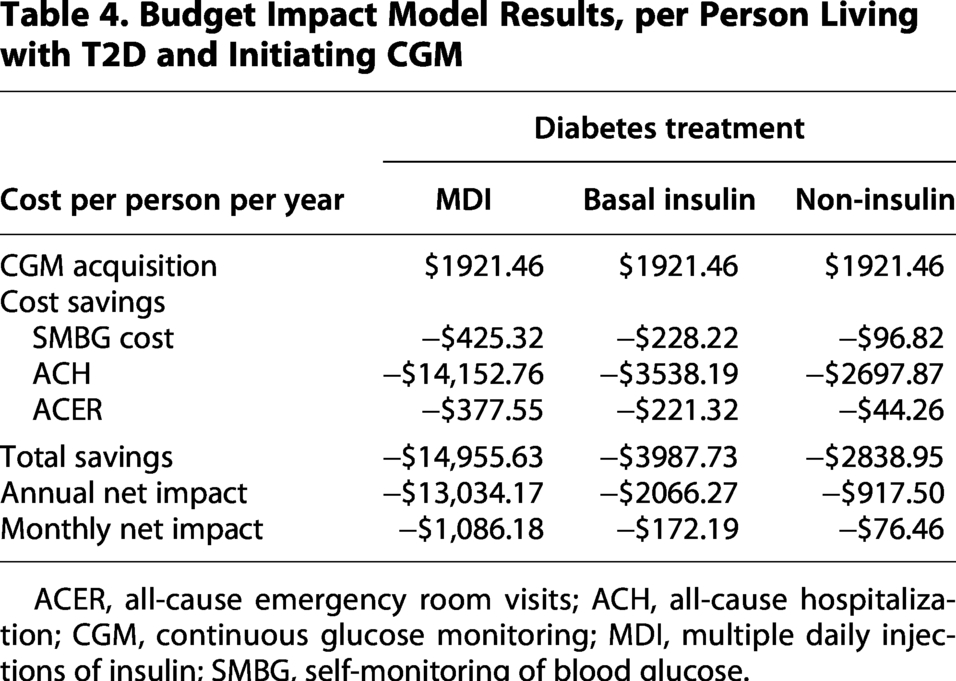
ACER, all-cause emergency room visits; ACH, all-cause hospitalization; CGM, continuous glucose monitoring; MDI, multiple daily injections of insulin; SMBG, self-monitoring of blood glucose.
Initiation of CGM was associated with reductions in ACH and ACER—in particular, the costs of ACH were reduced by $14,153, $3538, and $2698 among people living with T2D and using MDI, basal insulin, and non-insulin therapies, respectively.
As a result, the annual net budget saving of CGM for an individual with T2D was estimated to be $13,034, $2066, and $917 for MDI, basal insulin, and non-insulin therapy, respectively (Table 4).
Overall impact on Medicaid budget
From the perspective of a national Medicaid budget, increasing CGM use among people living with T2D and using insulin and expanding of CGM reimbursement to all patients with T2D, including those receiving non-insulin therapy, would be associated with net savings of $357 million in year 1, $719 million in year 2, and $1.088 billion in year 3 (Table 5). In per-member-per-month (PMPM) terms, the savings would be $0.41 in year 1, $0.83 in year 2, and $1.24 in year 3.
Budget Impact Model Results by Treatment, Medicaid Population

CGM, continuous glucose monitoring; MDI, multiple daily injections of insulin; PMPM, per member per month.
The estimated cumulative cost saving over 3 years was $2.164 billion. Cost savings were predicted in all treatment groups (Table 5). For plan members living with T2D and using MDI, cumulative savings were anticipated to be $624 million, with a $495 million saving seen among users of basal insulin. Among those using non-insulin therapies, $1.045 billion would be saved over 3 years.
Sensitivity analysis results
One-way SA showed that the model results were most sensitive to ACH event rates, particularly among people with T2D not using insulin, and to the cost of each hospitalization, CGM cost, and the prevalence of T2D (Fig. 2). Scenario analyses in which ACH reductions were attenuated to 50% or 75% of the base-case estimates continued to yield cost savings for both the MDI and basal insulin cohorts. In the non-insulin cohort, cost savings persisted under the 75% ACH-reduction scenario (ACH reduction of 0.13725 events per person-year), whereas the 50% scenario (ACH reduction of 0.0915 events per person-year) resulted in a $431 PPPY increase in costs (Table 6).

One-way sensitivity analysis results. CGM, continuous glucose monitoring; ER, emergency room; MDI, multiple daily injections of insulin; SMBG, self-monitoring of blood glucose; T2D, type 2 diabetes.
One-Way Sensitivity Analyses

ACH, all-cause hospitalization; MDI, multiple daily injections of insulin; PPPY, per patient per year; SMBG, self-monitoring of blood glucose.
Varying the frequency of SMBG testing in the MDI population had only a small effect on cost savings (Table 6). In scenario analyses with MDI users performing SMBG four times daily or once daily, the PPPY cost savings were $131 and $329, respectively.
Two-way SA further demonstrated that the MDI cohort consistently generated the greatest PMPM cost savings across the full range of ACH reduction assumptions and CGM uptake scenarios (Supplementary Table S1). Although the magnitude of savings was smaller, the budget impact analysis projected net cost savings for the basal insulin cohort across all modeled ACH reduction and CGM uptake scenarios. The non-insulin cohort produced net savings under the 75% and 100% ACH reduction scenarios but resulted in net cost increases under the 50% scenario. When results for all three treatment populations were aggregated, the overall budget impact was negative when ACH reductions were set to 75% or 100% of the base case, while net cost increases were seen when ACH reductions were reduced to 50% of the base case.
Discussion
This budget impact analysis was developed to estimate the financial impact from a Medicaid perspective of expanding reimbursement for CGM systems to people living with T2D who are using non-insulin therapies, including glucagon-like peptide-1 receptor agonists (GLP-1 RAs). The analysis estimated that the reductions in HCRU associated with CGM use would lead to cumulative cost savings of $2.2 billion over 3 years. ACH was identified as the major cost driver.
A general limitation of real-world studies of CGM use is the possibility of hidden biases. Sensitivity analysis found that the budget impact of expanded CGM reimbursement was sensitive to the ACH rate, particularly among people living with T2DM who were using non-insulin therapies. The ACH reduction estimates used in the model were derived from retrospective, single-arm, pre–post observational studies, which may limit generalizability to the broader Medicaid population; there is therefore some uncertainty regarding the magnitude of CGM-related reductions in health care utilization. Individuals who initiated CGM in these studies may represent a more motivated or health-engaged subgroup, potentially exhibiting stronger diabetes self-management behaviors, greater access to health care resources, or differing socioeconomic characteristics compared with the general Medicaid population. As a result, the ACH reductions observed in these studies may overestimate the reductions achievable at a population level, leading to potentially greater projected cost savings per CGM user.
The ACH reductions reported in observational studies and applied in this budget impact analysis are considerable. However, it is important to consider that Medicaid covers a substantial proportion of individuals with social and clinical vulnerabilities who are at elevated risk for poor diabetes outcomes. In such populations, even modest improvements in diabetes self-management can translate into large reductions in acute events and health care utilization. The HCRU reduction estimates for the MDI and basal insulin cohorts were drawn from large Managed Medicaid claims datasets encompassing 35,367 adults with T2D using MDI and 9574 using basal insulin, 13 while the non-insulin cohort estimates were based on data from 6984 Managed Medicaid beneficiaries. 28 The size and representativeness of these samples do suggest that the observed HCRU reductions should be generalizable to the broader Medicaid population.
Although the one-way SA showed cost increases among non-insulin users when ACH reductions were reduced to 50% of the base case, cost savings persisted at 50% ACH reductions for the MDI and basal insulin cohorts and at 75% of base-case reductions for the non-insulin cohort. While CGM use may initially be associated with increased detection of hypoglycemia or glycemic variability, it is also possible that individuals who opt in to CGM use are already managing their diabetes more effectively than those who do not. Additional research evaluating the real-world impact of prescribing CGM devices specifically within Medicaid populations would help refine these estimates and improve understanding of the true budgetary implications.
A particular strength of this analysis is the fact that the reductions in ACH/ACER were estimated using direct evidence from real-world studies of people in the USA living with T2D and using CGM. There are also advantages to incorporating evidence from observational studies, particularly in this context, because the outcomes of interest are closely tied to real-world diabetes self-management behaviors. These behaviors can be difficult to measure accurately in controlled trial settings, where financial or study-related incentives may unintentionally influence intrinsic motivation and confound the observed effects of CGM on day-to-day decision-making.35,36 There is growing evidence that CGM use can facilitate meaningful behavioral change and promote greater engagement in diabetes self-management, 37 which may strengthen over time; accordingly, the reductions in ACH and ACER events observed in the first year after CGM initiation may underestimate longer-term benefits.
Another consideration regarding ACH reductions is the possibility that the full benefits of CGM may take several years to realize. Several randomized controlled trials and large, retrospective, observational studies in non-insulin-treated patients with T2D reported rapid reductions in HbA1c in the first 3–6 months of CGM initiation.15,16,19,29,38 However, those reductions in HbA1c may take longer than 1 year to have an impact on serious outcomes such as ACER and ACH. To explore this, we evaluated a scenario in which ACH reductions were phased in gradually, assuming that individuals would achieve 50% of the base-case reduction during the first year of CGM use, 75% in year 2, and 100% in year 3. The phased-in scenario produced a modest budget increase in year 1, followed by net cost savings in years 2 and 3 as the full ACH-reduction effect was realized (data not shown), suggesting an overestimation with the base-case assumptions.
An alternative possibility is that because this budget impact analysis modeled ACH and ACER event rates using data from the first year following CGM initiation, the estimated impact may be conservative. If ACH reductions increase further in the second and third years of CGM use, the analysis may underestimate the number of hospitalizations prevented by CGM relative to SMBG, as improvements in glycemic control—and the resulting reductions in acute and chronic complications—typically accrue over a longer time horizon.39,40
The overall cost savings in the budget impact are driven by two primary factors: the PPPY cost savings and the size of population utilizing CGM within each diabetes treatment group. Although the MDI cohort demonstrates the greatest PPPY cost savings, its contribution to the total budget impact is smaller because it represents a comparatively limited share of the Medicaid T2D population. By contrast, individuals whose T2D is managed without insulin exhibit smaller PPPY savings but comprise the largest group of CGM users, thereby exerting the greatest influence on overall cost outcomes. Notably, CGM use among Medicaid beneficiaries with T2D on MDI has grown by approximately 5% of its population per year over the past 2 years. Therefore, modeling a 1% annual increase in this analysis is a conservative assumption relative to recent adoption trends, resulting in a conservative cost saving.
Another consideration is the cost offsets associated with discontinuing SMBG once CGM is adopted. In this scenario, we assumed that individuals in the MDI cohort perform SMBG six times per day; however, real-world testing frequency may be lower. Reduced SMBG use prior to CGM initiation would decrease the associated cost offsets, as fewer SMBG supplies would be avoided. However, given the overall magnitude of CGM-related savings in the MDI cohort, variation in SMBG testing frequency had minimal influence on the total annual budget impact.
Costs that are not considered in this model include other outpatient visits such as those for reviewing and interpreting CGM data, diabetes education, and training on how to use CGM. Assuming even an additional $200 PPPY cost for these outpatient visits would still result in PPPY cost savings across all three treatment groups.
Previous studies have shown that CGM (compared with SMBG) reduces HCRU and costs in Medicaid beneficiaries with T2D using insulin.4,13,14 Frank et al. reported a cost saving of $101 PPPY among Medicaid beneficiaries with T2D receiving intensive insulin therapy. 4
Our study shows that each new prescription of CGM is expected to reduce overall costs, and that expanding CGM access to all Medicaid beneficiaries living with T2D and using non-insulin therapies would be cost saving from year 1. The reductions in long-term complications associated with CGM use mean that savings due to reduced HCRU are likely to increase over time.
Our findings are consistent with studies in France and Canada, which showed reductions in HCRU and costs associated with CGM compared with SMBG in people with T2D receiving non-insulin therapy.20–22 An analysis of the French Système National des Données de Santé reimbursement claims database found initiation of CGM to be associated with a 65% reduction in hospitalization due to ADEs among people living with T2D and using insulin secretagogues without insulin. 20 Similarly, in Ontario, Canada, emergency department visits and hospitalization among people living with T2D on oral therapy only have been found to be statistically significantly reduced after CGM acquisition. 21 In addition, a Canadian cost-effectiveness analysis has shown CGM to be dominant to SMBG over a 25-year time horizon for people living with T2D treated with MDI, basal insulin, or non-insulin therapies. 22
This analysis was based on reductions in ACH and ACER over short follow-up periods. An alternative approach to estimating the impact of CGM on health care costs is to use economic modeling based on the well-studied relationships between CGM use and mean HbA1c level15–19 and between mean HbA1c level and diabetes-related complications and costs.41,42 A number of recent studies have used this approach. The study most relevant to the Medicaid system is a recent cost-effectiveness study conducted using the Determination of Diabetes Utilities, Costs, and Effects model.14,43 Among patients with T2D receiving basal insulin therapy, CGM was dominant to SMBG over a 10-year time horizon, meaning that more quality-adjusted life years were generated at a lower cost. The $10,456 increase in glucose monitoring costs was offset by a $12,127 reduction in the cost of treating ADEs and complications. 14 The cost effectiveness of CGM has also been studied in Canada using a similar approach. 22 As in the Medicaid analysis, CGM was dominant to SMBG (over a 25-year time horizon) for people with T2D receiving basal insulin therapy, as well as for those using MDI or non-insulin therapies. 22
Our analysis has some limitations. First, the rate of uptake of CGM is uncertain, so while the impact of the technology will be to reduce Medicaid costs, the exact budget impact is somewhat unclear. Second, cost savings resulting from long-term improvements in glycemic control may be underestimated because the studies that informed HCRU in our analysis had limited follow-up periods, which are unlikely to have captured diabetes complications that manifest in the longer term. Third, detailed modeling of all possible non-insulin treatment combinations was not feasible. However, people living with T2D using either GLP-1 RAs or oral therapies showed similar improvements in HbA1c following CGM use in the FRONTIER study. 21 The estimates included in our analysis are therefore likely to be broadly applicable to the population of Medicaid beneficiaries living with T2D and using non-insulin therapies. Fourth, as described above, the possibility of hidden biases in real-world studies introduces assumptions into the analysis. Fifth, state Medicaid programs vary widely in budget constraints, population size and demographics, reimbursement policies, CGM coverage criteria, underlying diabetes burden, and both HCRU and CGM costs. These differences may result in substantial deviations from the national average estimates used in this budget impact analysis. As a result, the assumptions applied here may not fully reflect the circumstances faced by certain treatment groups within specific states. Although individual Medicaid programs will need to assess the extent to which their covered populations align with these national averages, this analysis incorporated extensive sensitivity testing across a broad range of parameter values to account for such heterogeneity and to evaluate the robustness of the findings.
Conclusions
At $14,742 per event among people living with T2D, ACH is the major cost driver for the Medicaid budget. Increasing CGM use by Medicaid beneficiaries with T2D, including those on non-insulin therapy, resulted in cost savings from the perspective of Medicaid in the USA. These findings support the expansion of CGM access to Medicaid beneficiaries living with T2D using any diabetes therapy.
Authors’ Contributions
E.E.W.: Conceptualization, methodology, and writing—review and editing. J.R.G.: Conceptualization, methodology, and writing—review and editing. J.R.R.: Conceptualization, methodology, and writing—review and editing. A.L.: Conceptualization, methodology, formal analysis, and writing—review and editing. Y.P.: Conceptualization, methodology, writing—review and editing, and supervision and project administration.
Data Availability Statement
Data sharing is not applicable to this article, as no datasets were generated or analyzed during the current study.
Footnotes
Acknowledgments
This study, the preparation of the article, and publication fees were funded by Abbott. Medical writing support was provided by Dr. Paul Overton (Beacon Medical Communications Ltd, Brighton, UK) in accordance with Good Publication Practice (GPP 2022) guidelines and was funded by Abbott.
Author Disclosure Statement
E.E.W. is an advisor, consultant, and speaker for Abbott Diabetes Care. J.R.G. is an advisor, consultant, and speaker for Abbott Diabetes Care. J.R.R. is a consultant for Abbott Diabetes Care. A.L. and Y.P. are employees and shareholders of Abbott and were involved in the selection of assumptions, data sourcing, and model construction.
Funding Information
This study, the preparation of the article, and publication fees were funded by Abbott.
Supplemental Material
Abbreviations Used
References
Supplementary Material
Please find the following supplemental material available below.
For Open Access articles published under a Creative Commons License, all supplemental material carries the same license as the article it is associated with.
For non-Open Access articles published, all supplemental material carries a non-exclusive license, and permission requests for re-use of supplemental material or any part of supplemental material shall be sent directly to the copyright owner as specified in the copyright notice associated with the article.