




Abstract
This article develops and describes rigorous oil and gas project forecasting methods. First, it builds a theoretical foundation by mapping megaproject performance literature to these projects. Second, it draws on heuristics and biases literature, using a questionnaire to demonstrate forecasting-related biases and principal-agent issues among industry project professionals. Third, it uses methodically collected project performance data to demonstrate that overrun distributions are non-normal and fat-tailed. Fourth, reference-class forecasting is demonstrated for cost and schedule uplifts. Finally, a predictive approach using machine learning (ML) considers project-specific factors to forecast the most likely cost and schedule overruns in a project.
Keywords
Introduction
This work applies machine learning (ML) to megaproject forecasting to improve cost and time performance planning. Megaprojects account for enormous investments, amounting to a substantial portion of the world's gross domestic product (GDP) (Flyvbjerg, 2014) and their key performance metrics are planned versus actual time, cost, and benefits. High cost and time overruns and benefit shortfalls are pervasive and chronic. Flyvbjerg (2014) estimates that only one in 1,000 megaprojects meets all three targets. Flyvbjerg et al. (2003) studied 258 global projects amounting to about US$90 billion and found an average 28% cost overrun; 9 out of 10 transportation projects were affected. Significant overruns plague infrastructure megaprojects (Flyvbjerg et al., 2018), big dams (Ansar, Flyvbjerg & Budzier, 2014), and big IT projects (Flyvbjerg & Budzier, 2011).
The primary goal of our study was to verify if ML can lead to better forecasting. Accurate cost and schedule estimations are challenged by complexity, principal-agent issues, and behavioral biases. We first investigated if these issues, which result in underestimated schedules and budgets, are present in industrial megaprojects. Having verified this, we verified if ML can be applied to effectively predict corrective project-specific cost and schedule uplifts using project features underlying misestimation.
Our work will contribute to the incipient body of knowledge on ML application to projects. Complexity and limited datasets make ML application to megaprojects challenging. Our ML models address this by building on reference class forecasting (RCF) methodology and predicting expected overruns from identified project features. There are distinct viewpoints on heuristics for decision-making under complexity with implications on the place of ML: one sees them favorably and the other emphasizes cognitive limitations. Along with their practical significance, our results are significant to the balance between expert judgment and ML. In our conclusion, we discuss how to combine their strengths, which can guide ML applications to projects beyond our specific application.
We begin by introducing the chosen case, offshore oil and gas (O&G) projects. We build the theoretical framework, based on which the research questions are formally stated as hypotheses and research methods are derived. We build on the theoretical grounding and demonstrate the presence of bias in industrial megaproject forecasting using a questionnaire sent to 26 O&G project managers, one-half each from O&G companies and offshore EPC contractors. This is an important indicator of the potential and place of ML in advancing industrial megaproject management, which is then demonstrated through application. We methodically collected cost and schedule data for a large sample of commissioned offshore O&G projects from public and secondary data. This dataset was used to establish the extent of cost and schedule overruns in O&G offshore projects, demonstrate their fat-tailed non-normal distribution, and identify features that affect performance. The research results are discussed at length, followed by the conclusion, which summarizes our findings, discusses limitations, and identifies several interesting results for future research.
The Problem
Industrial megaprojects account for substantial and growing investments (Merrow, 2011). O&G megaprojects are challenging industrial megaprojects with high upfront investments for long-term returns in uncertain, complex socioeconomic-technical environments (Raval, 2020), and a track record of time, cost, and benefit underperformance (Merrow, 2012). Project portfolio selection and execution efficiency are core strategies for O&G companies (Singh, 2010), as for any sector where revenue-generating assets are created through megaprojects. Offshore project investment decisions amounted to US$92 billion in 2019, peaking at US$217 billion in 2011 (Rystad Energy, 2020). Underperformance has wider consequences. Cost overruns caused a 38% single-day tumble in an offshore EPC contractor's share price (Upstream, 2002). Schedule overruns cause significant financial losses (Caron & Ruggeri, 2016). In one project, severe overruns toppled both the oil company's board and the main contractor's top management (Upstream, 2000). Costs from a Norwegian project with massive overruns were transferred to taxpayers via tax deductions and state investments.
Theoretical Framework
The theoretical foundation intersects several streams of project performance research requiring extensive literature review. Furthermore, it is at the confluence of megaprojects, statistics, and ML, accentuating the transdisciplinary nature of management and organization studies (Denyer & Tranfield, 2009). Denicol et al. (2020) used a systematic literature review and filtering process to explore the causes of and cures for poor megaproject performance. The concepts they extracted were: (1) decision-making behavior; (2) strategy, governance, procurement; (3) risk and uncertainty; (4) leadership capability; (5) stakeholder engagement/management; and (6) supply-chain integration and coordination. As they discussed, currently, no overarching theory unites them. However, our systematic data collection allowed us to map these concepts, representing the body of megaproject research, to project performance. The framework illustrated in Figure 1 relates these concepts to factors we found to affect forecasting and overruns: decision-making behavior during planning and emergence of unplannable outcomes with inadequate response during execution. These concepts and factors, expatiated below, are systematically connected to our research methods and subsequently to research findings.

Concept mapping to performance factors.
Complexity
Megaprojects are temporary organizations (Lundin & Söderholm, 1995) characterized by uncertainty (Denicol et al., 2020) and complexity (Baccarini, 1996). They display the hierarchy, inter-connectedness, emergence, sensitivity to initial conditions, and phase transition associated with complexity. Complex systems can display emergent and chaotic behavior (Hitchins, 2007). Emergent behavior is highly nonlinear, state-dependent, challenging to forecast, and can change rapidly (Warren, 2008). Chaotic behavior from high sensitivity to initial conditions makes theoretically deterministic outcomes practically unpredictable (Werndl, 2009). Chaotic behavior has been related to cost overruns in offshore O&G projects due to complex interactions and high exposure to change (Olaniran et al., 2015). Complexity engendered positive feedback and sudden phase change were observed in projects with extreme overruns from our dataset. Sometimes this results in black swans—high impact unpredictable events associated with complexity and characterized by retrospective sensemaking (Taleb, 2008).
Extreme Values
While extreme, outliers are significant to statistical analysis of overruns (Flyvbjerg et al., 2018). Flyvbjerg (2006) showed how cost outrun distributions for several infrastructure project classes were non-normal and significantly weighted toward overrun, with fat tails containing significant outliers. Similarly, Flyvbjerg and Budzier (2011) found that one-sixth of 1,471 IT projects they studied were black swan fat-tail outliers, with an average 200% cost and 70% schedule overrun. Project classes displaying “regression to the tail” (Flyvbjerg, 2020, p. 2) are susceptible to ever-larger tail risks, signifying outlier salience.
Randomness measures such as the normal distribution cannot effectively describe systems incorporating bias-prone human heuristics (Taleb, 2008). Power laws can describe fat-tailed distributions containing black swans, as demonstrated for IT project cost and schedule overrun distributions by Budzier and Flyvbjerg (2013), evidentiary for similar generating mechanisms as the rest of the distribution. This implies that black swan probability is similar in several more projects than those few in which they manifest, making individual outliers unpredictable (Sornette, 2009). Some extreme outliers lie beyond power laws, which Sornette (2009) calls dragon-kings, relating them to high degrees of coupling that amplify emergent outcomes, causing phase transition. The Thunderhorse offshore platform from our dataset exemplifies this. The interaction between a single valve installed backward—a small design error in the hydraulic system—and a hurricane just before delivery almost sank it, resulting in catastrophic cost and schedule overruns (Wright, 2009).
Responsiveness
Control-based approaches are inadequate for complex, interconnected projects (Remington & Pollack, 2008). Ackoff (1981, p. 22) saw complex situations as “messes,” limiting definite solutions. Emergent changes and black swans require flexibility and responsiveness. Complex projects are often characterized as complex adaptive systems (CAS) (Whyte, 2016).
Heuristics and Biases
Megaprojects are complex systems characterized by uncertain, contested information from several directions (Bruijn & Leijten, 2007). Heuristics can be effective and necessary for forecasting in such environments (Gigerenzer & Brighton, 2011). However, human rationality is limited by cognitive constraints, available information, and time (Simon, 1956), famously labeled bounded rationality by Herbert Simon. Furthermore, Kahneman and Tversky (1979) demonstrated how inside view forecasting using heuristics can be subjective and biased (Kahneman, 2012). This caused paradigm shifts in several fields, including megaproject management (Flyvbjerg et al., 2018) and was rigorously replicated by an international team of researchers recently (Ruggeri et al., 2020). We interpret bounded rationality in the context of complex megaprojects in Figure 2.
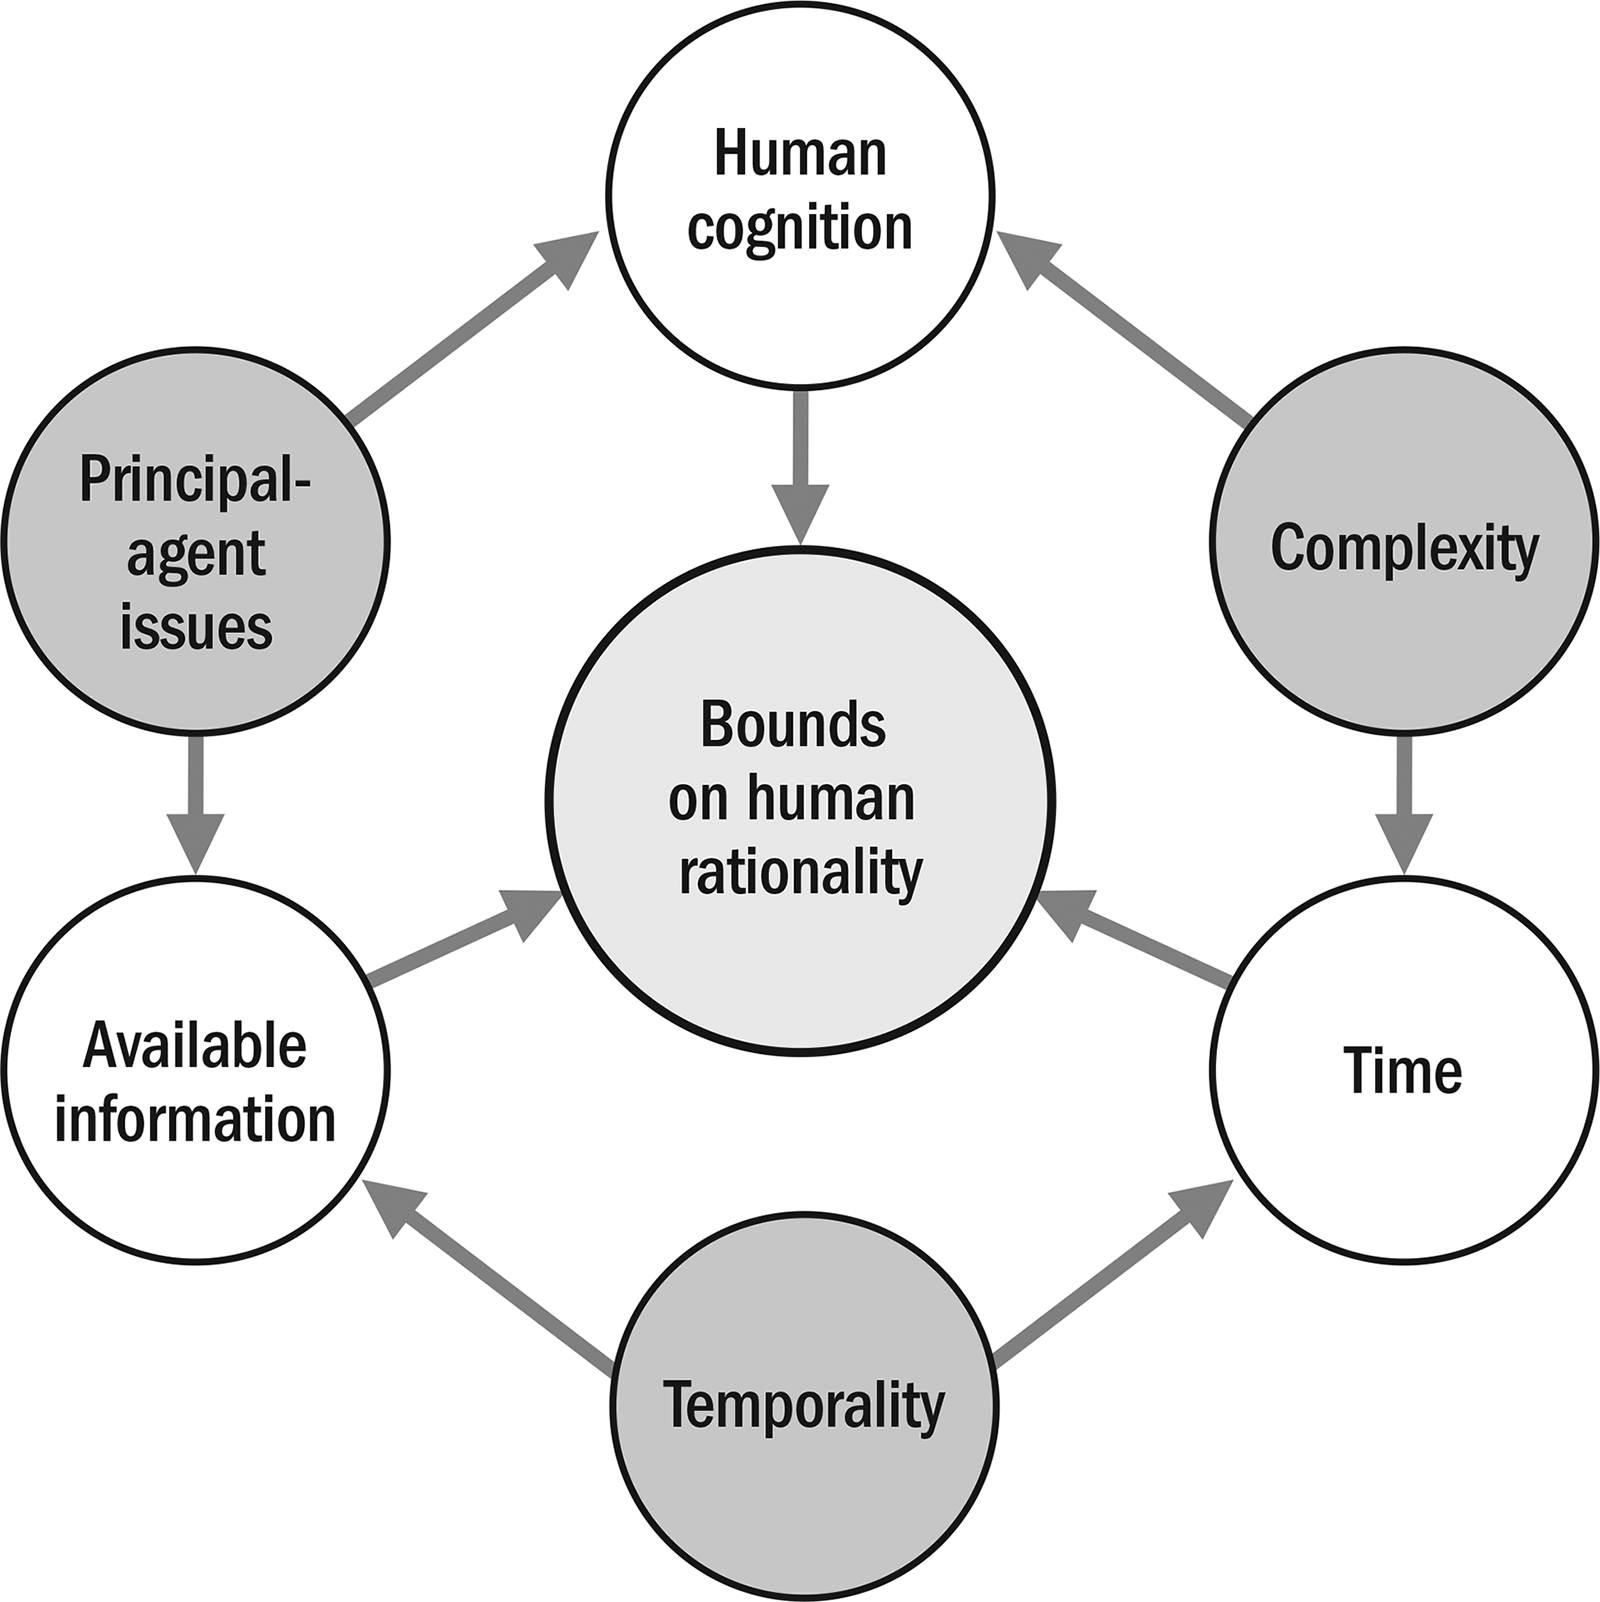
Bounded rationality in complex projects.
Human forecasting exhibits inconsistencies and inadequate consideration of predictability or prior probability (Tversky & Kahneman, 1974). Interpretation of distributional information is prone to biases such as affirmation bias, hindsight bias, and the narrative fallacy of fitting events into simplified, incorrect narratives (Kahneman, 2012). Optimism bias in project forecasting was dubbed the “planning fallacy” and related to the tendency to neglect distributional data by Kahneman and Tversky (1979).
Megaprojects are interorganizational (Sydow & Braun, 2018) temporary meta-organizations of contractually related independent firms with misaligned incentives, asymmetric accountability, and power (Clegg et al., 2017; Lundrigan et al., 2015), challenged by stakeholder conflicts (Locatelli et al., 2014). EPC project complexity is managed by decomposition into subprojects delivered by specialist contractors, making interfaces critical (Davies & Mackenzie, 2014). Typically, O&G companies use EPC contractors to deliver offshore projects using specialist subcontractors (Lee, 2019). Principal-agent conflict across contractual networks is a key project governance problem (Müller, 2009).
Principal-agent issues, optimism, and behavioral biases often result in significant “inside view” underestimations (Flyvbjerg et al., 2018). The causes have been related to “deception” or “strategic misrepresentation” due to misaligned incentives and “delusion” from cognitive biases (Flyvbjerg et al., 2009). Inadequate accountability and risk-sharing mechanisms incentivize cost underestimation and benefit exaggeration (Flyvbjerg, 2014).
Forecasting
Complex projects require decomposition and definition for stability (Remington & Pollack, 2008). O&G projects typically follow a phase-gate approach; a front-end process develops budget and schedule baselines before project approval at final investment decision (FID). A three-stage process (see Figure 3), where estimates are progressively elaborated, is discussed in Merrow (2011) and was present in several projects we investigated. Cost and time overrun measurements require consistent baselines (Flyvbjerg et al., 2018). In our study, the FID budget and schedule define the “budget at the time of decision to build” discussed by Flyvbjerg et al. (2018, p. 175). Overruns are measured between this baseline and actual cost and time at delivery. Scope changes that materially affected projects were baselined to the FID budget and schedule.
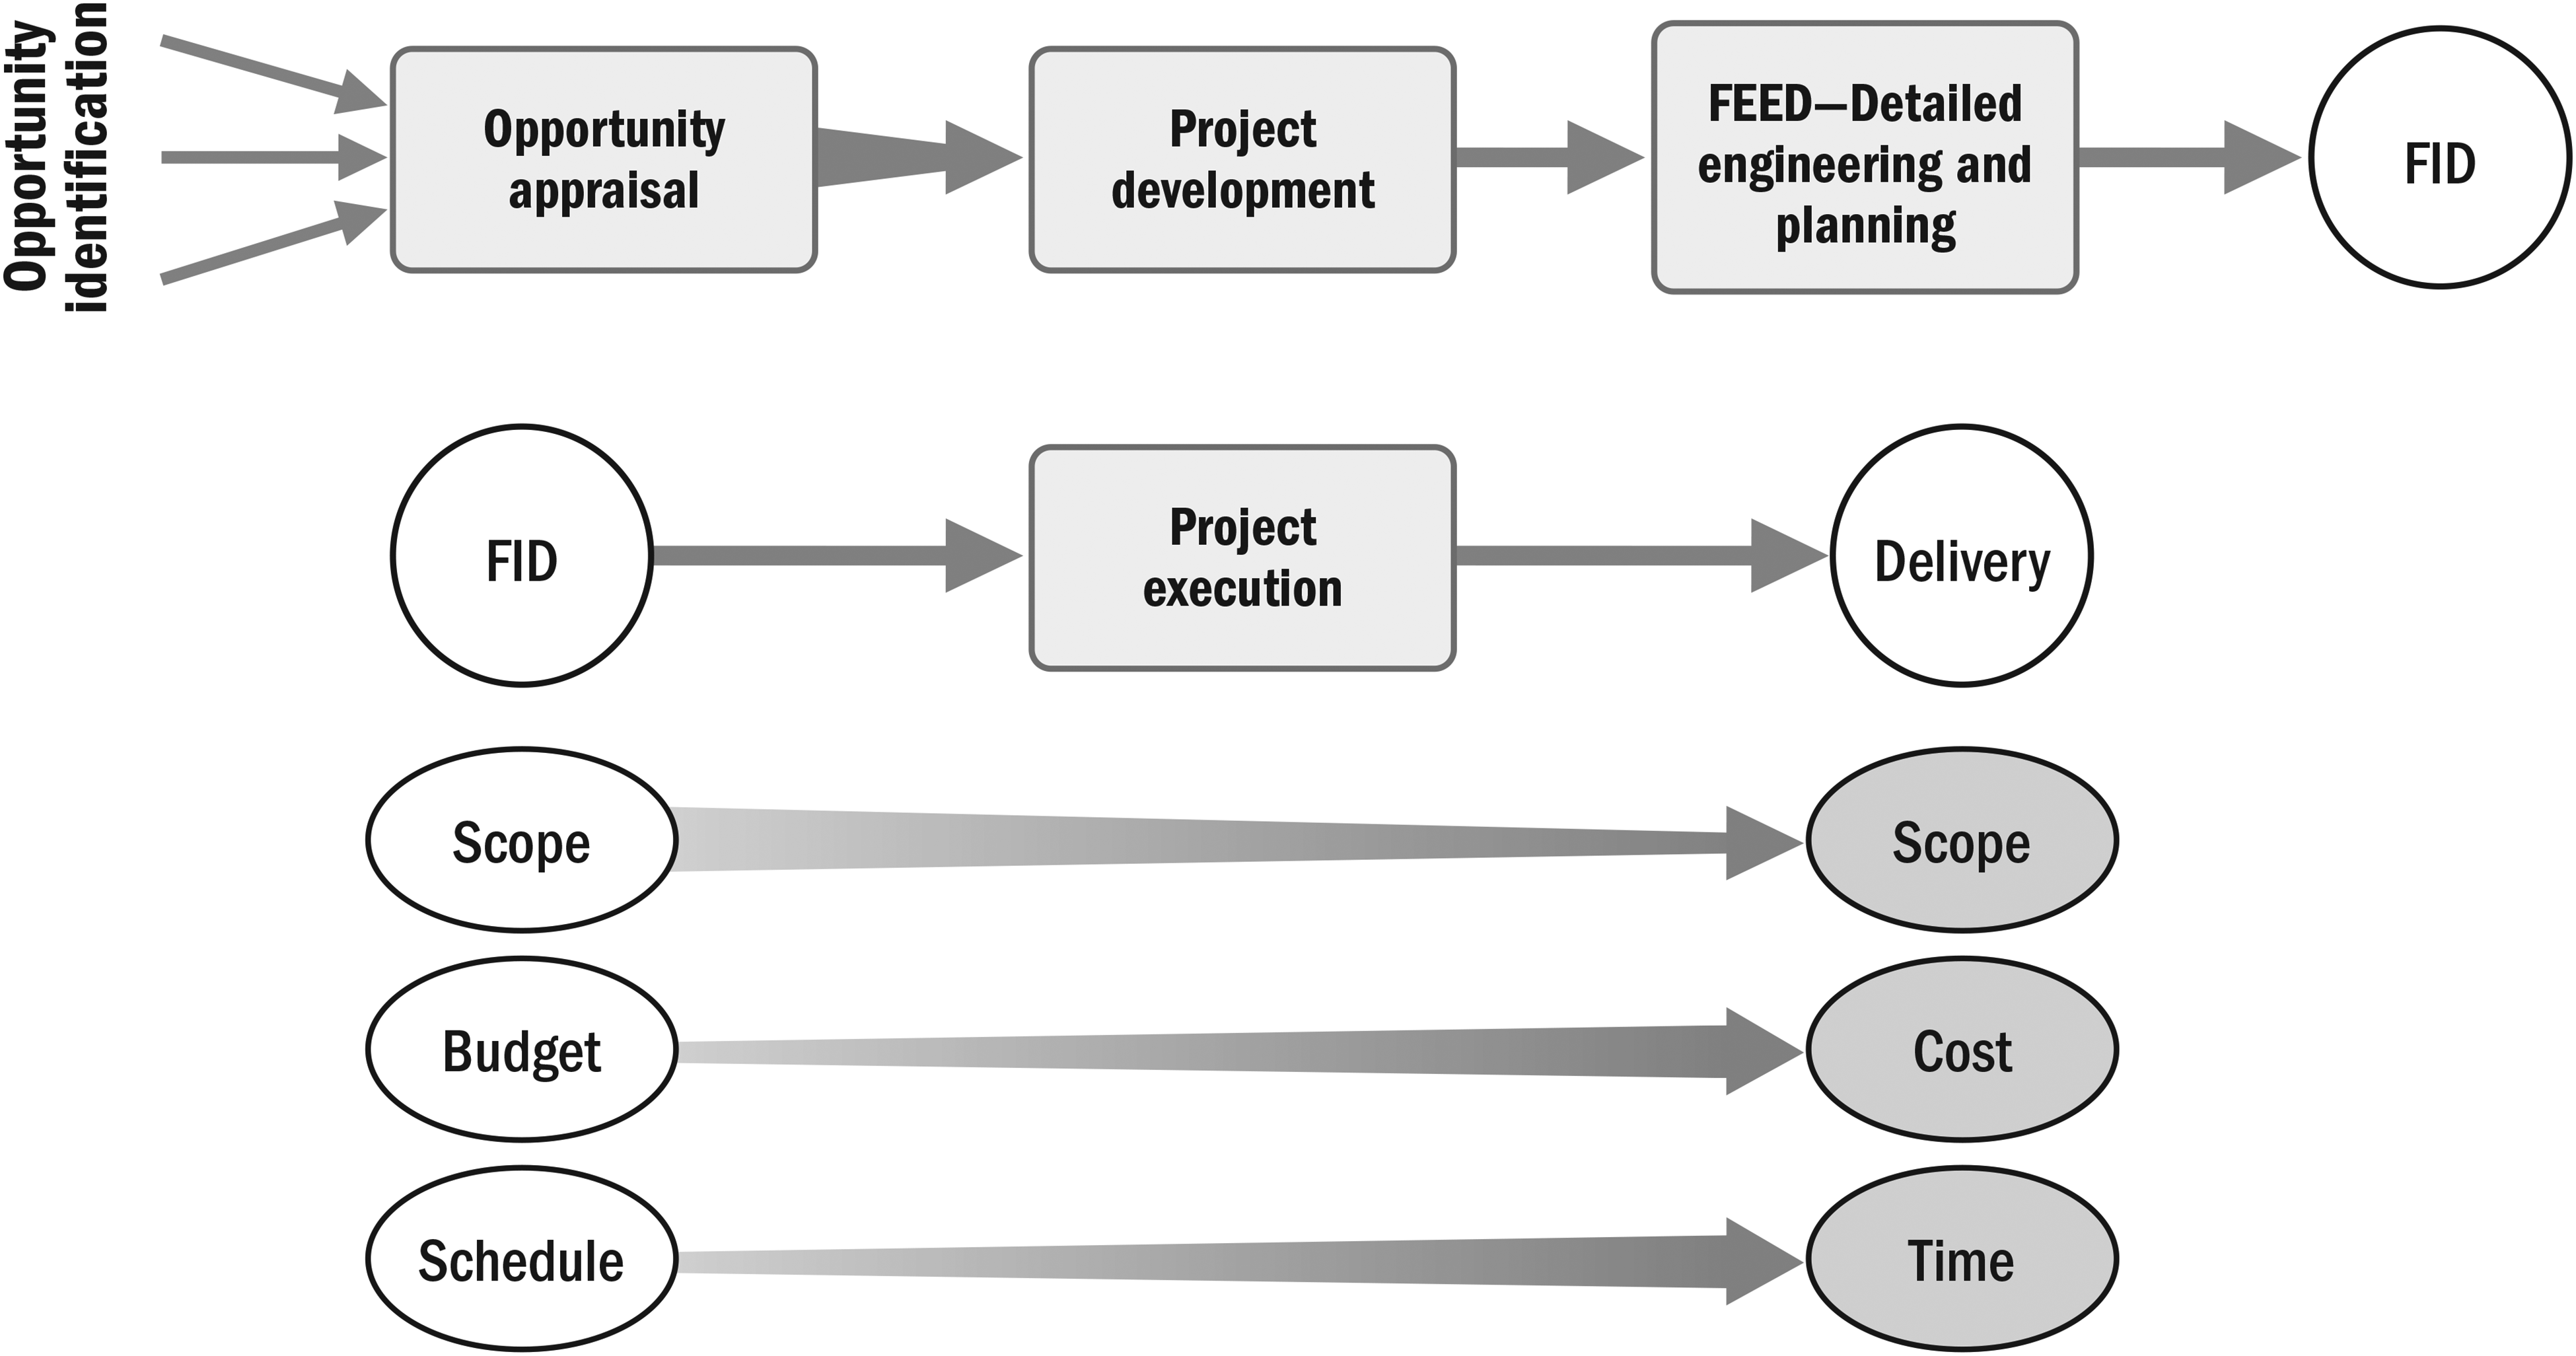
Front-end approach to FID (based on Merrow, 2011, p. 24) and performance deviation measurement.
Overrun risk is a key FID input. Probability quantifies uncertainty (Goodfellow et al., 2016). Hubbard (2009) defines “strict uncertainty” as possible outcomes with unknown probabilities and risk as the probability of undesirable outcomes. While complexity engendered unknowns limit forecastability, forecasting reduces risk and improves with distributional data. Lovallo and Kahneman’s (2003) “outside view” approach to planning was adapted as RCF by using past project distributions to correct biased inside view forecasts for acceptable risk. Batselier and Vanhoucke (2016) demonstrated that RCF outperformed earned value management (EVM) and Monte Carlo simulation for both time and cost forecasting.
Machine Learning
Machine learning (ML) has revolutionized forecasting in several fields. Data-driven project planning using ML is a key recommendation in the Ernst & Young (EY) report on O&G megaprojects (Ernst & Young [EY], 2015). ML models learn by identifying and extracting patterns from data rather than having knowledge built into them (Goodfellow et al., 2016). A formal definition of ML from Mitchell (1997, p. 2) says: “A computer program is said to learn from experience E with respect to some class of tasks T and performance measure P, if its performance at tasks in T, as measured by P, improves with experience E.”
In our case, experience E is represented by the reference class distributional data, tasks T are cost and schedule uplift prediction, and the performance P is measured by deviation from actual outcomes. A trained ML model can predict project-specific uplifts from features indicative of biases, emergence, and response by learning correlations using project overrun distributions. This is fundamentally a realist approach to integrate inside view project information with the outside view using past project data. However, megaprojects are susceptible to high-impact emergence from complexity and length, and the “curse of dimensionality,” (Bellman, 2013, p. xxi) a phrase describing the rapid growth in problem difficulty with increasing features. There are a multitude of features with complex interrelationships that affect performance. Their limited number limits datasets. These factors make ML megaproject forecasting extremely challenging.
Research Hypotheses/Questions
In this section we develop the research hypotheses, which are summarized in Figure 4 at the end of the section. RCF improves forecasting accuracy by correcting underestimated forecasts using empirical benchmarking distributions from similar projects that constitute the reference class. However, industrial megaprojects, including O&G projects, are usually privately or market funded (Merrow, 2011) and managed by industry professionals. Merrow (2011) discusses how their tangible, measurable goals and profit motives result in incentivization structures that differ from public infrastructure projects, making them less prone to optimism bias and principal-agent issues. This leads to our first two hypotheses:
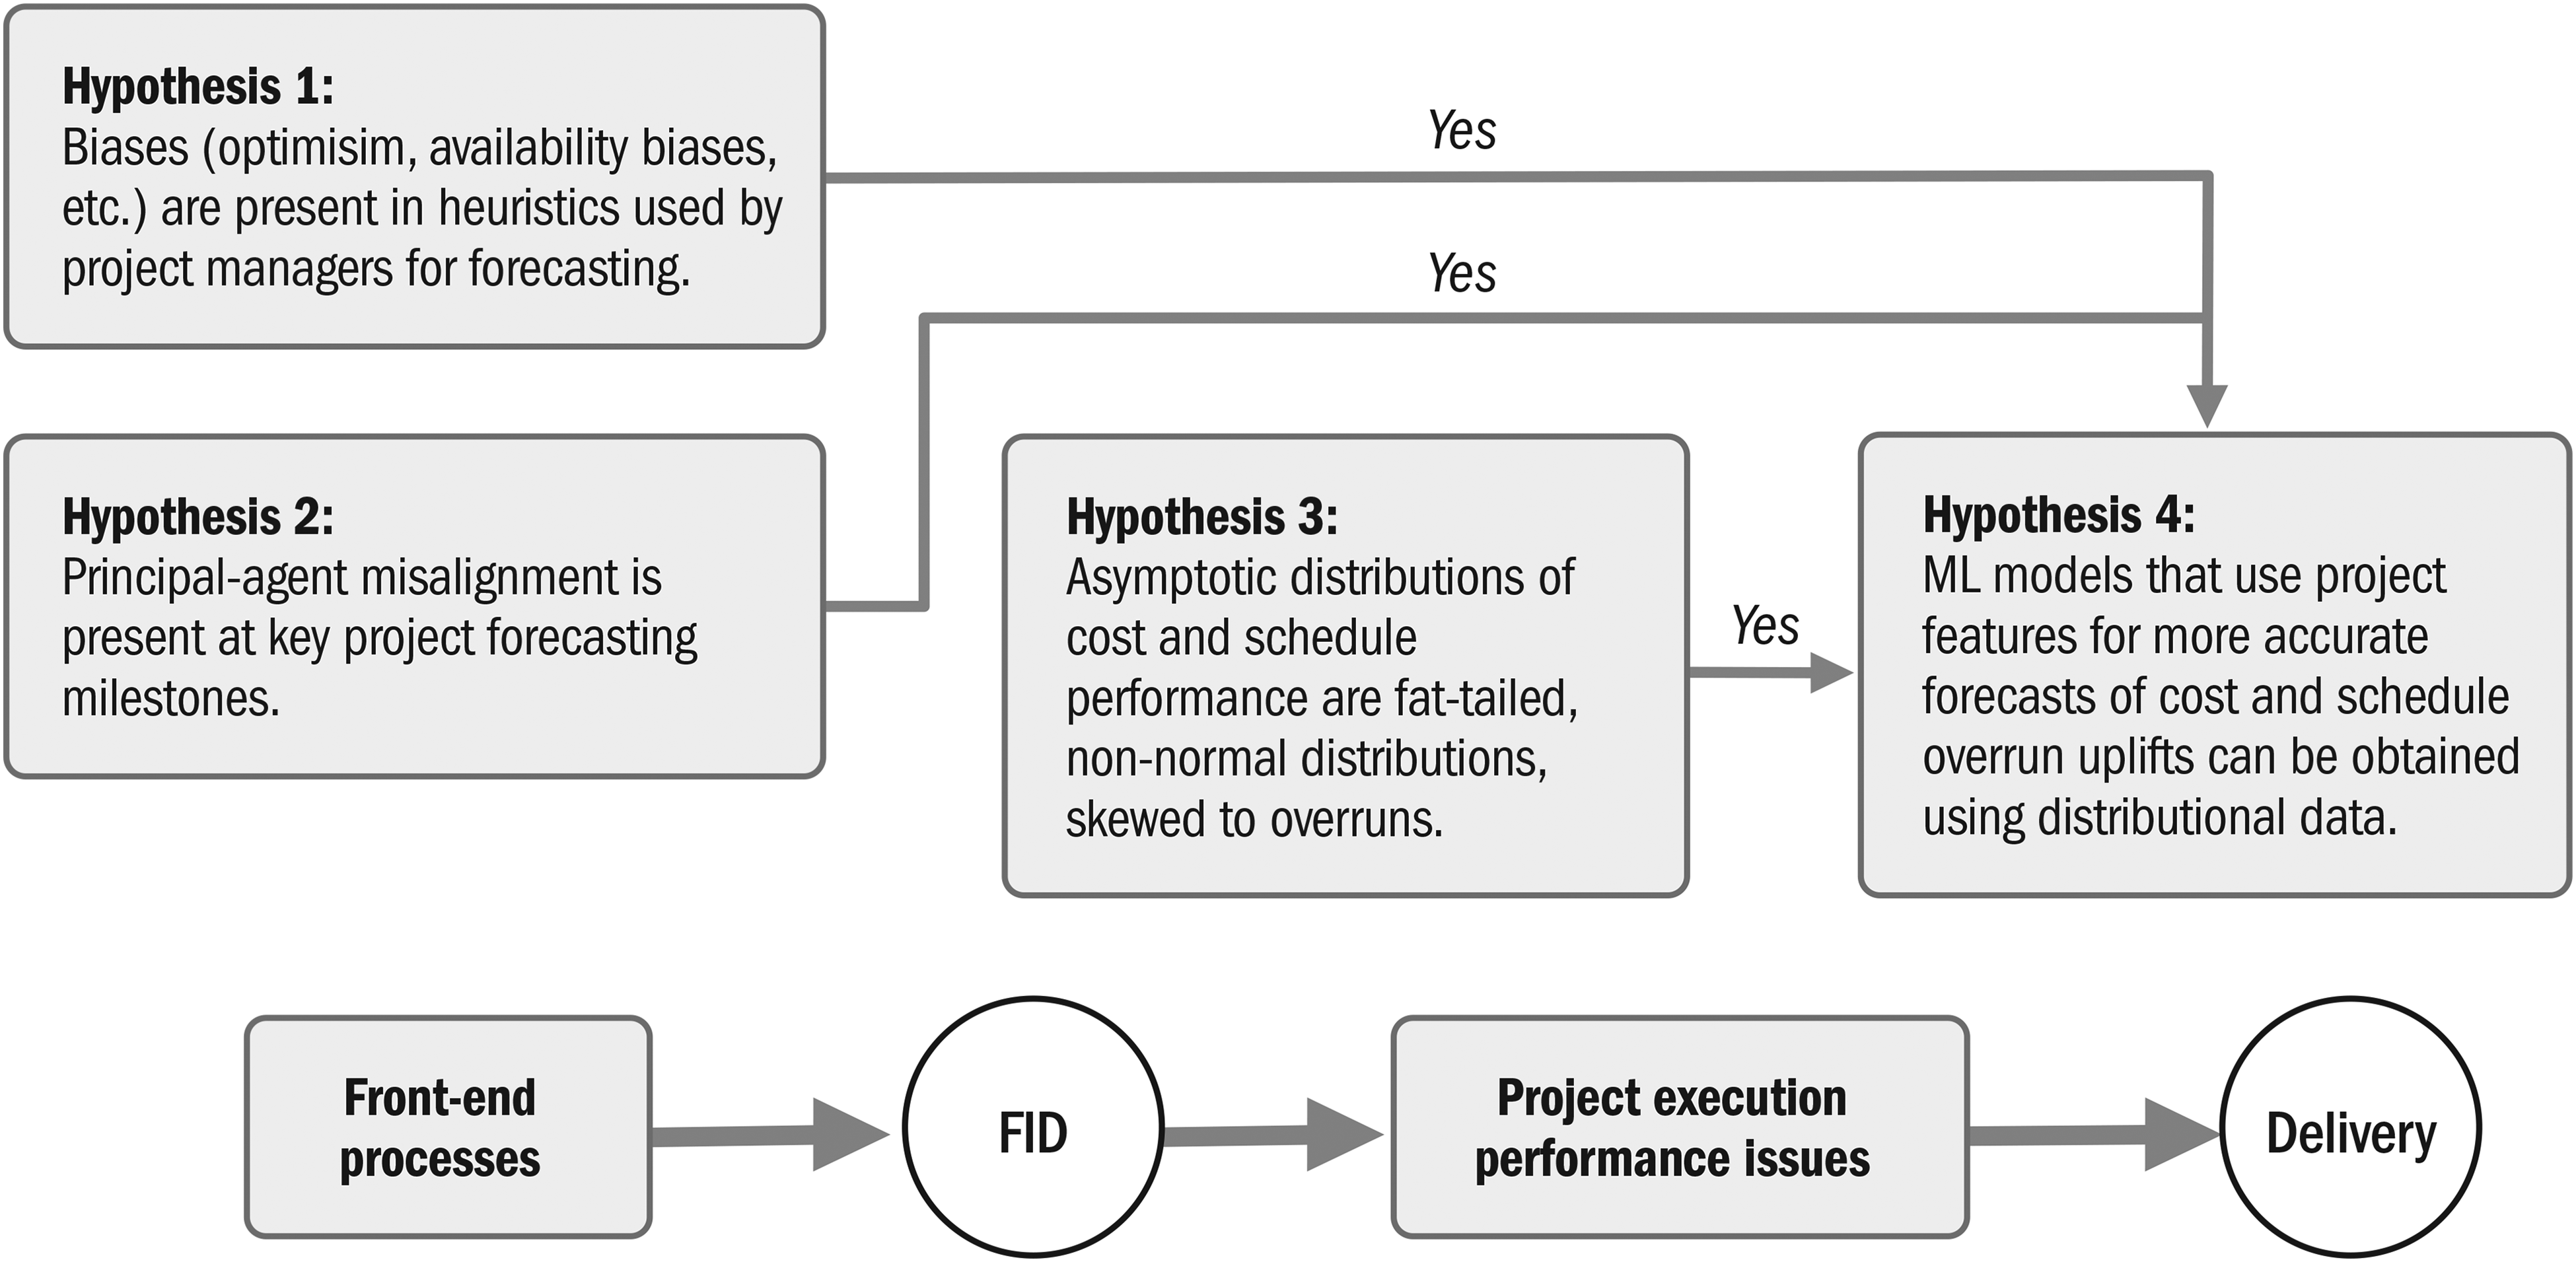
Conceptually linked hypotheses.
Biases, such as optimism and availability biases, are present in heuristics used by offshore industry project managers during forecasting.
Principal-agent misalignment affects offshore project cost and schedule forecasting.
RCF is predicated on the track record of a class of projects showing statistically significant overruns, thus we hypothesize:
Asymptotic distributions of cost and schedule performance outcomes are fat-tailed, non-normal distributions significantly skewed to overruns.
If both cost and schedule distributions show significant overruns, it is desirable to obtain both uplifts. However, if they are not sufficiently covariant, conventional RCF uplifts for both can be overly conservative. A project may have a higher propensity to cost or schedule overrun, affecting the uplift chosen for each.
RCF uses the entire reference class outcome distribution as a probability distribution applicable to any project in that class. However, O&G project performance has shown correlations with factors such as location, front-end detail, and novelty (Merrow, 2012; Rui et al., 2017). Therefore, the ability to identify and use such factors for more accurate project-specific forecasts is of interest. However, factor influences can be modified by other factors in complex ways. For instance, a detailed front-end, which has been correlated with better performance, is characteristic of international O&G companies (IOC), which conversely undertake more challenging projects(Merrow, 2011). Therefore ML, which outputs a model by learning from features and distributions, offers more potential than deterministic forecasting for complex projects, thus we hypothesize:
Generalized ML models can effectively forecast project-specific uplifts for both cost and schedule, using project features by learning from distributional data that are more accurate than conventional RCF.
Research Methods and Data Collection
Research Design
An offshore project is a temporary complex system for creating a complex system whose starting conditions are affected by cognitive biases and principal-agent issues; this limits epistemological questions of finding a definite schedule or budget. Ecological rationality refers to decision-making effectiveness, when bounded rationality is adapted to its environment (Todd & Gigerenzer, 2012). Our goal is to develop effective forecasting methods in the industry context while bound by complexity, available data, and analysis abilities. Distinct research and data collection methods, illustrated in Figure 5, were used for the hypotheses on biases and misalignment on one hand, and hypotheses on project performance on the other. The two hypotheses concerning biases and misalignment were validated using questionnaires, and the two hypotheses on project performance and its prediction were validated from our project dataset and ML model performance.
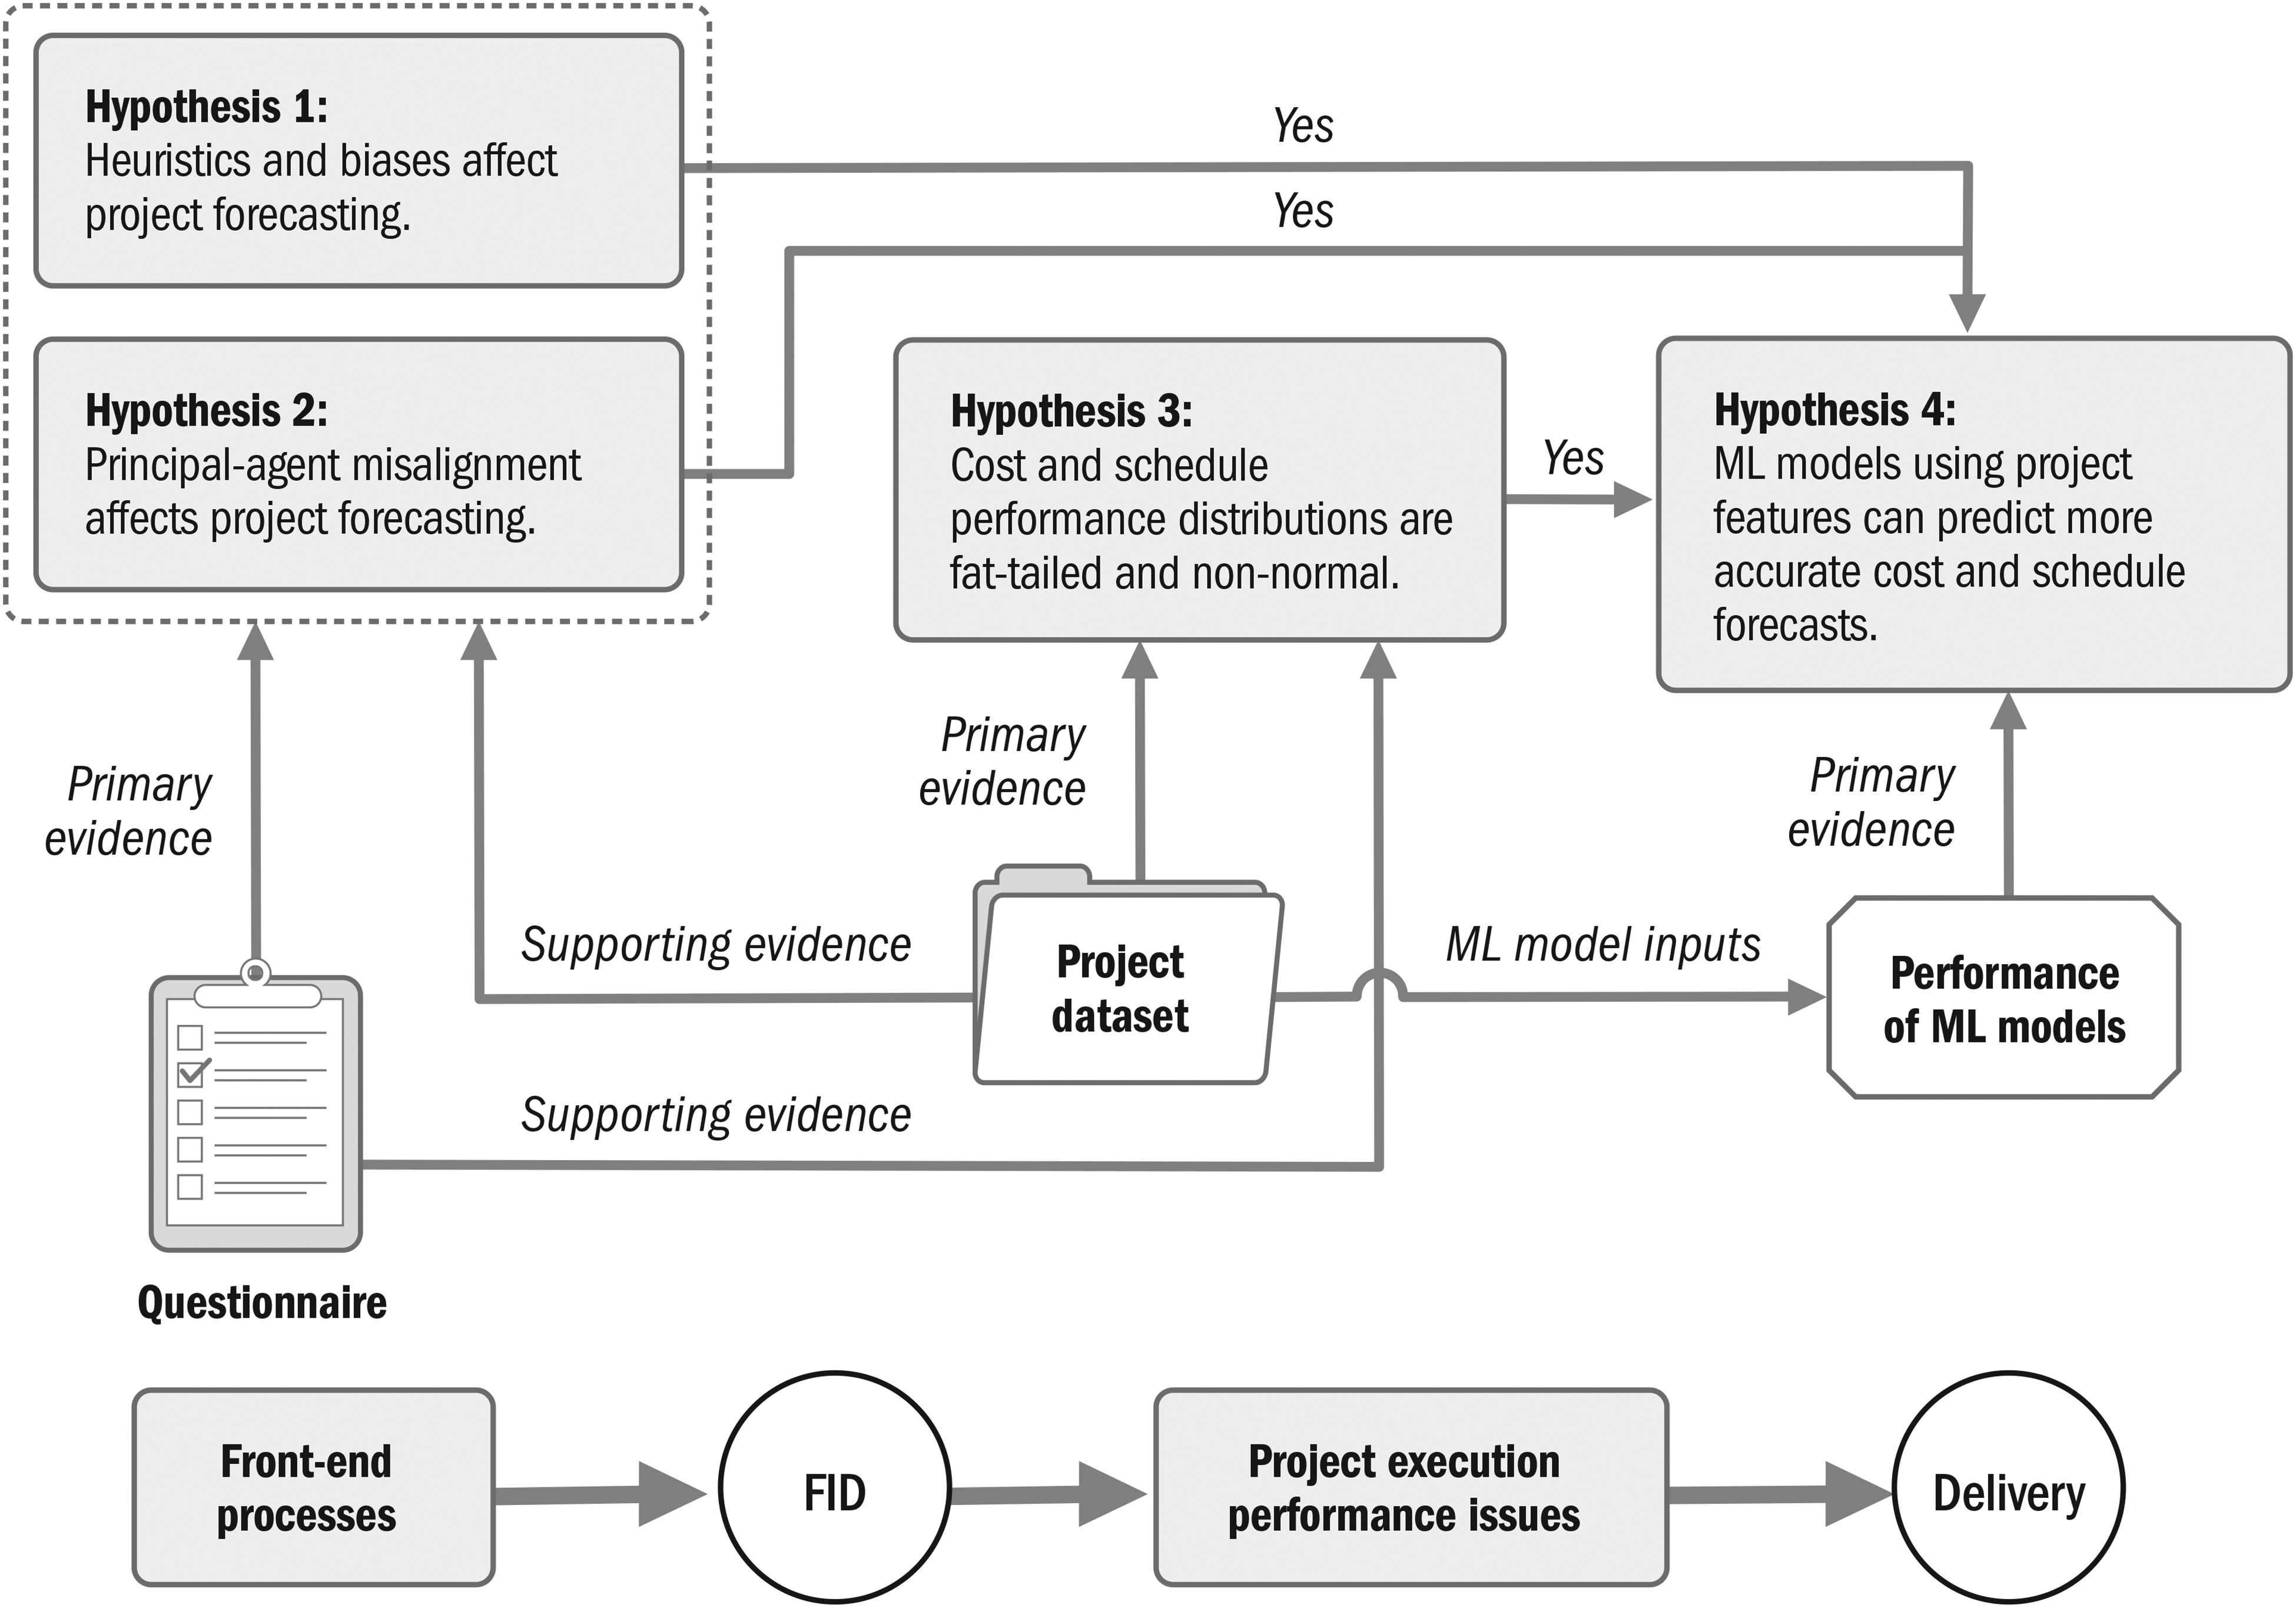
Research methods.
Research Methods
Decision-Making Biases
A formal judgment elicitation approach using questionnaires answered by experienced offshore project managers validated our hypotheses that heuristic and principal-agent biases challenge offshore project forecasting. The six-step process, based on methodologies for eliciting subjective expert judgment from Walls and Quigley (2001) and Garthwaite et al. (2005) included: preparation, recruitment, briefing, structuring, elicitation, and statistical assessment. The Jisc online survey tool, designed for academic research, was used to prepare the questionnaire, to obtain insights into:
Behavioral factors in heuristics-based judgment among project professionals; Differences in expectations and perceptions across contractual boundaries; and Perceived factors that affect project performance; heuristics that have evolved to be ecologically rational in the offshore industry.
Likert scales were used to numerically rank features by their impact on a question. No two features on a scale could have the same rank, and every feature had to be ranked. Thus, the largest rank corresponded to the number of features for that question. Questions to assess subjective probability estimation used percentages instead and were more akin to ratio scales. These are explained further in the analysis sections in context.
Project Performance
Our project performance data collection followed a different approach when compared to the one used for evidence of decision-making biases. It used public and secondary data. Methods for obtaining O&G project data have included pre-collected data from organizations as reported by Merrow (2012) and public and secondary data as reported by Rui et al. (2017) and EY (2014). Our project dataset included project features, FID cost/schedule baselines, and actual cost/schedule performance and was meticulously collected from:
Annual reports and regulatory filings of O&G companies and contractors; Regulatory and government reports, for example, Norwegian Petroleum Directorate, US BOEM; Company press releases, Factiva; Business information aggregators, such as Capital IQ; and Secondary data from reputed industry publications, for example, Upstream, Oil & Gas Journal.
The FID and installation dates, which involve regulatory approvals and are significant to shareholders, were readily available. Budget and especially cost overrun information required considerable investigation. Discrepancies found in business information sources and secondary data by cross-checking were corrected using corroboratory data or discarded. Information was collated chronologically for each project; the assembled information totaled approximately 400 pages.
Project features affecting performance and forecasting accuracy were identified from:
Pertinent O&G project performance literature, for example, Merrow (2011 & 2012), EY (2014), Rui et al. (2017), and Steen et al. (2017); Cross-case and within-case analysis of our project dataset; Theory mapping; and Questionnaire feedback.
Features discussed in the literature include front-end development, location, contract management, size, novelty, and company type. Identified features were collected for sampled projects and mapped to our theoretical framework.
RCF and ML application followed the three-step approach described by Flyvbjerg (2006). Offshore projects comprise several categories: fixed or floating production platforms, drilling, or subsea pipelines. Our work emphasized complexity, scope, and measurable FID and delivery milestones. Integrated field development projects with floating platforms fit these criteria well and became our reference class (step 1). Performance measurement was for the aggregate project, as the platform and subsea components are highly interrelated with critical interfaces. O&G companies or their joint ventures (JVs), are referred to as “clients” and primary contractors as “contractors.” Performance data and features collected from delivered offshore projects enabled RCF application and training of ML models. Overrun distributions were characterized, probability distributions were established (step 2), and required uplifts were calculated (step 3). Following this, ML models were selected, tested, and deployed for overrun prediction. These three steps are illustrated in Figure 6. The selection of industry-specific features and their weighting to project outcomes make this resemble the robust heuristics with environmental correspondence as discussed by Todd and Gigerenzer (2000).
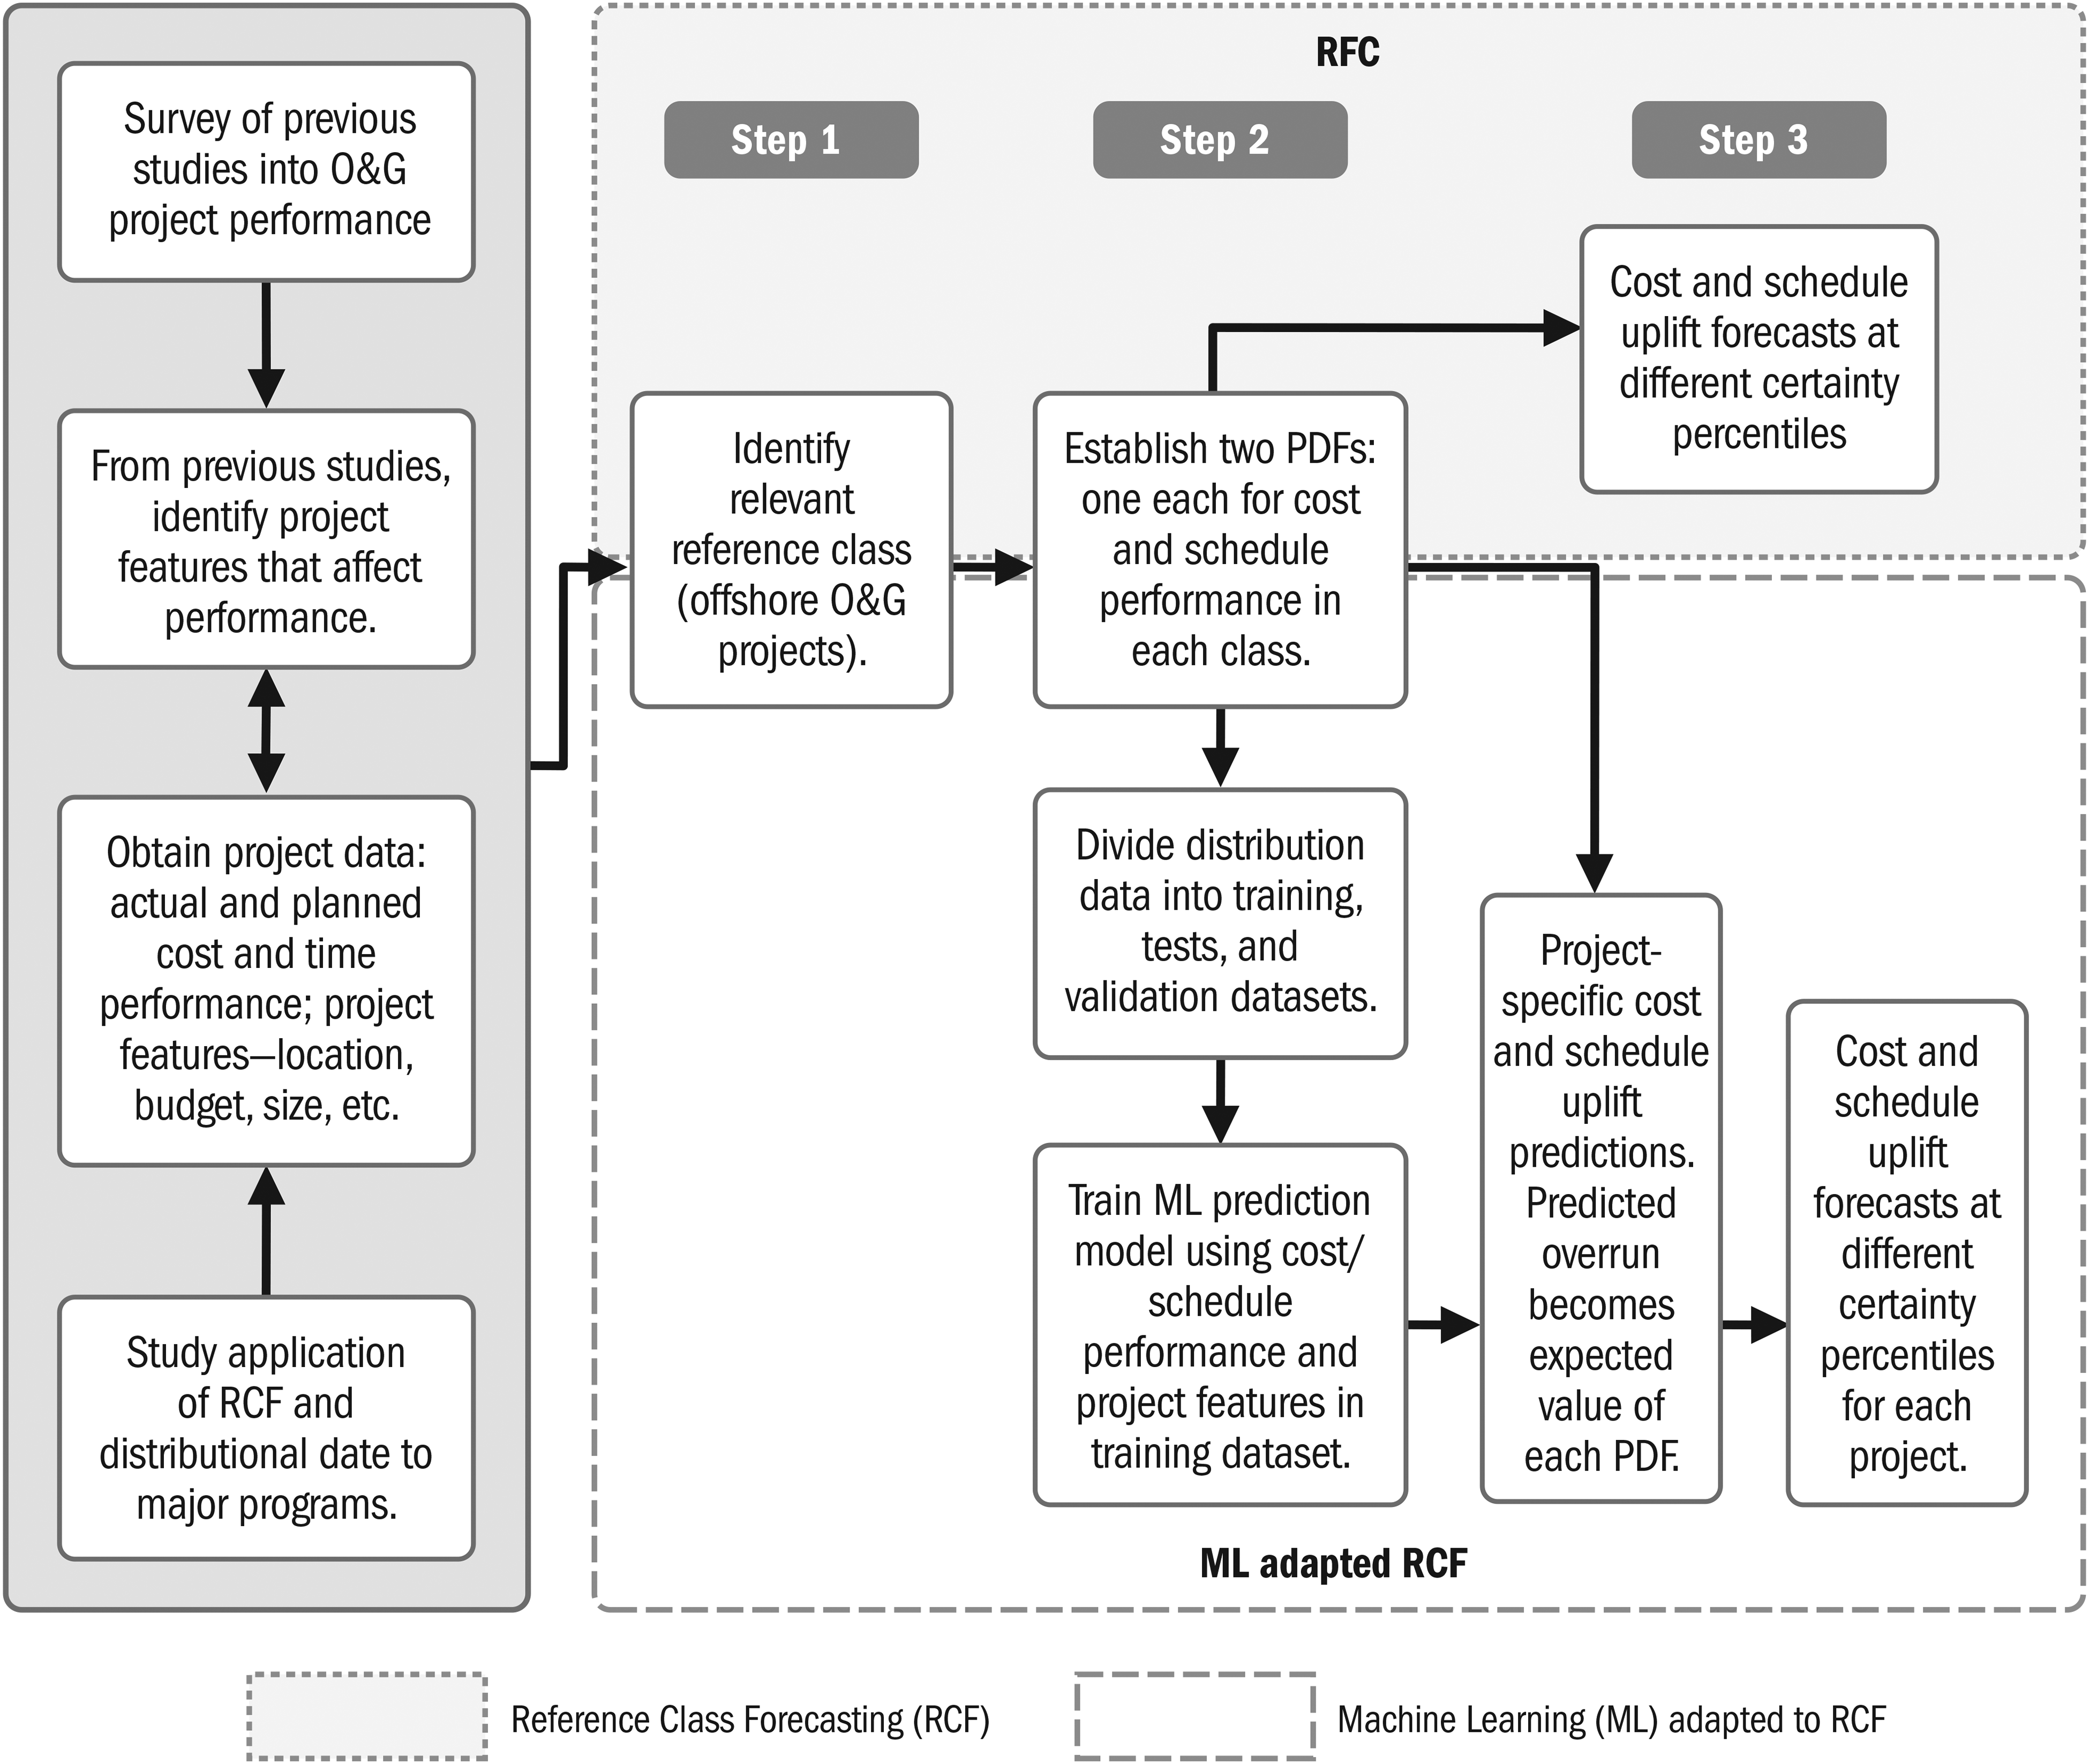
ML and RCF.
Data Collection
Questionnaire
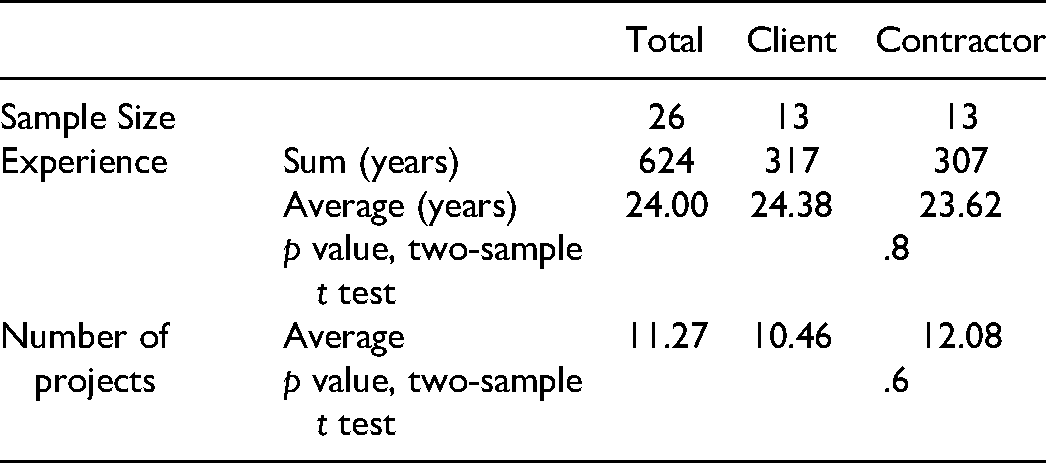
Offshore O&G projects rely on expert judgment (Gyasi, 2017). Our questionnaire respondents were 26 individually recruited O&G project professionals, evenly divided between clients and contractors, 25 of whom were currently in offshore projects. This is a good size for expert judgment elicitation in O&G projects from qualitative and quantitative perspectives (Gyasi, 2017).
Respondents were briefed and advised to apply judgment and not refer to data. They represented 624 years of experience, ranging from 10 to 40 years as shown in Table 1. Several had engineering backgrounds and were well acquainted with the quantitative expression of project forecasts. One each from the contractor and client was picked for resembling what Flyvbjerg calls “master builders” (MacNicol, 2016), possessing consistent track records of successful offshore project delivery. The contractor representative had successfully delivered and rescued several challenging projects; the client representative had delivered a complex project in West Africa on time and on budget.
Questionnaire Respondents
Projects
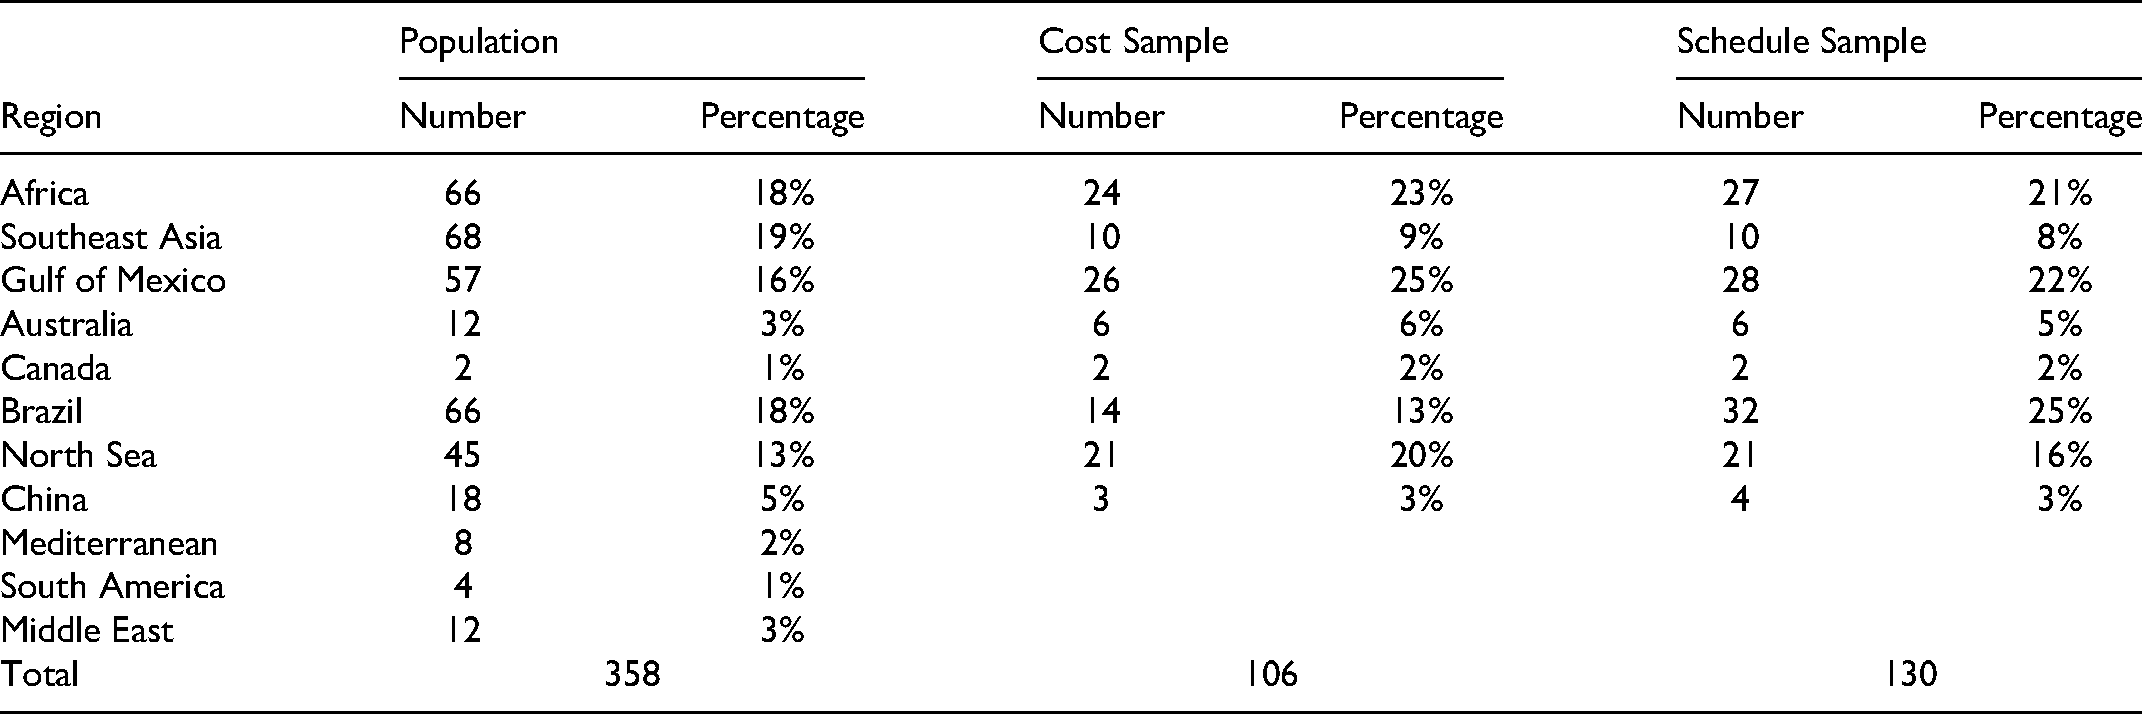
Data collection started with project identification and cross-referencing using industry sources such as the Energy Maritime Associates Floater Systems Report (EMA, 2020) and the 2019 Worldwide FPSO Survey (Offshore Magazine, 2019). Approximately 500 projects were found with installation dates from 1990 onward. Subsea tiebacks, where a subsea field is connected to existing platforms, and major upgrades or redeployment of existing platforms were filtered out, leaving 358 projects representing the global population as shown in Table 2. Offshore platforms were often on the critical path and constituted significant portions of aggregate project costs. Schedule overrun information was obtained for 130 projects (∼36% of population), of which cost overrun information was obtained for 106 (∼30% of population). Our samples represented the population's geographical spread (p = .71 and .68). Assessments and predictions involving cost or both cost and schedule used the sample of 106; those involving only schedule used 130 projects.
Project Dataset
Access to data on O&G megaproject performance used in EY (2014) was obtained toward the end of our research; discussions on data collection with the EY research team were helpful. Offshore projects were only part of their sample. The few projects that fit our filtering criteria were cross-checked against our data on those projects and helped validate the robustness of our data collection.
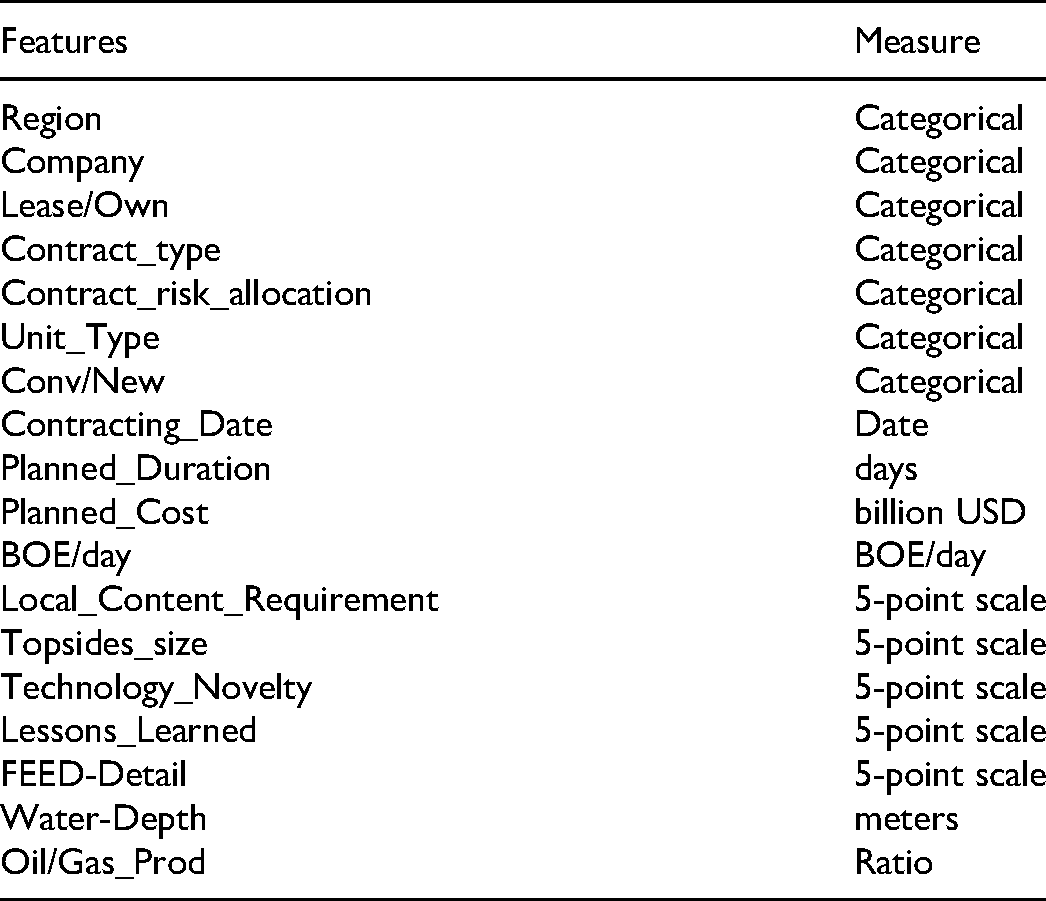
Projects were coded as a design matrix conceptually described in Goodfellow et al. (2016). Each row corresponded to a different project and each column to a project feature. Eighteen features related to project performance and known at FID were collected for each project (see Table 3). Features such as size, novelty, lessons learned, and front-end detail were ranked along a five-point scale using qualitative information and quantitative inputs from within-case analysis. Features such as company type (International [IOC] or National Oil Company [NOC]), contract types, region, and so forth, were categorical data converted to dummy variables for ML algorithms. The average planned FID budget was US$2.3 billion, the median was US$1.3 billion, and the total was US$244 billion for 106 projects (not adjusted for inflation). The average actual cost was US$3.1 billion. Some projects were below the threshold of US$1 billion, which is often associated with megaprojects (Merrow, 2011). The average planned duration was 3.2 years, median was three years, and average actual duration was about four years for 130 projects.
Project Features for ML
Research Findings and Discussion
Data Analysis and Discussion—Questionnaire on Decision-Making Biases
Industry project managers were asked to estimate the proportion of projects facing cost and schedule overruns and also to estimate those overruns. These expert estimates were for understanding heuristics in forecasting helped by comparison with actual performance from our dataset, not for project data. Respondents were asked to rank project features to understand underperformance and outlier causation attribution. Rankings also provided insights into differing perceptions between clients and contractors indicative of principal-agent issues. Two-tailed, two sample t-tests were used to compare and discover differences between rankings by client and contractor groups. Paired t-tests were used to compare feature rankings within a scale to discover their perceived significance. Statistical significance levels were .05 or less. The results clearly showed errors from optimism, availability and representativeness biases, conjunction fallacies, and principal-agent issues in heuristics used by industry experts, validating Hypothesis 1 and Hypothesis 2. Project feature rankings displayed high standard deviations, correlated mostly to principal-agent boundaries, but also to experience. These results also provided feedback on project feature selection.
Perceived Budget and Schedule Overruns
Respondents were asked to recollect the proportion of their projects that were on budget and on schedule. The low estimate of ∼50% (see Table 4) across contractual boundaries can be related to low predictability assessments by experts in their field. This test is recommended by Kahneman and Tversky (1979) for the applicability of reference class corrections. The high underperformance estimate, coming from project professionals, is indicative of principal-agent issues. Furthermore, this high estimate is still less than that from our data (18% on schedule, 20% on budget, 31% within 5% of schedule, 28% within 5% of budget), indicating optimism bias along with principal-agent issues. There was no significant difference between client and contractor perceptions; however, the contractor estimated budget overrun was bimodal, possibly from availability bias reflecting the most recent project.
Recollected Proportions of Projects with Budget and Schedule Overruns
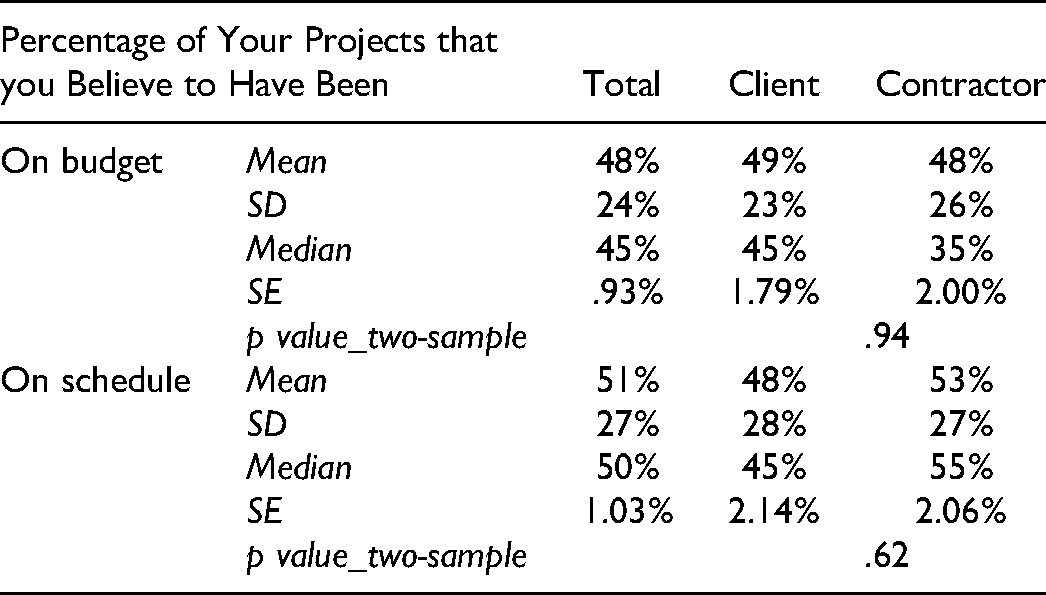
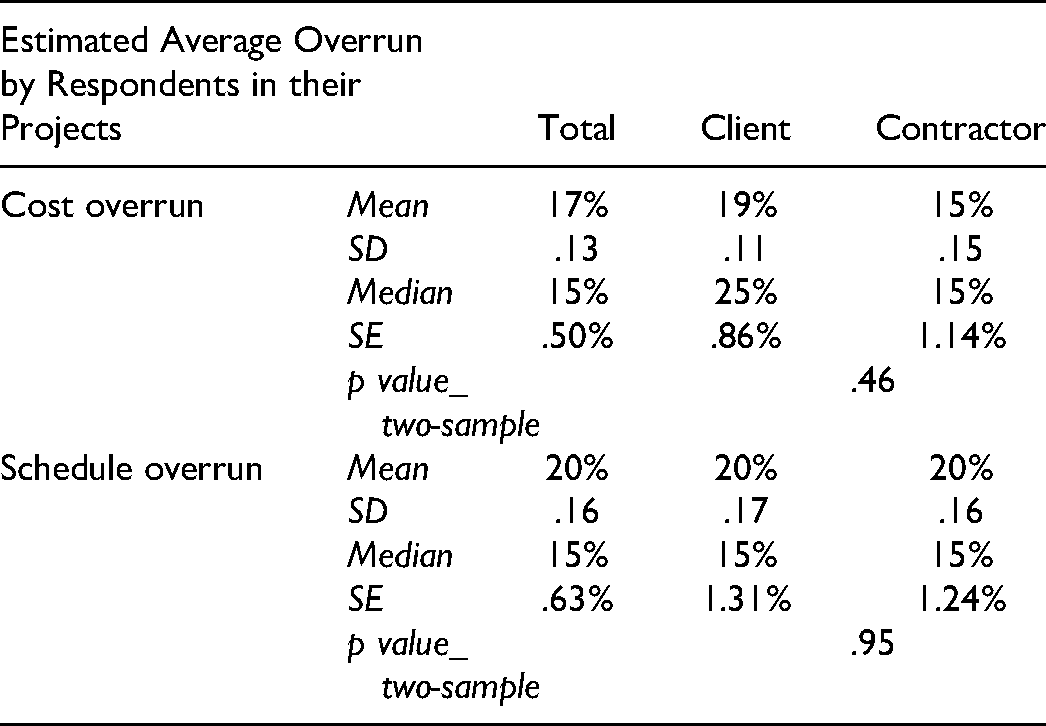
Respondents were also asked to estimate the actual overruns (see Table 5). Their estimates were similar but significantly less than the average cost overrun of + 33% (n = 106) and average schedule overrun of + 26% (n = 130) from our dataset.
Recollected Estimates of Budget and Schedule Overruns
Optimism Bias and Heuristics
Participants were asked to estimate typical industry project performance in two different ways. The first used a ratio scale, Scale 1, with equidistant percentage measures. Given the limitations to objective probability estimation in humans, a more relatable nonlinear canon of probabilities for judgment elicitation, found in a work on the application of Bayes theorem to historical questions (Carrier, 2012), was used as Scale 2 for the second means of elicitation. The two scales are illustrated in Figure 7.
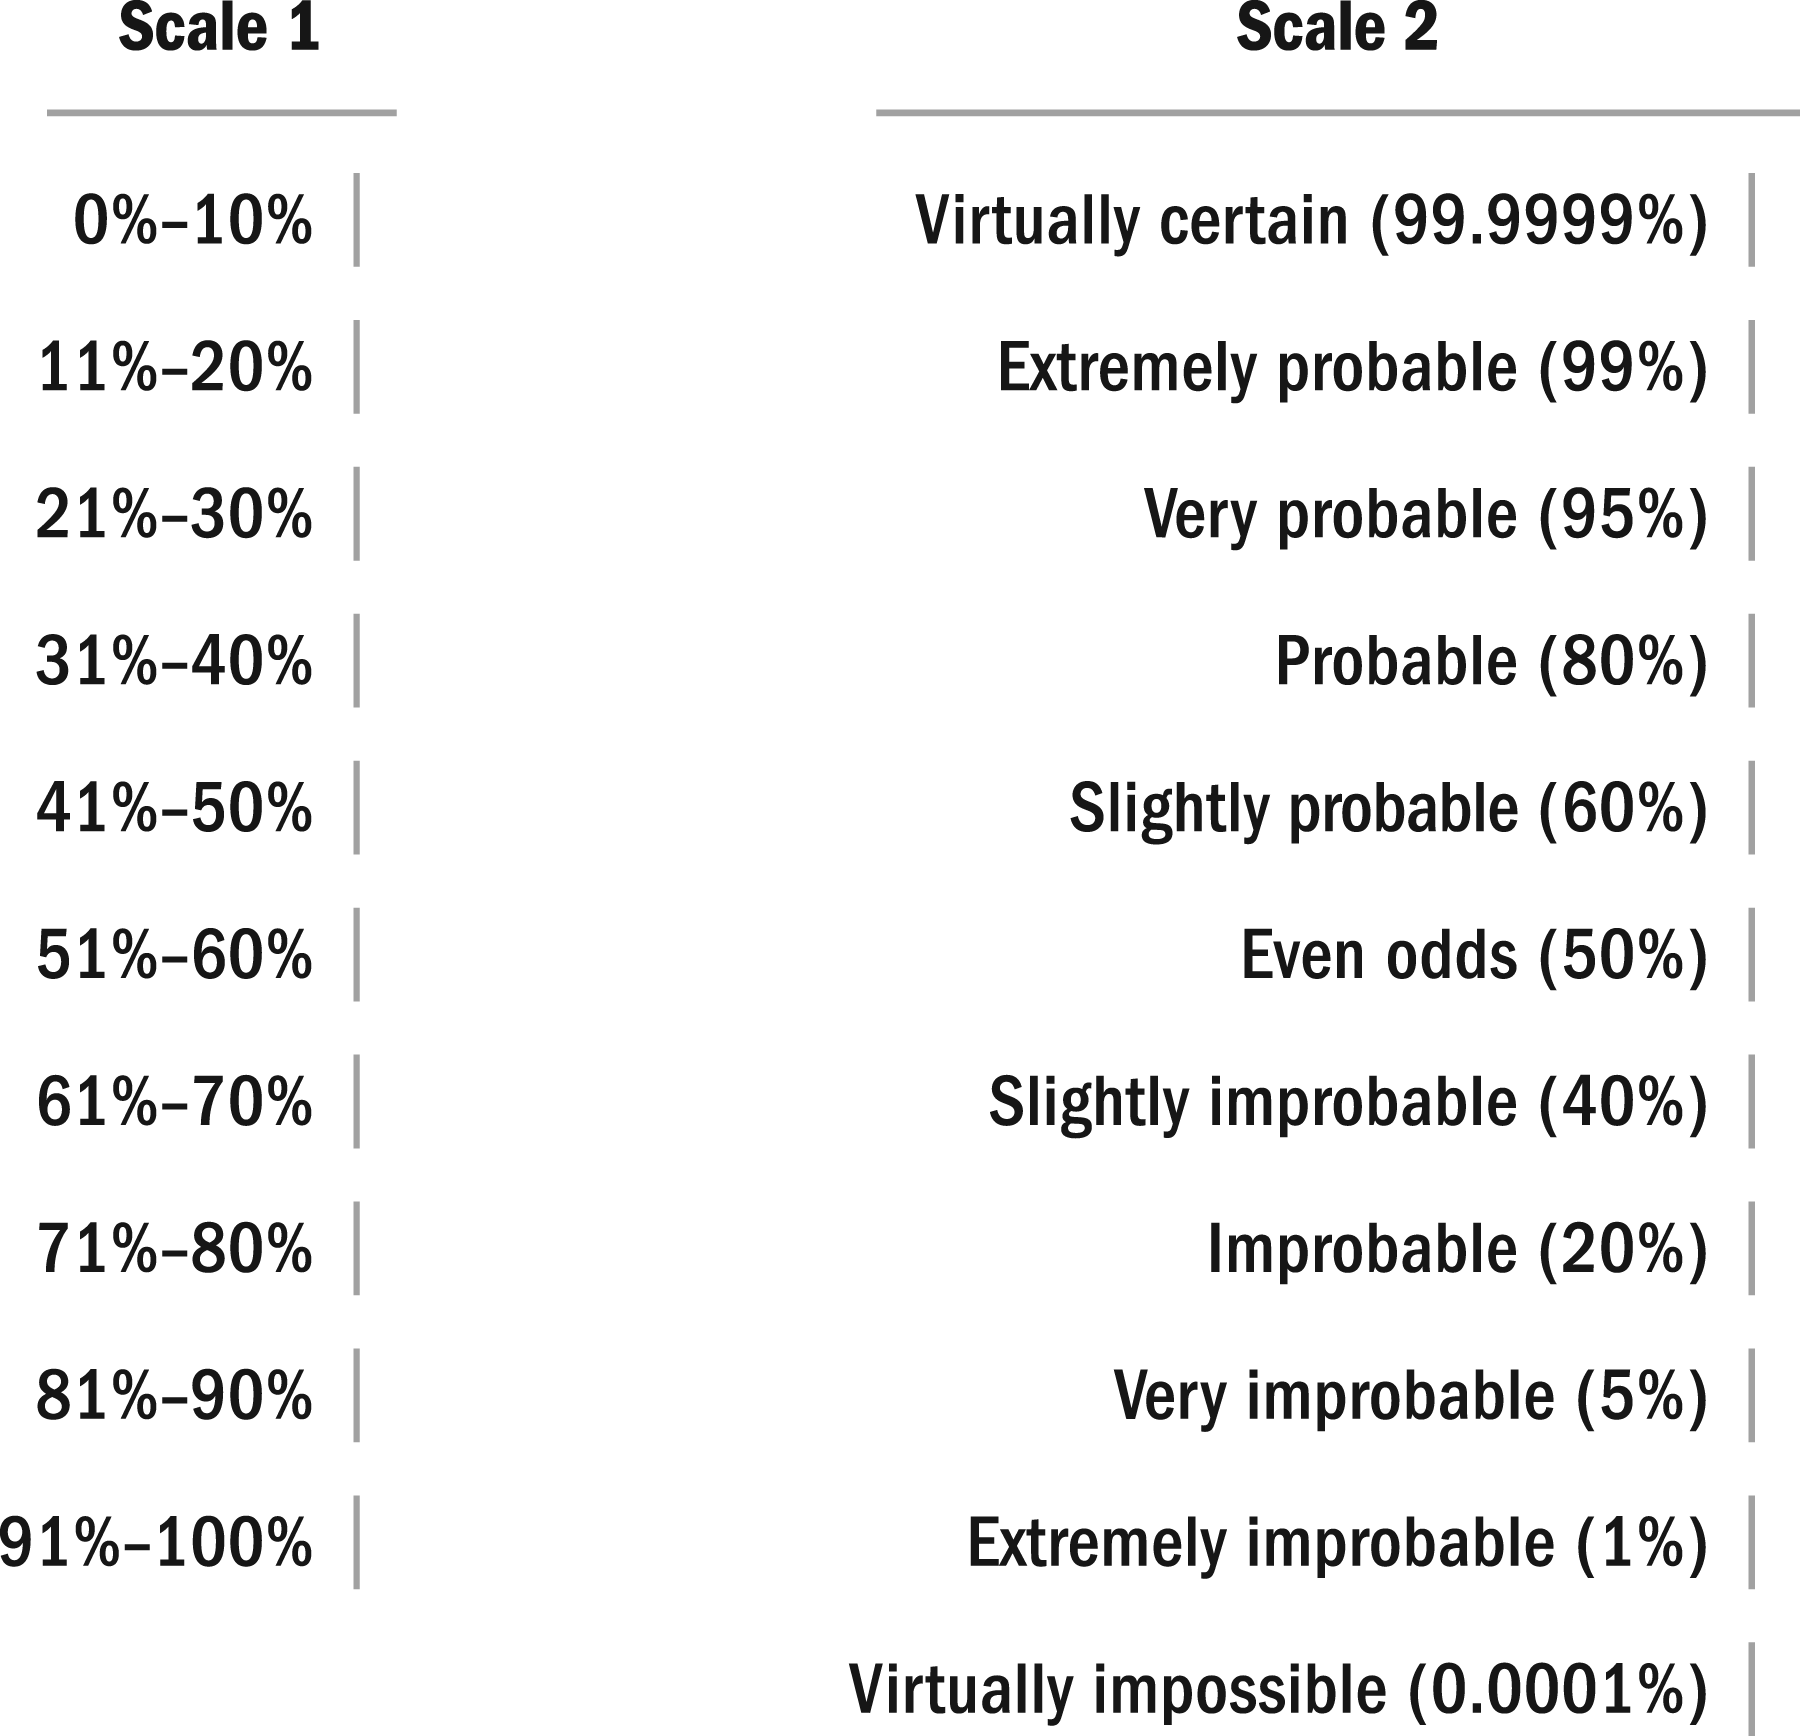
Same questions, different scales.
Estimates of industry project performance using Scale 1, as shown in Table 6, were only marginally different from participant projects, but were significantly different using Scale 2: (p = .0033 [cost]; .0043 [schedule]). Performance estimates using Scale 2 were much closer to the data: (27% vs. 20% [cost]; 29% vs. 18% [schedule]).
Likelihood Estimations for Project Performing to FID Baselines
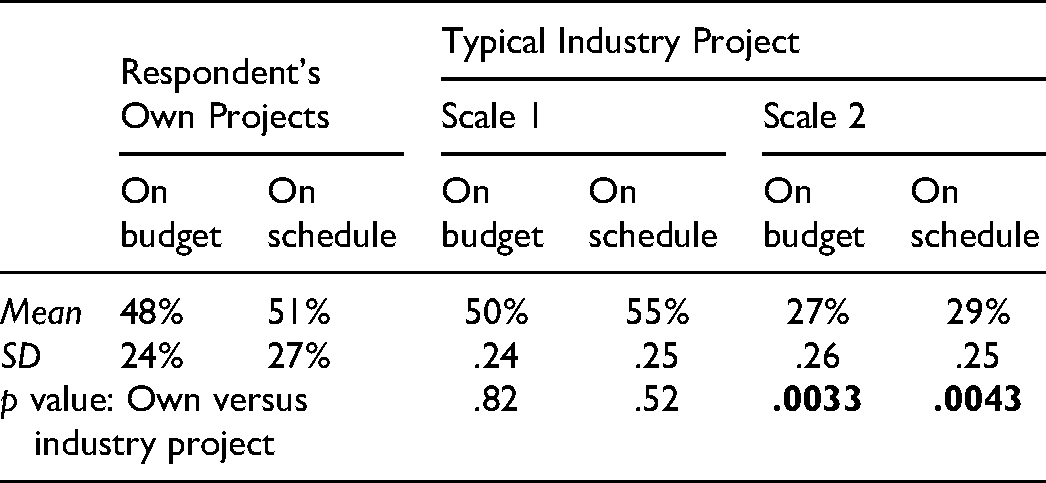
The significant number of actual underperforming projects versus estimations is evidentiary for forecasting bias. The much better performance of Scale 2 indicates the need for more relatable measures for judgment elicitation to avoid bias, even from experts.
Conjunction Fallacy
Tversky and Kahneman’s (1983, p. 293) famous paper on the conjunction fallacy in probability judgment observes that “the probability of a conjunction, P(A&B), cannot exceed the probabilities of its constituents, P(A) and P(B),” is perhaps the “simplest and most basic quantitative law of probability.”
To test for this fallacy, respondents were asked to rank the likelihood of an offshore project suffering from cost OR schedule overruns using Scale 2. The mean result was 78%, corresponding to a likelihood of meeting both targets of 22% for P(A&B), only marginally less than their estimates for cost, P(A) = 27%), and schedule, P(B) = 29%. The percentage of projects from our dataset that actually met both cost and time targets is only 4%, which is considerably less than the percentage meeting each performance target. This is indicative of the conjunction fallacy.
Availability Bias
Availability bias—where the probability assigned to an event is biased by the ease of recall of similar instances—was tested by asking participants to choose a 0%–100% probability for an unforeseen event, such as a global pandemic or a catastrophic economic downturn to affect an offshore project materially. This evoked the COVID-19 pandemic, which had caused a severe crisis in the O&G industry at the time of the research.
The mean probability of 42% was much higher than expected and double the mean estimates for outliers caused by external events in a separate question to the same respondents. Projects from our sample showing evidence of being materially affected by such events were less than 10%. This is strong evidence for availability bias. Interestingly, the client and contractor “master builders” assigned 20% and 10% probabilities, respectively, considerably less than the mean assignments of 40% and 50%, respectively, in their groups.
Representativeness Bias
We replicated Tversky and Kahneman’s (1983) famous test of the proposition that coupling an outcome with a cause would make it appear more probable than the outcome on its own, whereas the opposite is true. Respondents were asked to assess the probabilities of two events:
Cost overrun of more than 40% in a project offshore Southeast Asia. Regulatory and local content issues causing cost overrun of more than 40% in a project offshore West Africa.
The mean estimate for the conjunction overrun due to regulatory and local content issues in West Africa, was higher at 47% versus 35% for the Southeast Asia project. Average cost overruns in Southeast Asia (26%) and Africa (24%) from our sample are very similar. Local content issues are significant in both regions, which form strong evidence for representativeness bias.
Interestingly, the two master builders stood out for correctly ranking the probability of the overrun in Southeast Asia significantly higher than the estimate for the conjunction: 45% versus 15% (client) and 25% versus 5% (contractor).
Perceived Factors Affecting Cost and Schedule Performance
Respondents were asked to rank factors by importance for meeting cost and schedule FID baselines as shown in Table 7.
Cost and Schedule Performance Factors
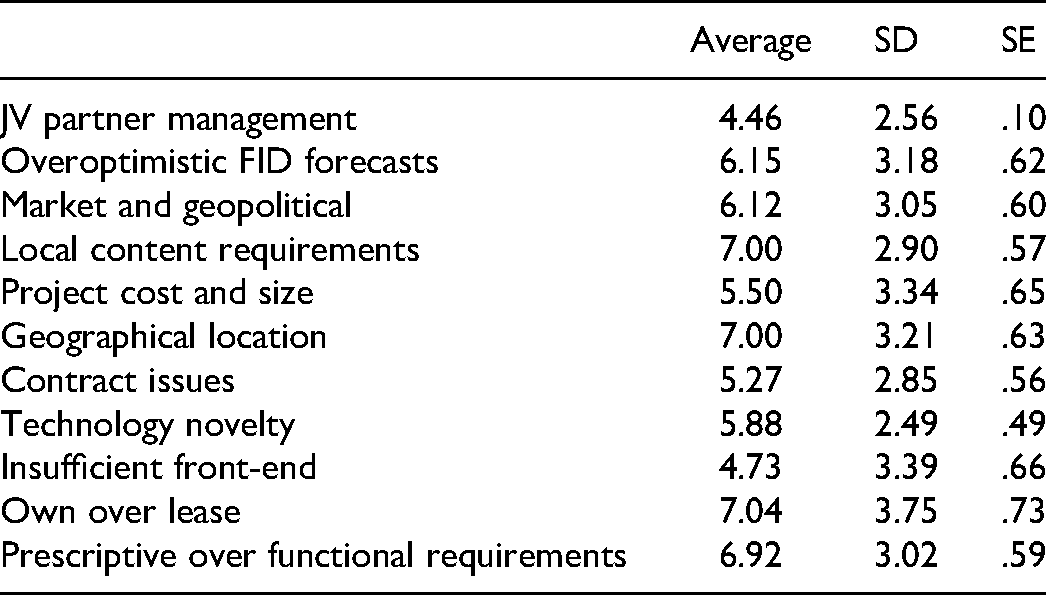
No factor stood out, and responses had high variance. JV management issues and insufficient front-end detail, correlated with project underperformance in some studies, were ranked least significant (p < .05). These issues made it challenging to filter project features using corroboration from the questionnaire.
Contractors gave significantly more causality to contractual issues (p = .013) and high but not statistically significant causality to overoptimistic forecasts at FID (p = .063). Both are indicative of principal-agent issues.
Outlier Causation Perceptions
Budzier and Flyvbjerg (2013) studied the impact of outliers in project management and discussed three schools of thought to explain them. The system-centric view focuses on project complexity, the event-centric view focuses on external events coupled with ineffective response, and the process-centric view focuses on the buildup of issues over long periods. Features identified from our theoretical framework and project case analyses were mapped across these views. Respondents were asked to judge which features contributed most to cost overruns greater than 50% (see Table 8).
Factors Contributing to Severe Cost Overruns
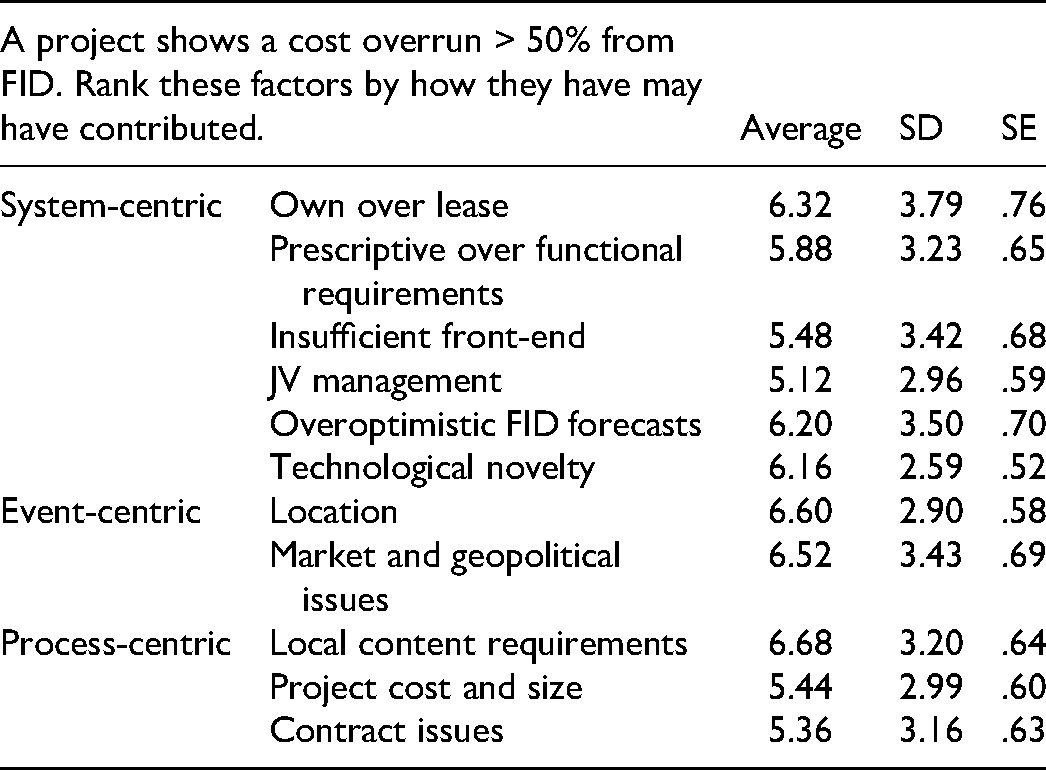
The normalized attribution was: 53% (system-centric)
A follow-up question elicited responses coded to the three views to check consistency, with one cause corresponding to each (Table 9). It was also designed to understand internal consistency; a percentage representing the probability of causation was used and, by implication, the sum of probabilities had to be 100%.
Factors Contributing to Severe Cost and Schedule Overruns

The elicited probabilities at 152% totaled more than 100%, pointing to the “Conjunction Fallacy.” The normalized attribution was: 47% (process-centric): 21% (event-centric): 32% (system-centric), reversing the previous attributions, pointing to inaccurate quantitative estimations.
Overrun Causation Perceptions Across Contractual Boundaries
Two scales asked respondents to rank overrun causation factors from client and contractor perspectives to highlight the attribution differences between client and contractor participants and corroborate feature selection for our prediction models. While neither scale showed statistically significant deviations between client and contractor responses, there were several pointers to principal-agent issues: Contractors saw the pressure to show reduced cost and schedule as much higher than clients (average: 5 vs. 3.7, p = .17); clients ranked improper subcontractor work not discovered in time higher (average: 4.46 vs. 3.5, p = .137).
The extensive biases and principal-agent misalignment in the questionnaire responses by industry project management practitioners validate Hypothesis 1 and Hypothesis 2.
Data Analysis and Discussion—Project Performance and Forecasting
Analysis of offshore project cost and schedule performance outcomes found that their asymptotic distributions were fat-tailed with black swans and catastrophic dragon-king outliers, validating Hypothesis 3. Both cost and schedule distributions show significant overruns. We demonstrate the ability of clustering to identify black swans and dragon kings and the application of RCF to offshore project uplifts. We then demonstrate ML models for accurate project-specific overrun forecasting, validating Hypothesis 4.
Cost and schedule performance for offshore O&G projects in our sample are shown in Table 10; average cost overrun is +32.8%, schedule overrun is +25.6%, 82% of 130 projects were late, and 80% of 106 projects were over budget. This is comparable with Merrow’s (2011) study, which looked at 318 industrial megaprojects, including 130 O&G projects, of which 78% showed cost overruns of +33% and schedule slippage of 30%. EY (2014) reported an average +23% cost overruns for O&G upstream and downstream megaprojects, with 64% of 205 projects facing cost overruns and 73% of 242 projects reporting delays. This performance compares favorably with average cost overruns of +107.2% and schedule overruns of +37.3% reported for large IT projects by Budzier and Flyvbjerg (2013). However, cost overruns in our dataset amounted to about US$83 billion, and schedule slippage had severe cost implications, indicating the issue's seriousness.
Project Outcomes

We identified outlier projects using the conventional definition of 1.5 inter-quartile ranges from the IQR boxes (Figure 8), similar to Budzier and Flyvbjerg (2013). This resulted in three schedule overrun outliers (2.3% of sample) and six cost overrun outliers (5.7% of sample). Case analysis revealed nothing materially unique about fat-tail outlier projects, keeping with Budzier and Flyvbjerg’s (2013) findings for IT projects.

Box plots of overrun data.
Overrun Distribution
Outlier presence and discrepancies between mean and median indicate skewness and fat-tailed distributions (Budzier & Flyvbjerg, 2013). Cost and schedule overrun histograms show fat-tailed non-normal distributions (Figure 9), similar to O&G project cost overruns reported in EY (2014) and Rui et al. (2017). Dragon kings are visible as “obvious bumps in the tail” (Sornette, 2009, p. 5). The schedule, budget, and associated overrun curves in Figure 10 used kernel density estimation (KDE), a non-parametric method to estimate probability density functions (PDF). Only the planned duration is near normal. Cost overrun, which has more outliers and a greater difference between the median and mean, is more fat-tailed. The Kolmogorov-Smirnov (KS) test, a nonparametric test used to test the goodness of fit between probability distributions, was used on the cost and schedule overrun distributions. There was no significant difference (p = .18).
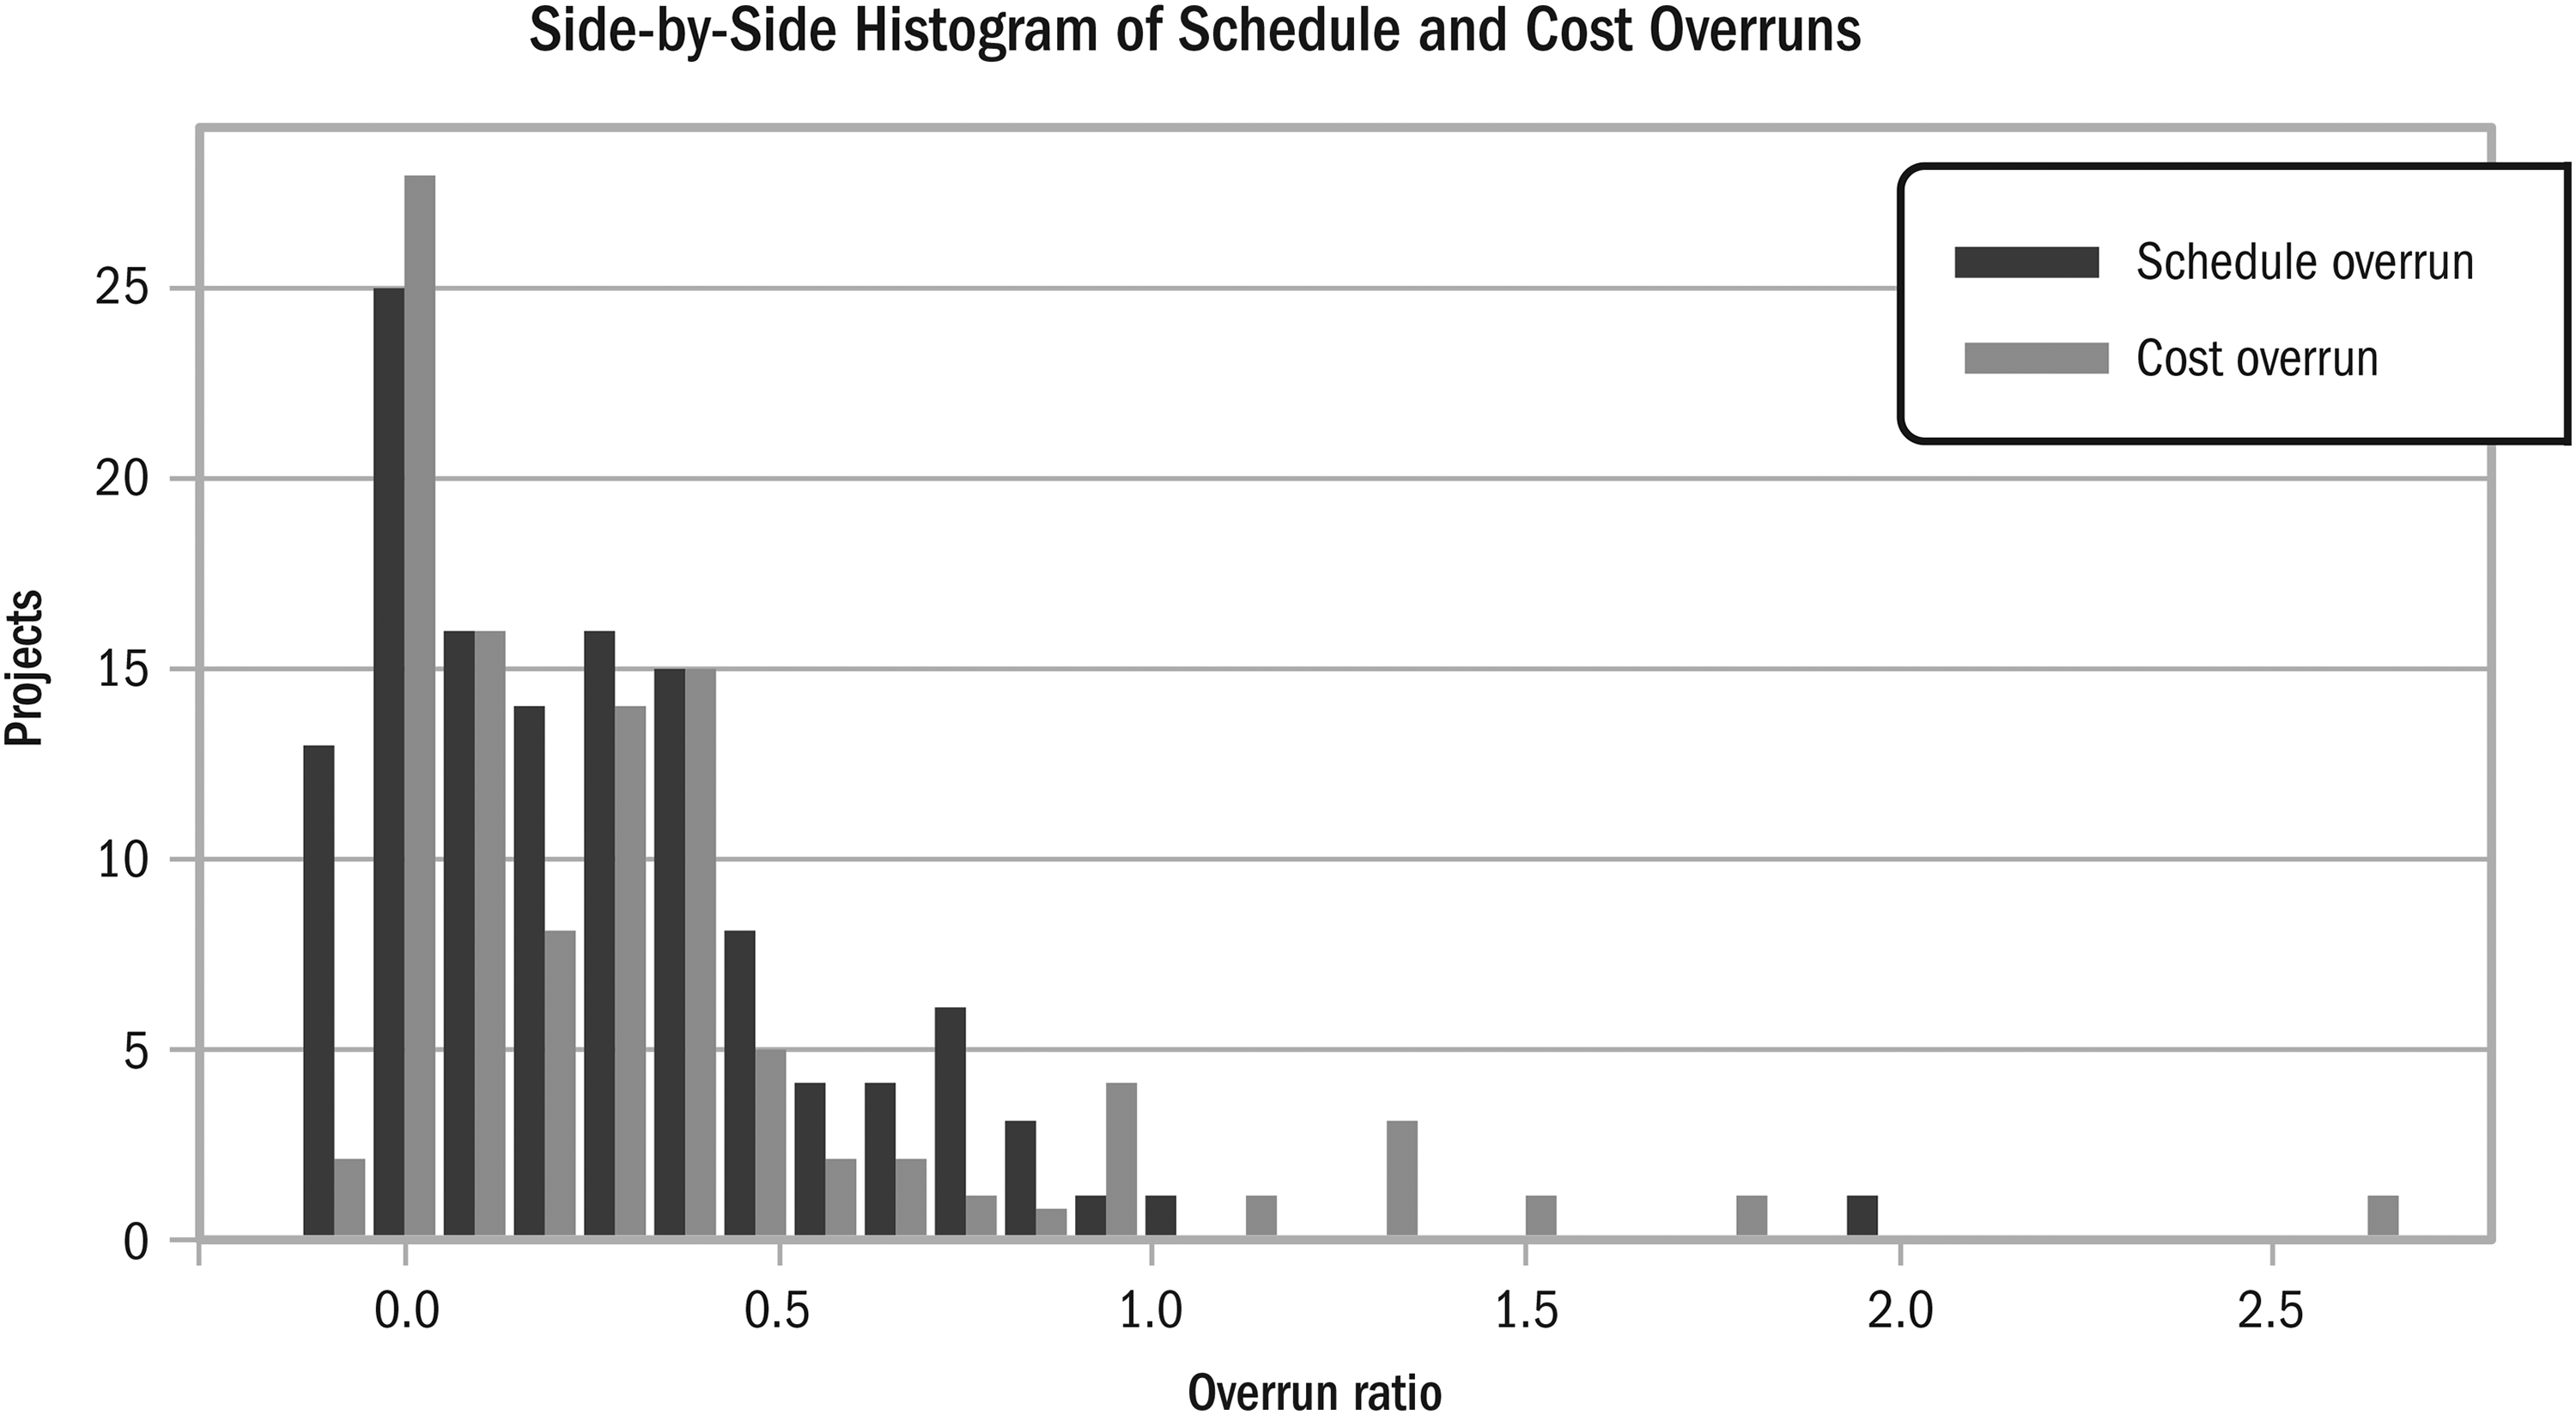
Schedule and cost overrun histograms.

Cost and schedule overruns and corresponding budget and schedule at FID.
Maximum likelihood estimation was used to fit PDFs to overrun distributions. Normal distributions did not fit the schedule (p = .049) or cost overrun (p = .0002). Exponential, Birnbaum-Saunders (BS), and Pareto distributions were fit to both overruns (Figure 11). The KS test was used to test the null hypothesis that they fit the data (p > .05). The Birnbaum-Saunders two-parameter family of extreme-value distributions, used to model structural fatigue and reliability related failures (Birnbaum & Saunders, 1968), provided the best fit to both schedule (p = .89), and cost overruns (p = .14). Sornette (2009) discusses how the coexistence of power-law distributions with catastrophic dragon-king events can be approximated by calibrating distributions that model material failure, which incorporate positive feedback and phase transition. These results offer possibilities for approximating distributions for forecasting when actual distributions are limited.

PDF fitting to cost and schedule overrun data.
Overrun distributions were generated using uniformly distributed pseudorandom numbers and the fitted BS distributions. It was interesting to observe how increasing noise in the BS distribution produced bumps mimicking dragon-king outliers in the tail. As random variables increased from 100 to 10,000, the curve smoothened as it approached the asymptote. The KS two-sample test, showed good fits for schedule (p = .085) and cost (p = .25), as shown in Table 11 and Figure 12.

Cost and schedule overrun distribution generation.
Statistical Parameters, Cost, and Schedule Outcome Generation

Cost and schedule overruns in offshore O&G projects are non-normal, fat-tailed, and skewed toward overruns, validating Hypothesis 3.
RCF Application
After establishing the reference class cost and schedule overrun distributions probability distributions are estimated as their cumulative distributions as shown in Figure 13. Cost overrun is visibly more substantial than schedule overrun.
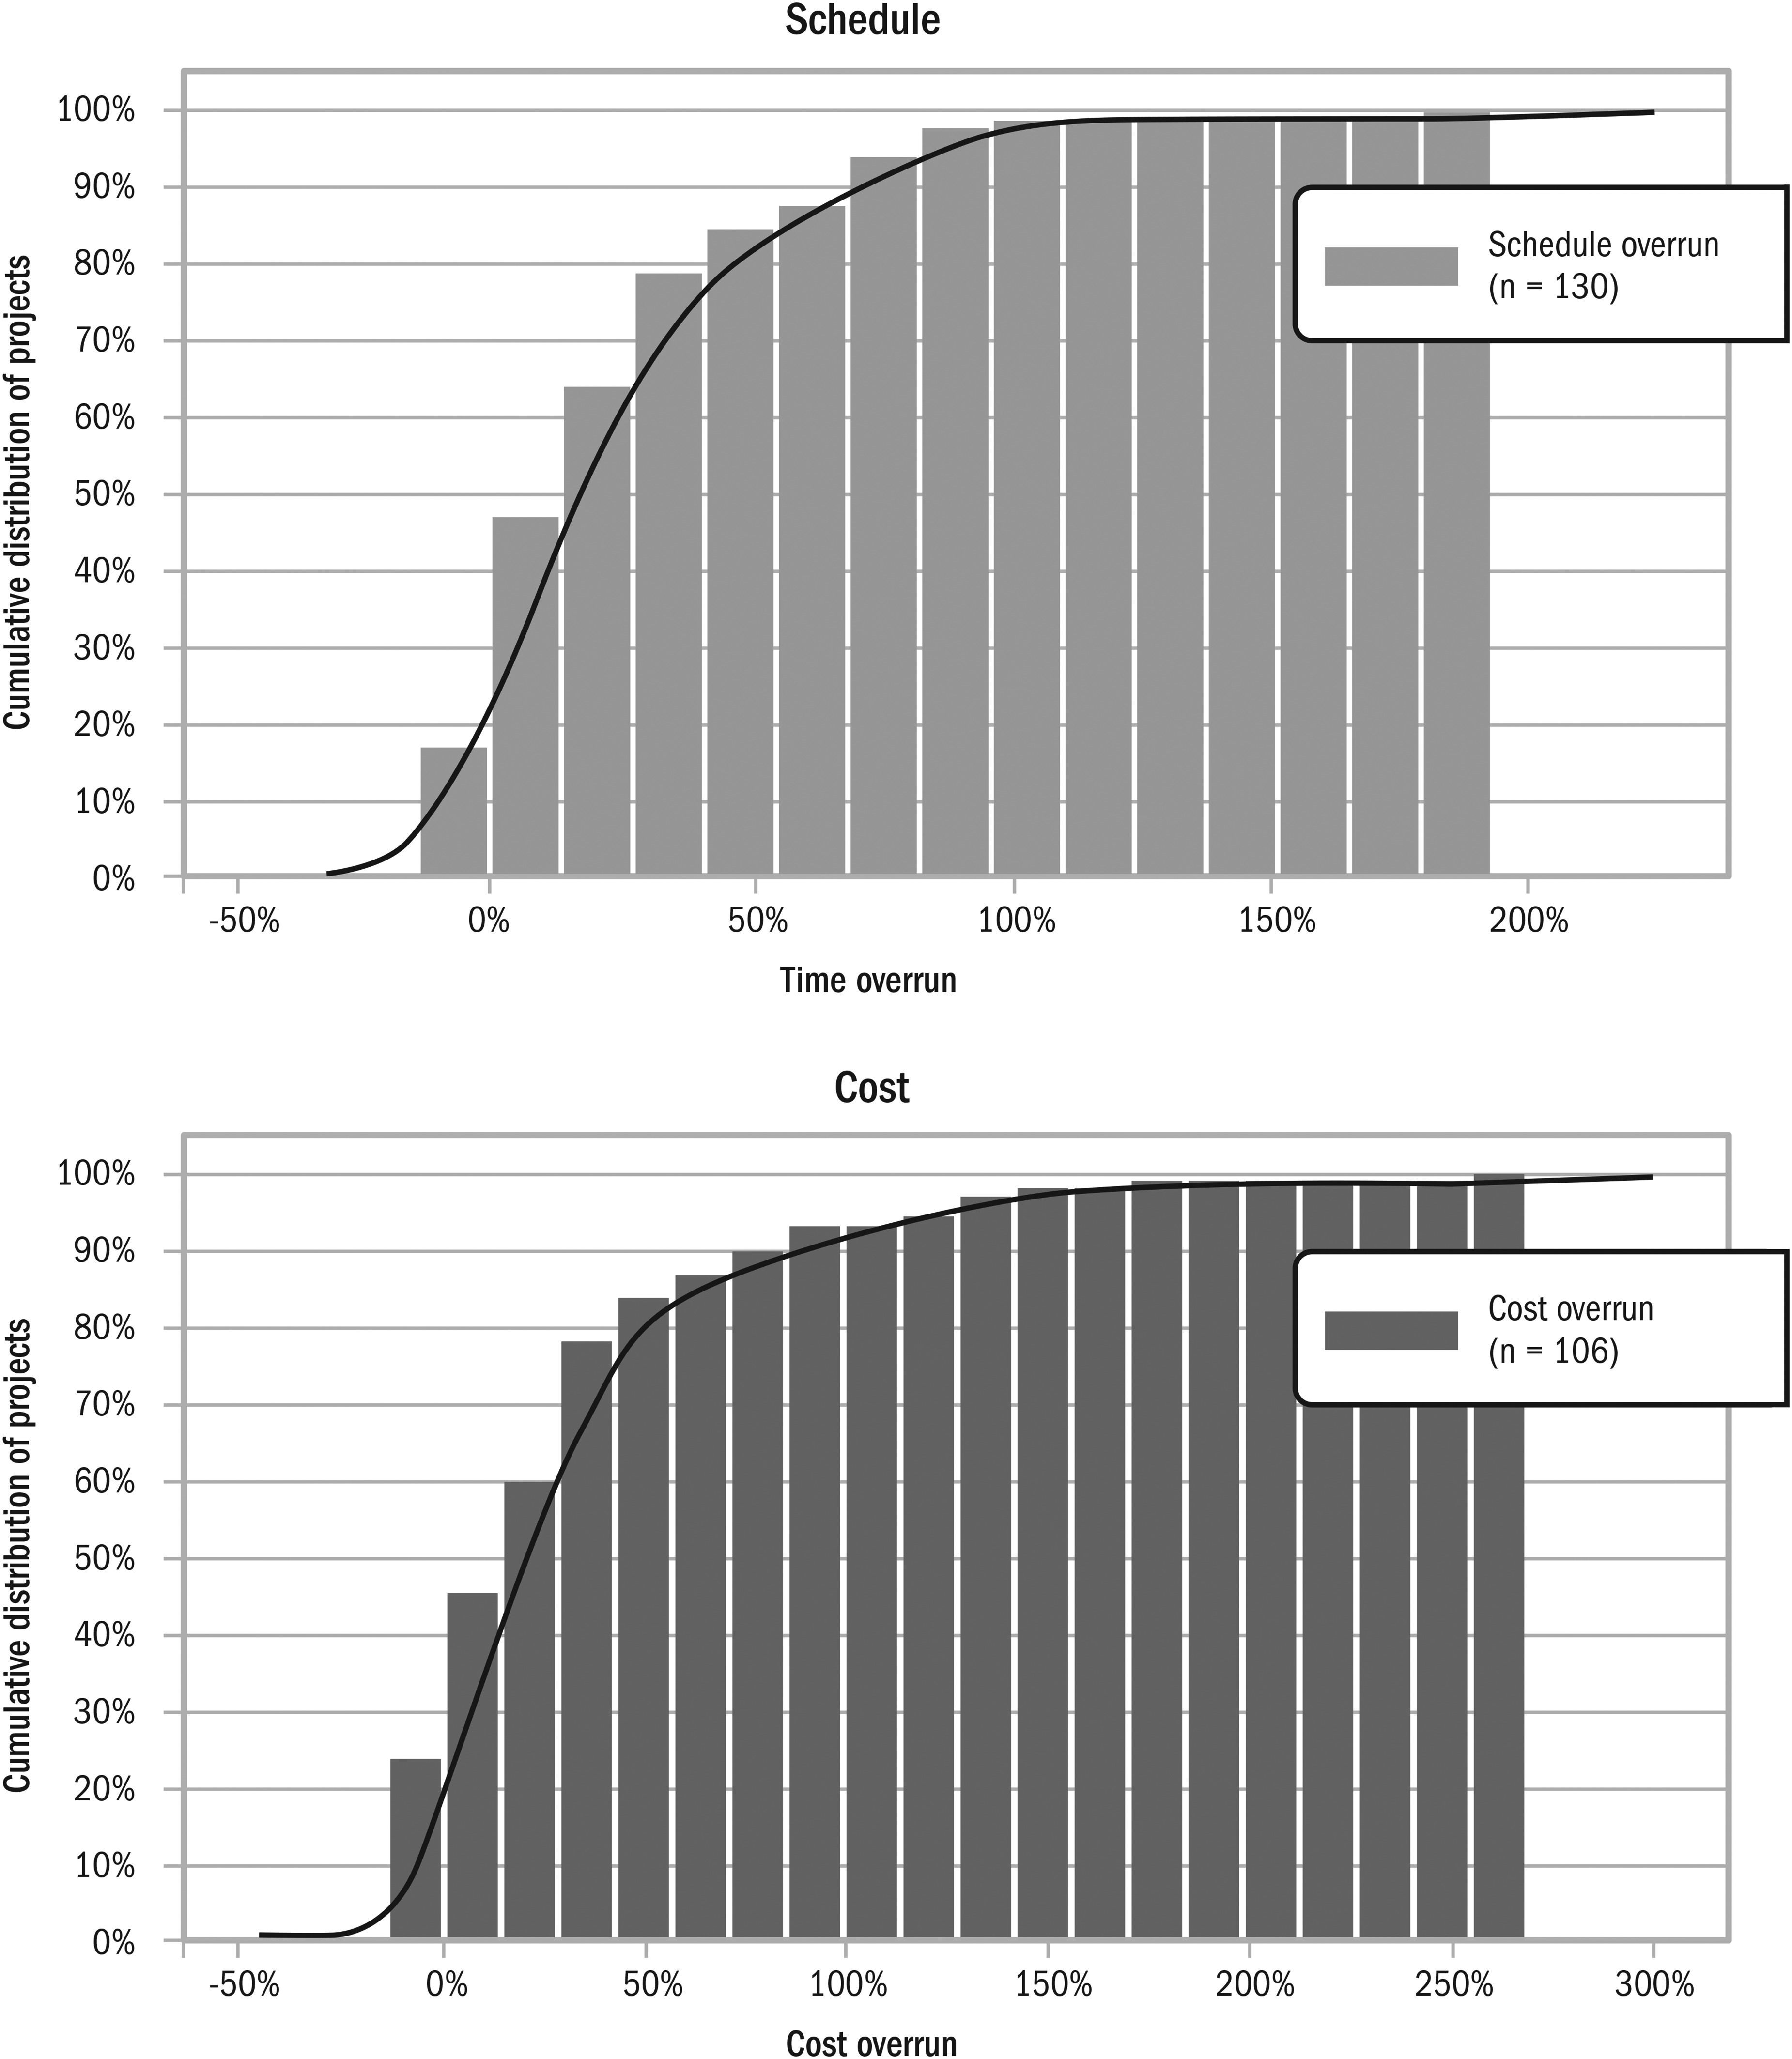
Probability distributions of schedule/cost overruns.
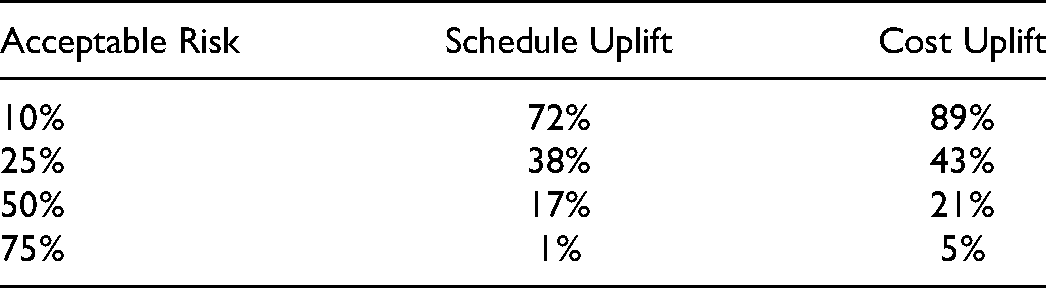
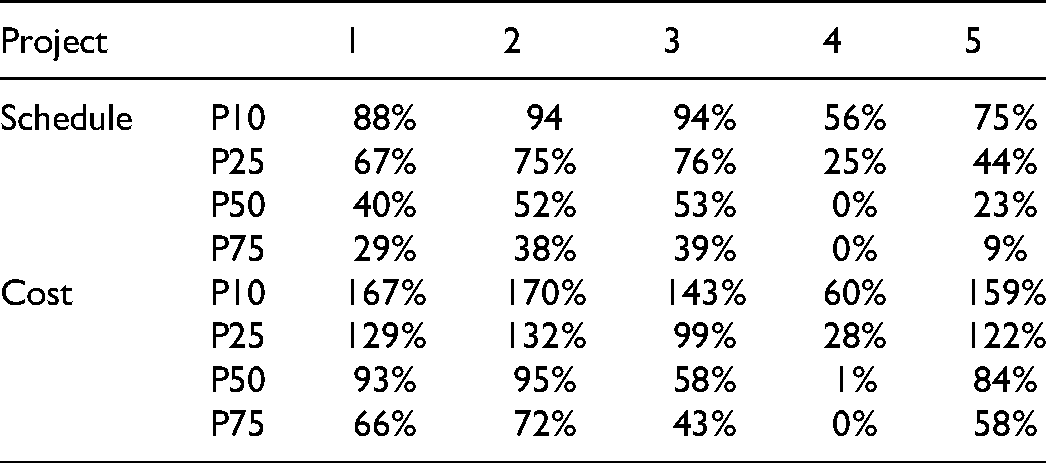
Functions relating the required uplift on the x-axis to acceptable risk level percentiles on the y-axis for schedule and cost (Figure 14) overruns were obtained from the probability distributions, as demonstrated by Flyvbjerg (2006). Table 12 shows P10, P25, P50, and P75 uplifts from these functions. The uplift percentile choice should follow the desired risk acceptability, as discussed at length by Flyvbjerg (2006).

Required uplifts as functions of acceptable risk.
RCF Uplifts
Joint Distribution of Cost and Schedule Performance
K-means clustering was initially used to identify RCF subclasses in the sample. While the limited sample and population sizes meant that further subdivision was not pursued, clustering analysis yielded valuable information. Project outcomes were located along the two dimensions of cost and schedule overruns. Within-cluster sum of squares (WCSS) was used to measure variability within clusters and identify optimal cluster numbers. The WCSS score was plotted against the number of clusters to identify the bend where the variability tapered off (Figure 15). Three clusters offered the greatest separation (Figure 16): the first region with 81 projects corresponds to where both overruns are clustered together; the other two clusters divide projects into those showing high cost or schedule overrun. Figure 17 shows how projects separate into distinct cost or schedule overrun clusters as overruns become more extreme. As the number of clusters increases to five and eight, extreme outliers, including black swans and dragon kings, became distinguishable. These findings offer points of departure for the study of outlier occurrence, distribution, causation, and clustering for reference class subdivision beyond this article's scope.
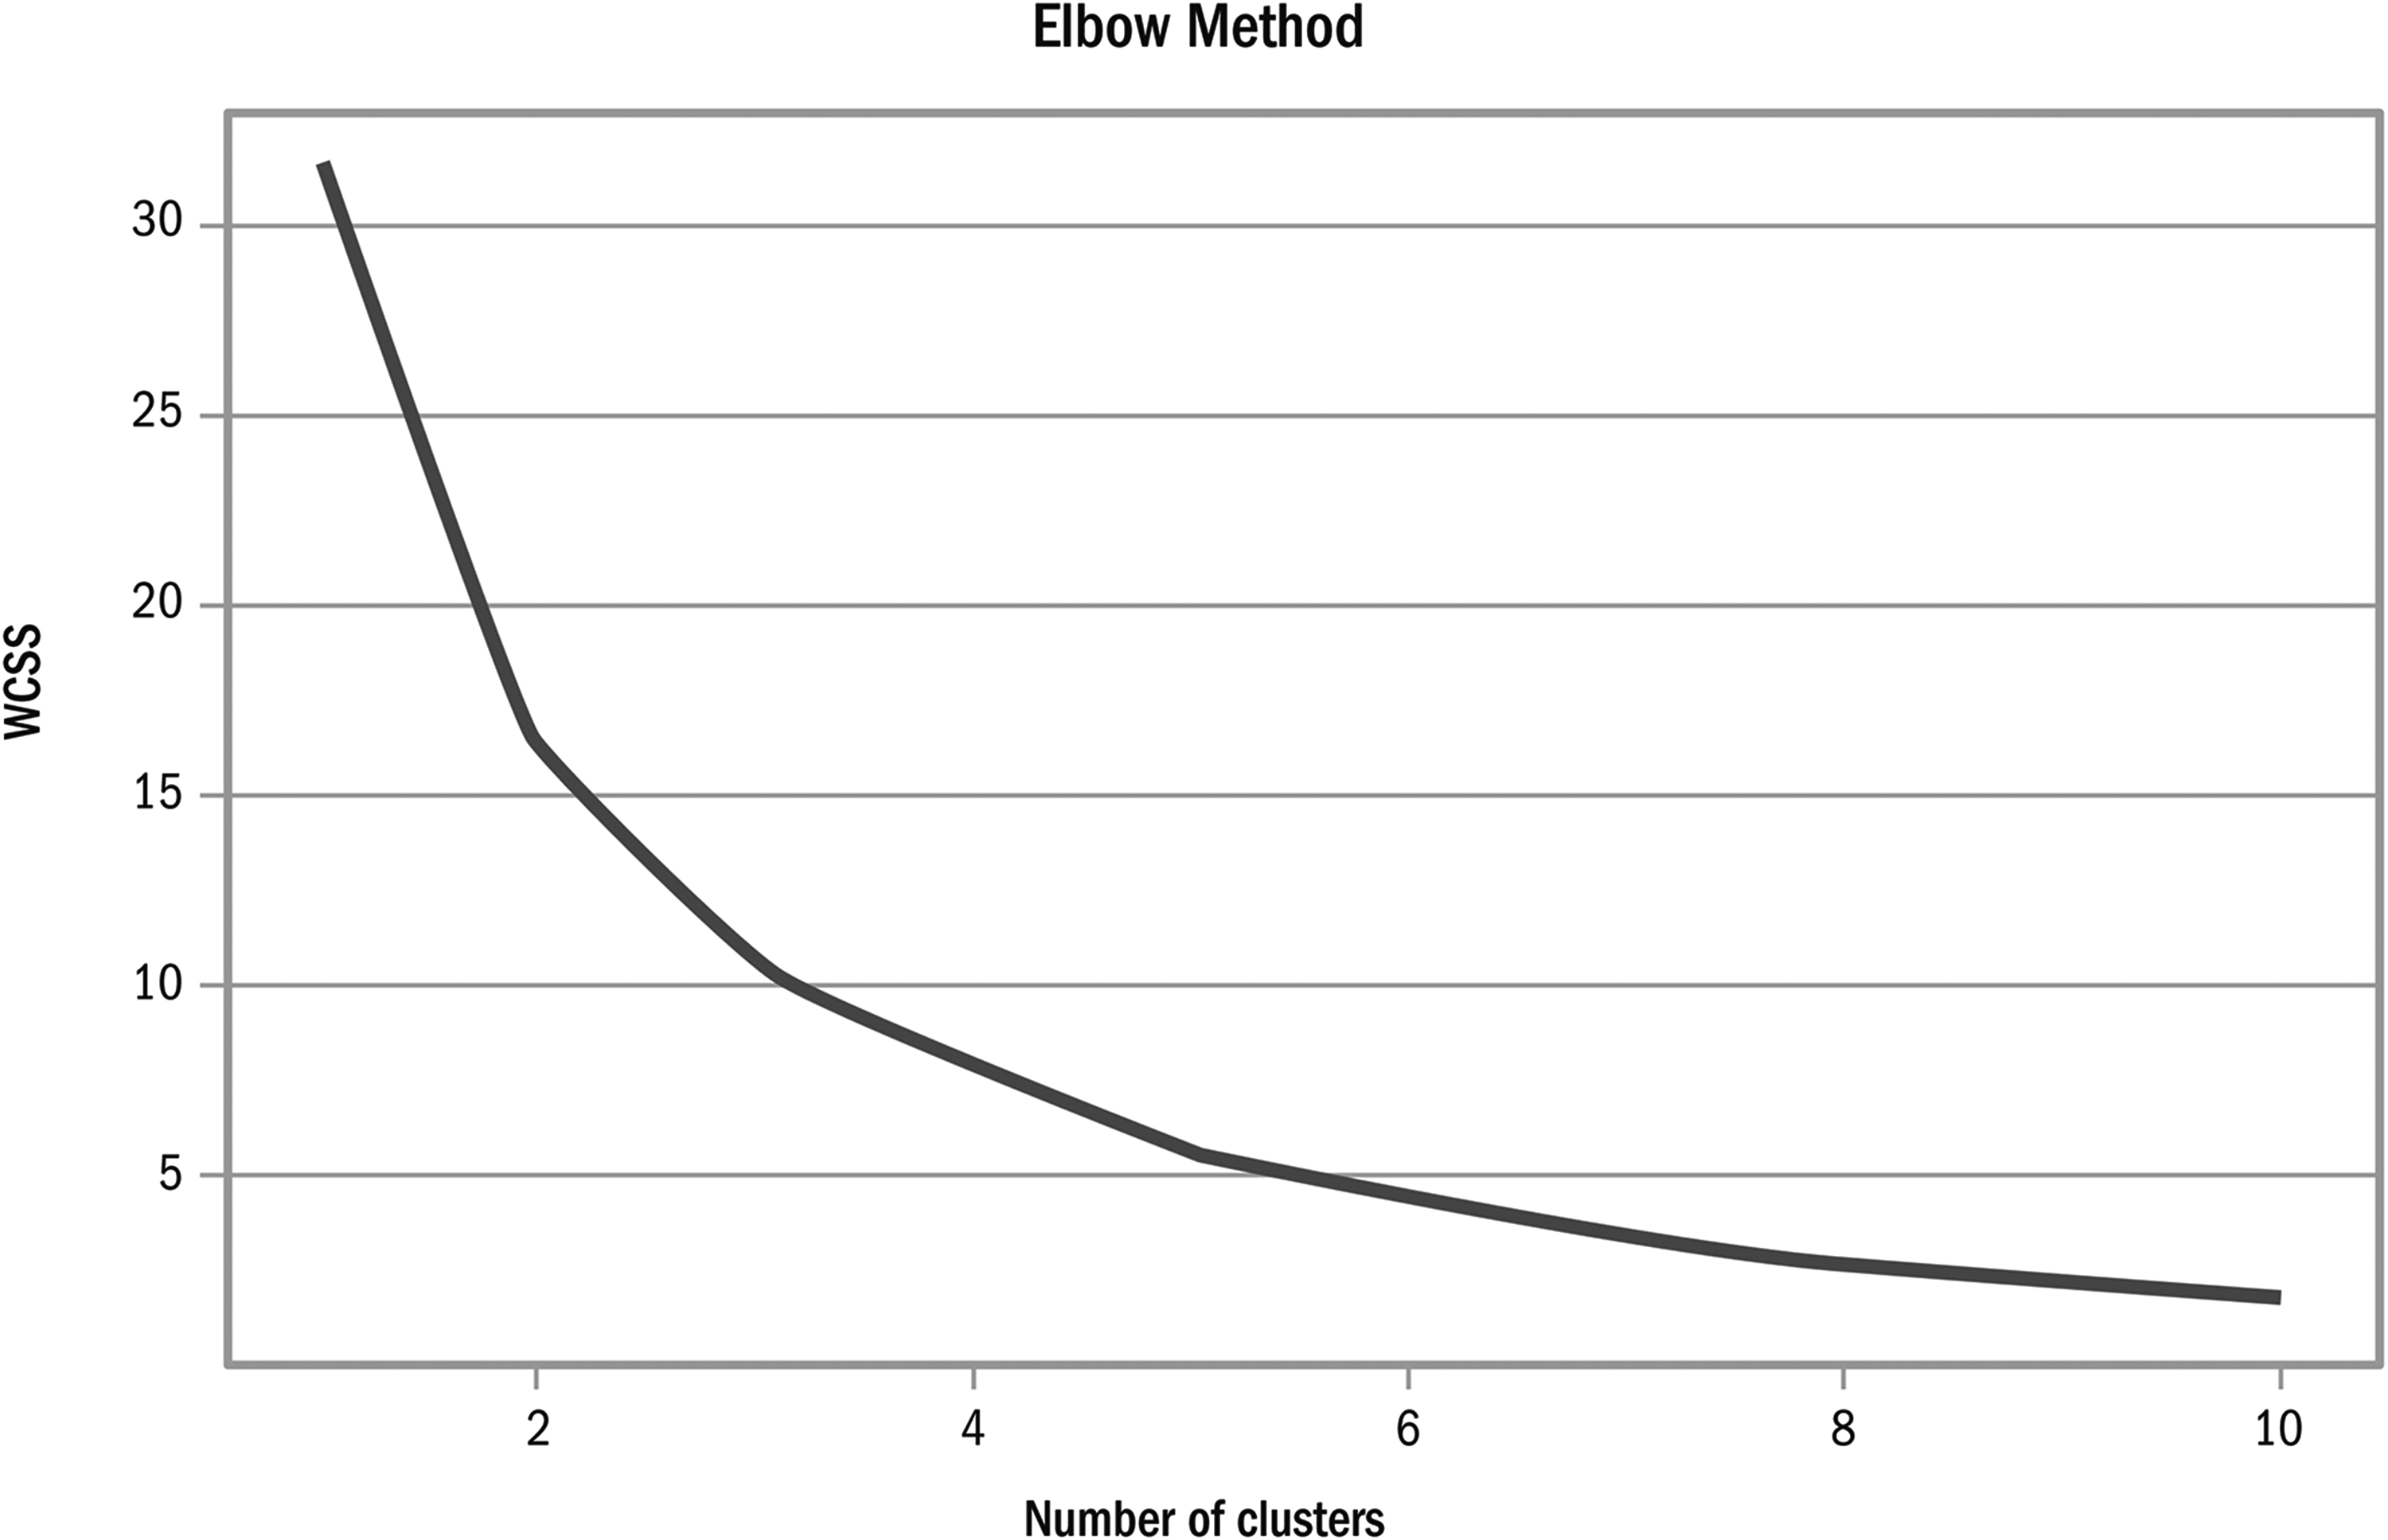
WCSS scores for clusters in cost-schedule distribution.

Clustering of project cost and schedule outcomes—three clusters.

Clustering of project cost and schedule outcomes showing progressive separation of outliers.
Data-Analytics/ML—Performance Prediction
Cost and Schedule Uplift Forecasting
The distinct populations of cost and outliers reveal limited covariance between cost and schedule overruns. The Wilcoxon signed-rank test, a nonparametric version of the paired t-test, only narrowly failed to determine that cost and schedule overruns were significantly different (p = .08). A linear regression model fit to a joint distribution of schedule overrun and cost overrun in Figure 18 displays high scatter (PCC = .37, p < .01). Even the dense cluster of 81 projects identified by three-means clustering shows substantial scatter (PCC = .25, p < .05). Similar uplift percentages for cost and schedule will represent different risk percentiles for different projects, making RCF application to both challenging. This was resolved by using ML to forecast project-specific cost and schedule uplifts.

Cost and schedule overrun covariance.
ML Cost/Schedule Uplift Forecasting
Deep learning utilizes models that train from a dataset using an optimization procedure and a cost function (Goodfellow et al., 2016). Our challenge was a limited dataset with several features. The model had to relate project features known at FID to overruns at delivery. Pearson correlations between features and overruns are plotted in Figure 19; some correlations, such as lessons learned and technology novelty, are clear. However, the effects of some features could be moderated by other features in complex ways and the model would have to learn these relationships.

Correlation across project features and outcomes.
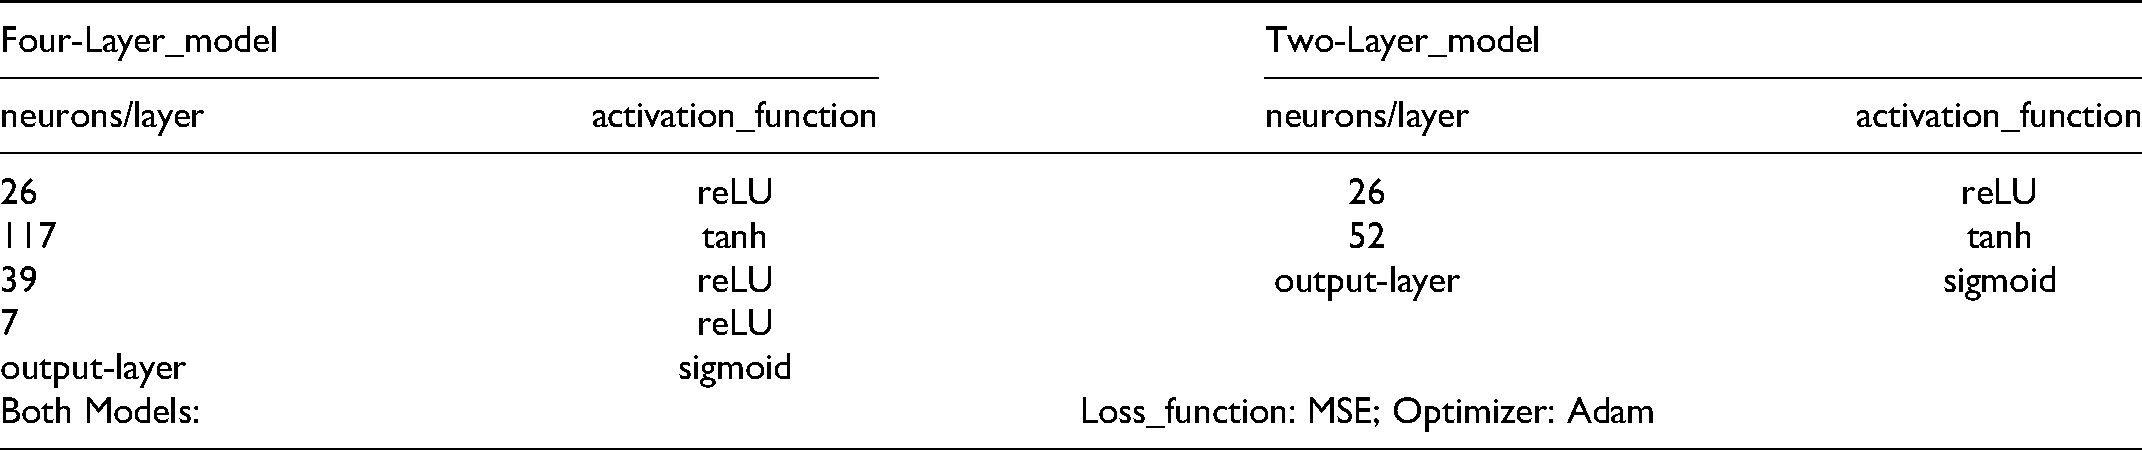
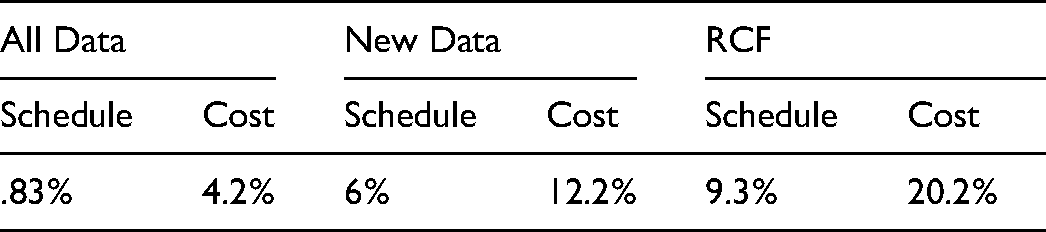
Two supervised learning models were trained, one each for schedule and cost overrun. Project data were vertically split into features and outcomes (overruns) and split horizontally, 85:15, into training and validation datasets. Models learned relationships between features and overruns using training data. Validation data represented new data to test models for generalization performance. Given the limited dataset, cross-validation with 10-folds was used to assess generalization. Multilayer neural networks for deep-learning enable the learning of complex concepts from simpler building blocks. Sequential models implemented in Python using the Keras and TensorFlow 2.0 open-source ML libraries were used. Prediction performance was compared to the P50 RCF schedule and cost overrun uplifts as the baselines as illustrated in Figure 20. The four and two hidden-layer models, which yielded good performance for cost/schedule uplift forecasting are described in Table 13. The mean squared error (MSE) is compared to conventional RCF in Table 14, and forecasting accuracies are compared in Table 15.
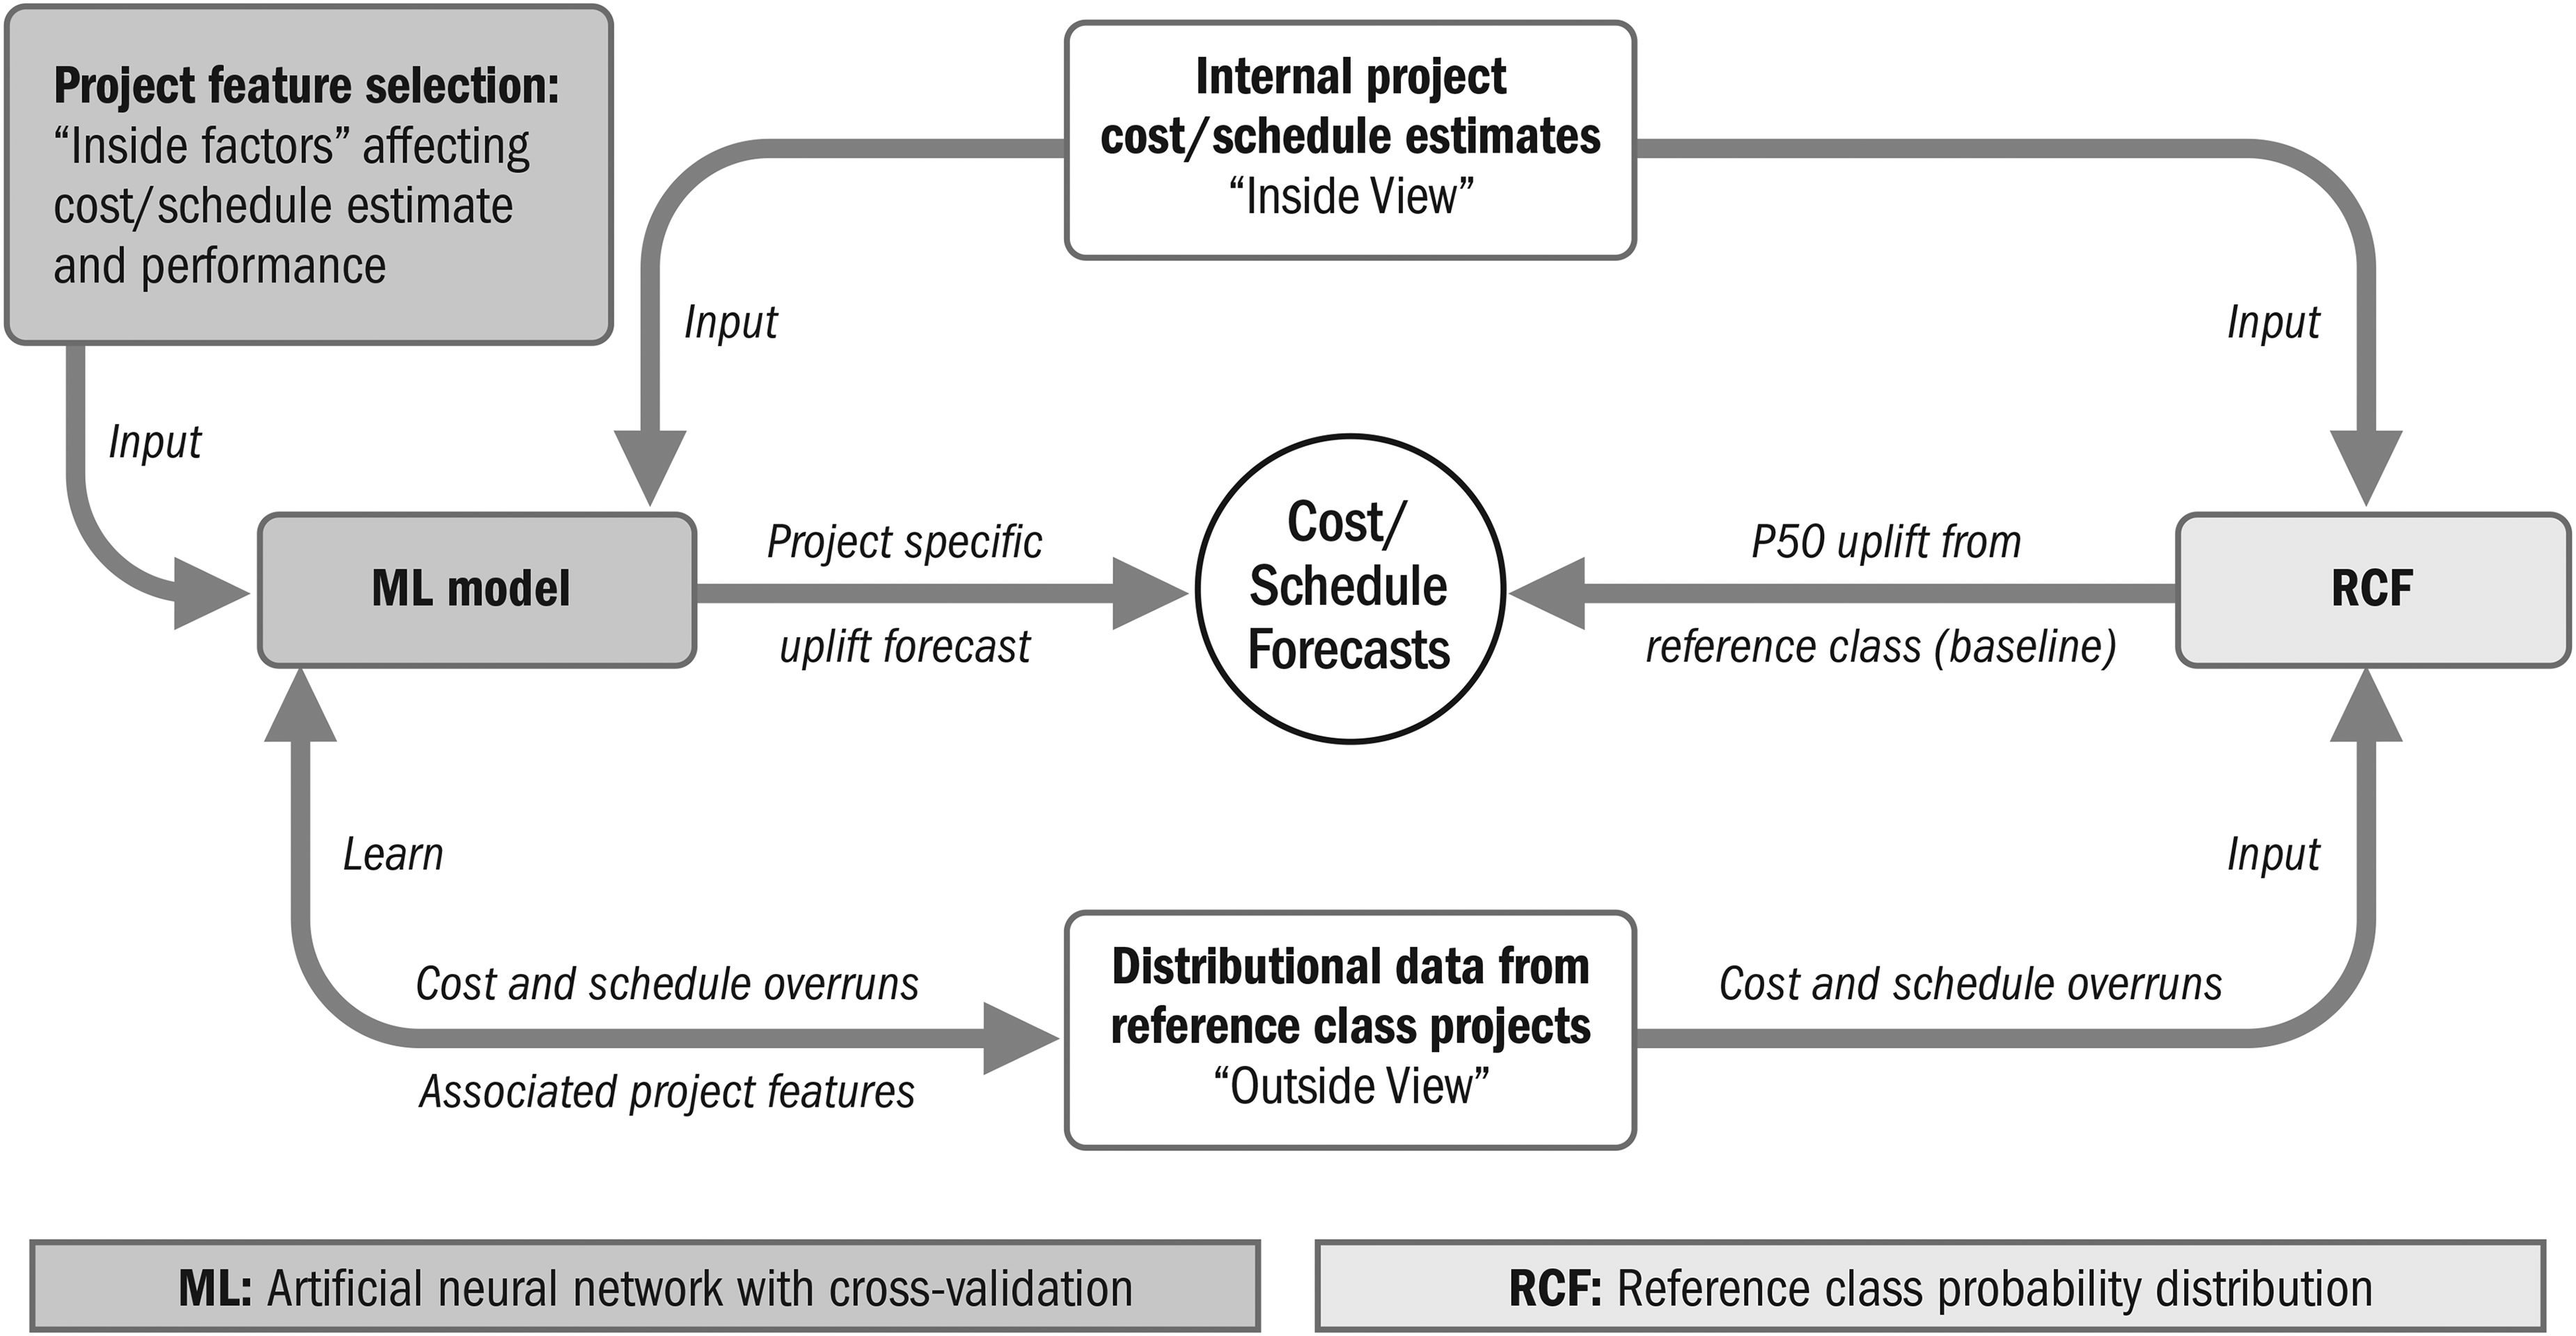
ML model.
Models
MSE Comparison
Forecasting Accuracy Comparison—Percentage of Accurate Forecasts
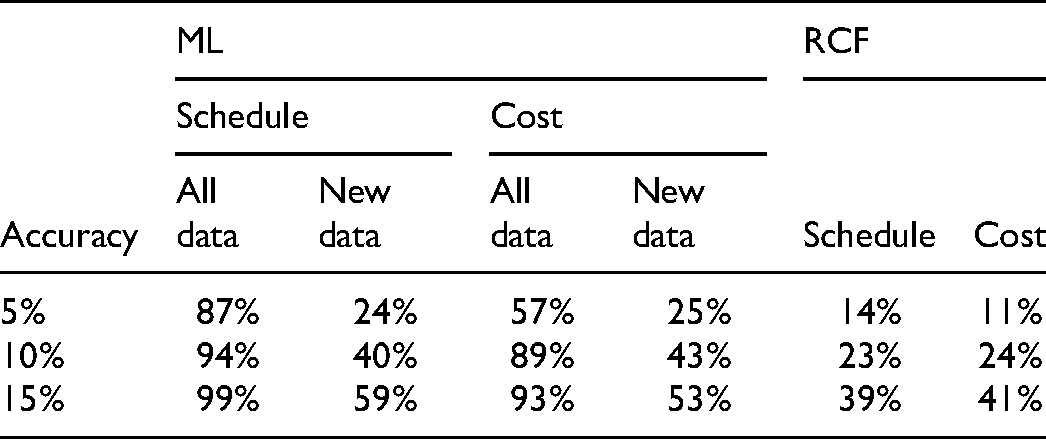
A four hidden-layer model, used to evaluate predictability for these complex projects, performed excellently on trained data: 99% of schedule and 93% of cost overrun forecasts were within 15% accuracy. The MSE was .83% for schedule and 4.2% for cost overrun; five to ten times better than conventional RCF. While extreme outliers were unpredictable, Pearson correlations between predicted and actual overruns were .96 for schedule and .93 for cost (Figure 21).
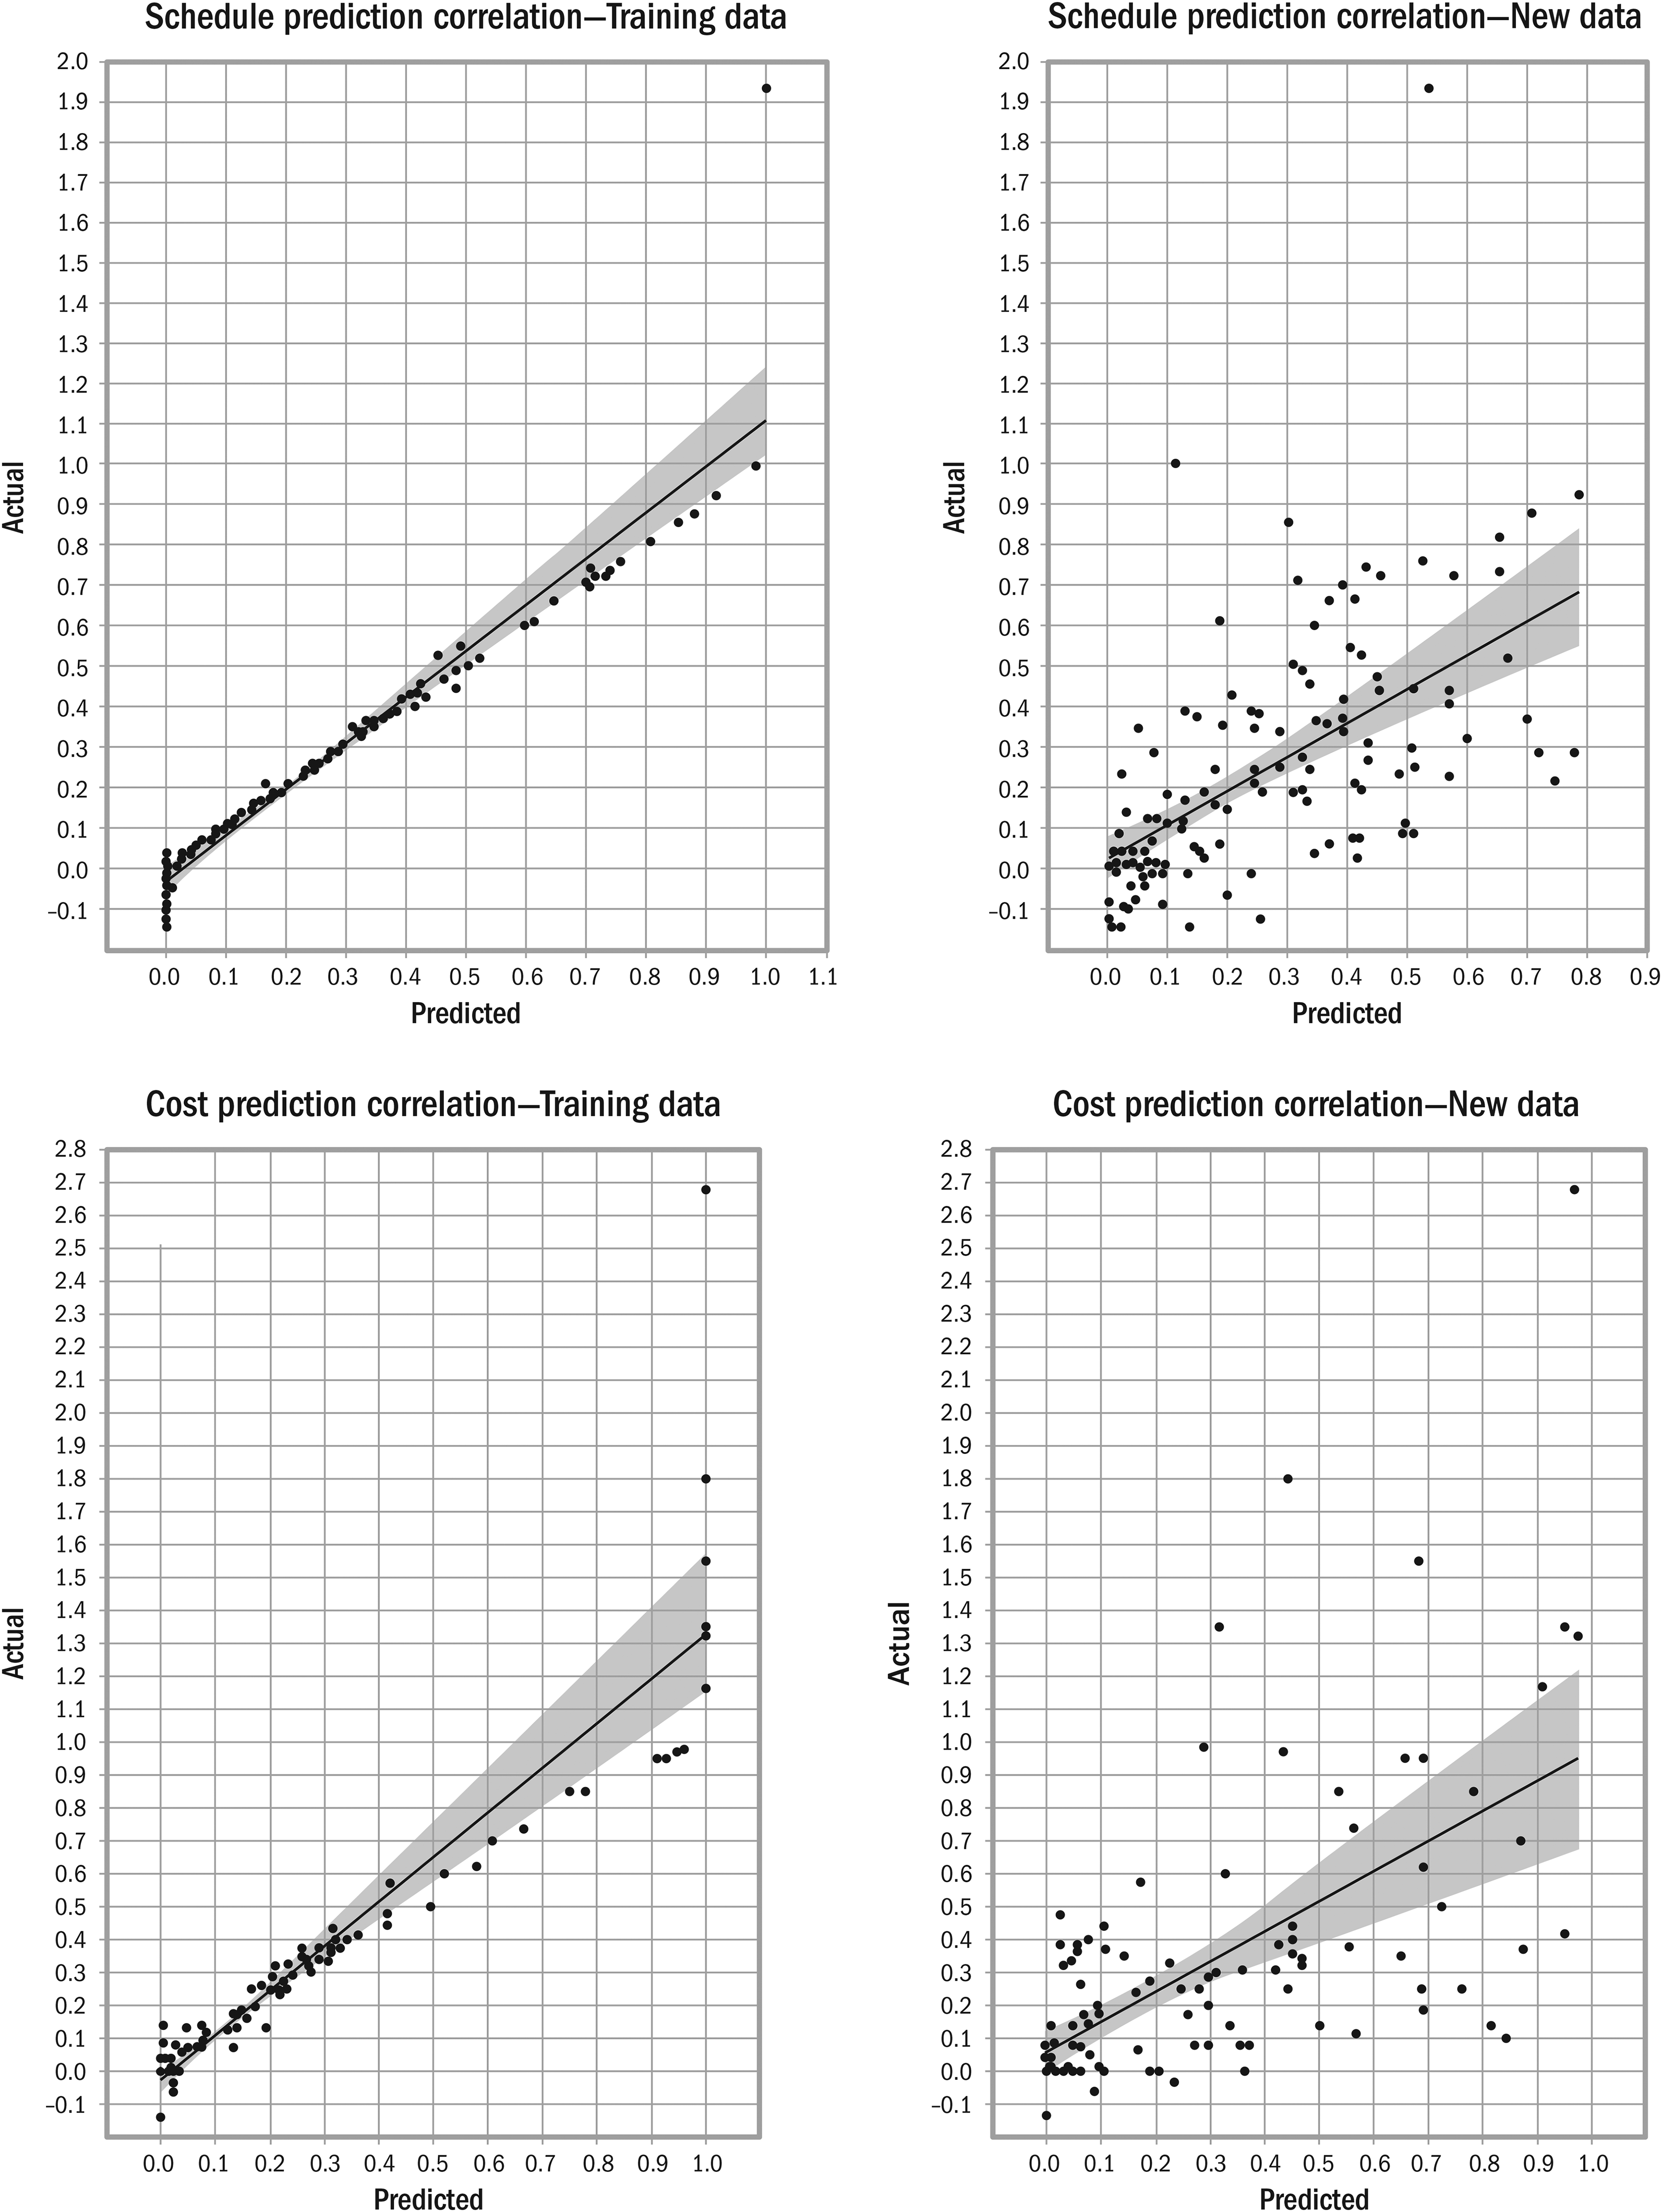
Correlation of predicted and actual overruns.
The four hidden-layer model's performance on validation data not used in training was considerably lower due to overfitting. Generalization performance was improved significantly by reducing layers and employing regularization techniques, limiting the number of epochs and regularization penalties on layers. A two hidden-layer model yielded the best generalization performance, which was significantly better than conventional RCF. Dimensionality reduction using PCA made little difference. Generalization performance was tested on all data by progressively splitting the data ∼90:10 into training and validation datasets, such that over 10 iterations, all the projects were present in the validation dataset as new data exactly once. Predictions for all projects were collated and used to recompute MSE (see Table 14), correlation, and accuracy (see Table 15), for new data. The MSE, 6% for schedule and 12.2% for cost, Pearson correlations for new data, .59 and .6, respectively (p << .01), and prediction accuracy are very good for this challenging forecasting problem. Generalization performance will improve with better training data on more projects and further model optimization.
The models faltered for extreme outliers as expected from complexity theory, even though high overruns were predicted for those projects. For significant non-outlier deviations, factors absent in the model, such as leadership and unknown emergent issues, were seen to materially affect project outcomes. The excellent performance on training data projects is testament to the prediction model's trainability using distributional data. The comparatively inferior performance on new data reflects ML megaproject forecasting limitations from complexity and emergence; however, a significant portion of it is related to data unavailability and inaccuracy.
Significant overrun predictions not evident in actual data can indicate inaccurate or misleading reporting, or positive black swans and significant influence of factors absent from the model. A West African offshore project exemplified a positive black swan; it performed atypically better at close to 10% below the budget, saving more than US$1 billion from unexpectedly excellent drilling performance. Subsurface geological conditions are significant risks in offshore projects and, in this case, emergence helped. Investigation of another West African project, which reported atypically better performance, revealed evidence of significant cost overruns not reflected in the project but the contractor's books. While this can show misleadingly better results on some projects, having contractors take disproportionate risk is untenable over the long term, given the criticality of their expertise (Merrow, 2011).
A more practical generalization test was performed by predicting outcomes for dummy FPSO projects weighted toward high, medium, and low overruns, using features such as novelty, lessons learned, and front-end detail. The model correctly predicted higher uplifts for riskier projects, as seen in Table 16.
Expected Overruns for Dummy Projects

Project-specific uplift distributions for acceptable risk percentiles were generated from the uplift predictions and reference class using a Bayesian approach. Posterior probabilities were computed by assuming a 50% probability for the project-specific predictions and taking the reference class distribution as the prior. This yielded project-specific uplift curves (Figure 22), from which percentile uplifts for acceptable risk are shown in Table 17 for the dummy projects. Outlier risks are incorporated into the curves. While it is impractical to choose risk percentiles incorporating outliers for individual projects, it can be done for long-term portfolios. Novelty, scale, and front-end details can be revisited to reduce risk.
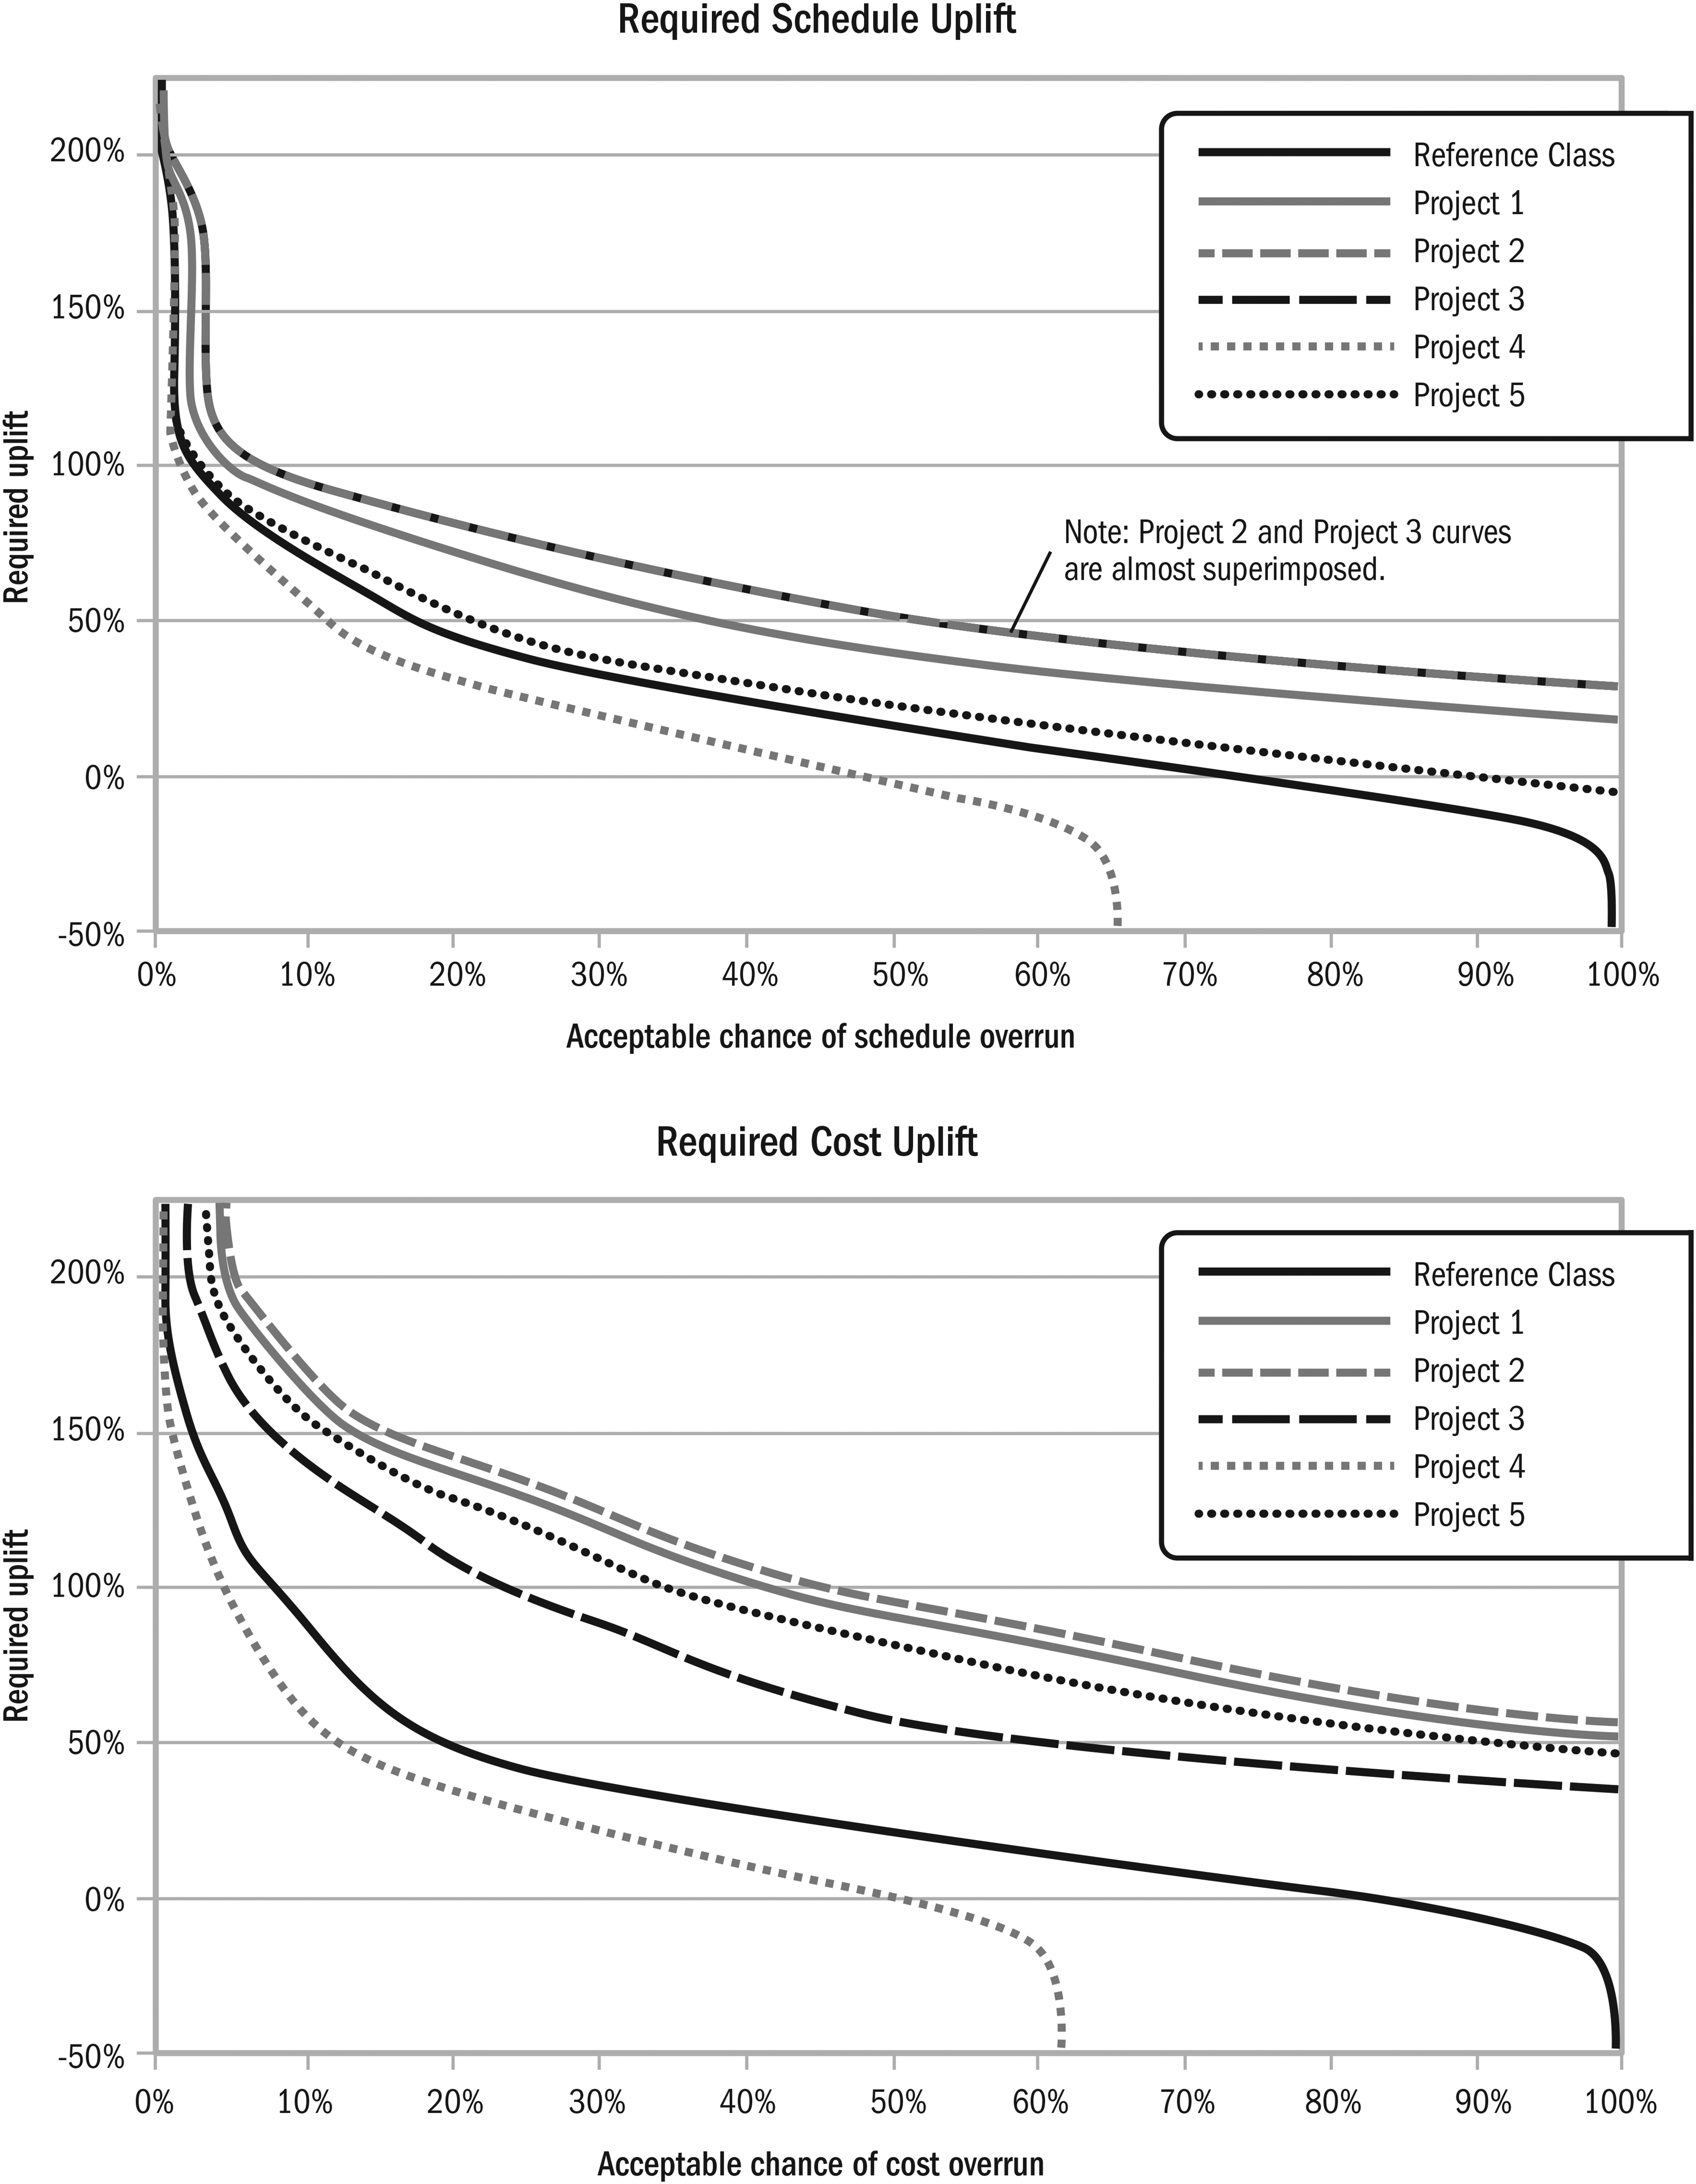
Project-specific uplifts as functions of acceptable risk.
Required Uplifts for Acceptable Risk Percentiles—Dummy Projects
Hypothesis 4 is validated by realizing generalized models for separate cost and schedule forecasts that use individual project features for effective project-specific uplifts.
Conclusion
In this article, we showed that biases, such as optimism, representativeness and availability biases, and principal-agent issues affect O&G offshore project forecasting. Experts displayed significant underestimation of overruns but also significant awareness of them. Projects showed budget and schedule growth after every front-end approval stage, indicating principal-agent issues between and within companies. Responses from the master builders indicate better forecasting performance from some experts. However, these experts still showed bias, and the co-occurrence of the requisite extensive experience and predisposition to obtain such skill cannot be a reliable basis for megaproject planning.
The limitations of heuristics versus the effectiveness of expert intuition are related to the environment's predictability, as discussed by Kahneman and Klein (2009). From in-case and cross-case reviews of our projects, we postulate that expert intuition plays a greater role in response to post-FID execution-phase emergent issues and crises, something to be substantiated in future research. Heuristics can be beneficial in time-critical environments characterized by sparse data and computational capability limitations (Todd & Gigerenzer, 2012). The naturalistic decision-making (NDM) approach focuses on expert intuition's effectiveness in real-world situations bounded by limited unreliable data, computational intractability, and time limits. NDM models such as recognition-primed decision-making (RPD) explain this effectiveness by cue recognition for assessing emerging situations from prior experience and simulation of courses of action based on prior feedback on decision validity (Klein, 1993). Leadership is critical for crisis management (Bundy et al., 2017) during project execution, and effective response under time pressure emphasizes expert intuition. AI/ML may aid project management information systems (PMIS) to recognize emergent issues and support collaborative responses from experts during execution.
However, FID requires forecasting outcomes in planning settings rather than recognizing emerging outcomes in time-critical contexts with sparse information. For megaproject planning, high complexity and lengthy time-horizons can lead to high-impact practically unforeseeable outcomes. The feedback experts “receive from their failures in long-term judgments is delayed, sparse, and ambiguous” (Kahneman & Klein, 2009, p. 523), and principal-agent issues are significant, adversely affecting expert forecasting. In the context of forecasting for FID, the limitations of heuristics are significant.
We established and demonstrated methods to correct forecasts and reduce uncertainty, building on inside view baselines by correcting them. The theoretical foundation and its validation allowed us to find the place for ML in conjunction with expert judgment, balancing benefits from both. The benefits of inside view heuristics, discussed by Gigerenzer and Brighton (2011) and Klein (1993), were present in data interpretation and feature selection; ML models trained on selected features and outside view distributional data discussed by Kahneman and Tversky (1979) and Flyvbjerg (2006) determined project-specific uplift curves. Ecologically valid project features, trained and weighted on outcomes, can attain the benefits of robust heuristics that correspond to their environment discussed by Todd and Gigerenzer (2000). ML application was based on evidence that the same uplift does not apply to every reference class project for a given risk percentile. Our ML model corrected RCF uplifts by learning the relationship between project features and performance outcomes, helped by the chosen features’ environmental validity. Our methods can ameliorate principal-agent issues, correct biases, and reduce overruns in project outcome data over time. This work can be substantiated and expanded as better data become available, and several approaches are outlined here.
The significance of our results can be seen from the substantial costs and delays represented by predicted overruns. Furthermore, the performance forecasting models can be used to manage project features to minimize the potential for overruns. Project features can be optimized using structured methods such as the complexity assessment tool described by Maylor et al. (2013) and by improving front-end development; the ML methods outlined here will provide quantitative feedback on overrun risk mitigation.
Potential Limitations of This Work
Models approximate real-world systems and possess inherent limitations. The future is mutable, and correlations between factors could change, affecting weights and relationships learned by models. Post-FID changes to contractors or scope will affect project-feature coding. Cost and schedule can be affected by macroeconomic and commodity cycles. Predictions are constrained by available distributional data and collection accuracy. The limited number of offshore projects is an upper limit, and many project's actual costs can be unreliable or unavailable. These limitations resulted in several approximations to dates, budgets, and costs during data collection. Furthermore, better projects with more readily available data due to outcome reporting bias may be overrepresented compared to problematic ones. Projects professing successful goal attainment can mask overrun costs borne by contractors, as on the Asgard B project in the North Sea (Upstream, 2000). However, rapid growth and advances in digitally enabled project delivery (Whyte, 2019) could lead to exponential growth in performance data reliability and quantity.
General Limitations and Recommendations
Human behavior can lead to nonoptimal adjustments to uplifted forecasts, such as work expansion to allotted capacity, Parkinson's Law (Parkinson, 1955) and procrastination, or Students’ Syndrome (Goldratt, 1997). Principal-agent issues can also result in nonoptimal adjustments, a criticism that has been directed at RCF (Themsen, 2019).
However, such criticism is essentially directed at how rather than whether RCF should be applied, and there is little reason not to welcome better means of quantifying underperformance risk. It would benefit companies, shareholders, and stakeholders, including societies, given the cost and impact of these projects. The use of uplifts should be in the context of principal-agent issues in an industry, as discussed by Flyvbjerg and Cowi (2004); they can be hidden or used with a fever chart controlling their expenditure.
As Taleb (2008) avers, while true planning is impossible, planning should be done while accounting for limitations. Detailed planning or ML cannot quantify all project risks; strict uncertainty, outcomes with unknown probabilities, and unknown unknowns, are absent from distributional data. Complexity can cause unknown emergent outcomes and chaos. Outliers are very significant to megaproject forecasting but individually unpredictable due to unforeseeable interaction among emergent issues. Outliers in distributional data or “gray swans” (Taleb, 2008, p. 213) have extremely low probabilities of reoccurring the same way. However, they can stand in for future unknown unknowns. Nonoptimal decisions can be satisfactory given temporal, informational, and computational limits when adapted to their environment; this is termed “satisficing” (Simon, 1956, p. 129). Our goals were to extend the reach of satisficing in planning complex projects. Decisions are made in the face of uncertainty, which we have attempted to reduce.
Future Work
This work provides a framework for integrating RCF with ML and can lead to further research on methods and applications. Application to other megaproject classes looks promising: infrastructure and software development projects show similar biases and fat-tailed outcome distributions; the rapidly growing offshore floating wind sector with limited prior projects has similarities to offshore O&G. This, and the limitations imposed on ML models by unavailable or unreliable project data, strongly substantiate the requirement for rigorous cross-industry project accounting standards and practices, such as the IASB and FASB rules for reporting in firms; project governance would benefit immensely. More accurate data collection and de-biasing of reporting can lead to significant improvements in forecasting accuracy.
There is further potential for optimizing the performance of our models. Furthermore, project features not in our models can be incorporated, and more accurate data can be utilized. The random number generated PDF showed great potential for approximating overrun distributions, especially for new sectors with few previous projects, such as offshore wind. Much data were obtained on the performance weightage of theory-coded features from our trained models, offering several promising avenues of inquiry.
Footnotes
Declaration of Conflicting Interests
The author(s) declared no potential conflicts of interest with respect to the research, authorship, and/or publication of this article.
Funding
The author(s) received no financial support for the research, authorship, and/or publication of this article.