




Abstract
Background
Only a few studies have used in/opposed phase method for a quantitative evaluation of fat fraction in the spine.
Purpose
To compare multivoxel proton MR spectroscopy and chemical-shift gradient-echo MR imaging for bone marrow fat quantification in vertebral compression fractures (VCF).
Material and Methods
Vertebral marrow fat quantification in fifteen patients was measured at 3.0-T. Multi-voxel proton spectroscopy (MRS) and in/opposed-phase MR imaging using a fat map build with a triple-echo gradient-echo sequence was used. All the patients had benign vertebral collapse. Bone marrow fat content was evaluated by both techniques in compressed (acute or chronic) and in non-compressed vertebrae.
Results
The percentage of fat fraction measured by the triple-echo sequence was well correlated with those calculated by MRS (r2 = 0.85; P < 10-4). There was a significant decrease of fat fraction in acute VCF versus both chronic VCF (P < 10-9) and non-fractured vertebrae (P < 10-7). There was no significant difference in fat fraction evaluated by both techniques between non-fractured vertebrae and chronic VCF.
Conclusion
We have validated the in/opposed phase method compared with MRS for vertebral bone marrow fat quantification. The fat mapping using a triple-echo gradient-echo sequence allows distinguishing acute and chronic benign VCF.
Osteoporotic fractures are common and are found in 40% of American women and 24% of European women over the age of 50 years (1, 2). Osteoporosis is a generalized bone disease with decreased bone mass and altered bone microarchitecture leading to increased fracture risk (3, 4). Additionally, there is a decrease in bone strength as well as increased fat content of bone marrow (3, 5). Measuring the richness of fat inside bone marrow using a non-invasive technique seems consequently useful. MR spectroscopy (1H-MRS) is a new diagnostic tool for vertebral bone marrow analysis (6-8). A limited number of imaging-based fat quantification techniques have also been proposed to replace MRS (9, 10). Recent studies have illustrated the utility of In-Out Phase MR imaging to evaluate liver steatosis (11, 12) as well as for bone marrow fat quantification (13, 14). In this work carried out at 3.0-T, we prospectively quantified vertebral bone marrow fat using both multi-voxel 1H-MRS and a triple-echo dual-flip angle gradient-echo sequence (an improved in/opposed phase MR imaging recently validated for fat quantification of the liver) (12). This study was performed in osteoporotic vertebrae in the context of acute compression fracture and chronic compression fracture. The aim of this study was to evaluate the feasibility of these techniques and to correlate their results.
Material and Methods
Subjects
A total of 15 patients (11 women and 4 men, age range 40-88 years, mean age 70 years), examined between January and December 2008, were included in this prospective study. The subjects underwent MR imaging (MRI) for the evaluation of a vertebral fracture responsible for back pain lasting less than 2 months. All patients had VCF due to osteoporosis (proved by measuring bone mineral density of the third lumbar vertebra by dual-energy X-ray absorptiometry). The exclusion criteria were: (a) history of malignancy or suspicious bone lesions seen on plain film or CT scans; and (b) inability to undergo MRI examination. In 10 cases, osteoporosis was confirmed by the histopathological exam on the bone sample taken during percutaneous vertebroplasty. For the five remaining patients who did not have vertebroplasty, an 18-month clinical follow-up was performed. Our regional ethics committee approved the study and informed consent was obtained from all patients before the MR examination.
MR imaging and spectroscopy
MRI and spectroscopy was performed on a 3.0-T unit (Magnetom Trio Tim; Siemens Medical Solutions, Erlangen, Germany), using an 8-channel torso receiver coil. After acquisition of scout images in transverse, coronal, and sagittal planes, T1-weighted sagittal images (TR/TE 845/8.6 ms), STIR-weighted (7000/54 ms) sagittal images, T2-weighted sagittal (3000/106 ms), and coronal planes (3200/106 ms) of the thoracic and lumbar portions of the spine were obtained in order to identify the VCF and to guide positioning of the MR spectroscopy grid.
Spectroscopy data were acquired using the bidimensional point-resolved spectroscopy sequence (2D-PRESS) and unsuppressed water-fat spectra were acquired with the following parameters: TR/TE 5000/30 ms, FOV 10 cm, CSI acquisition matrix 16 × 16, and a voxel size of 12.5 × 8.6 × 20.0 mm for a total scanning time of a little under 1.5 min (1.1-1.49 min). Global 3D shimming was performed before each data acquisition. The multivoxel grid included three vertebrae and was centered on the compressed fracture (Fig. 1).
Example of grid positioning in spectroscopy for a 70 year-old woman with acute (L4) and chronic compression fracture (L3, L5)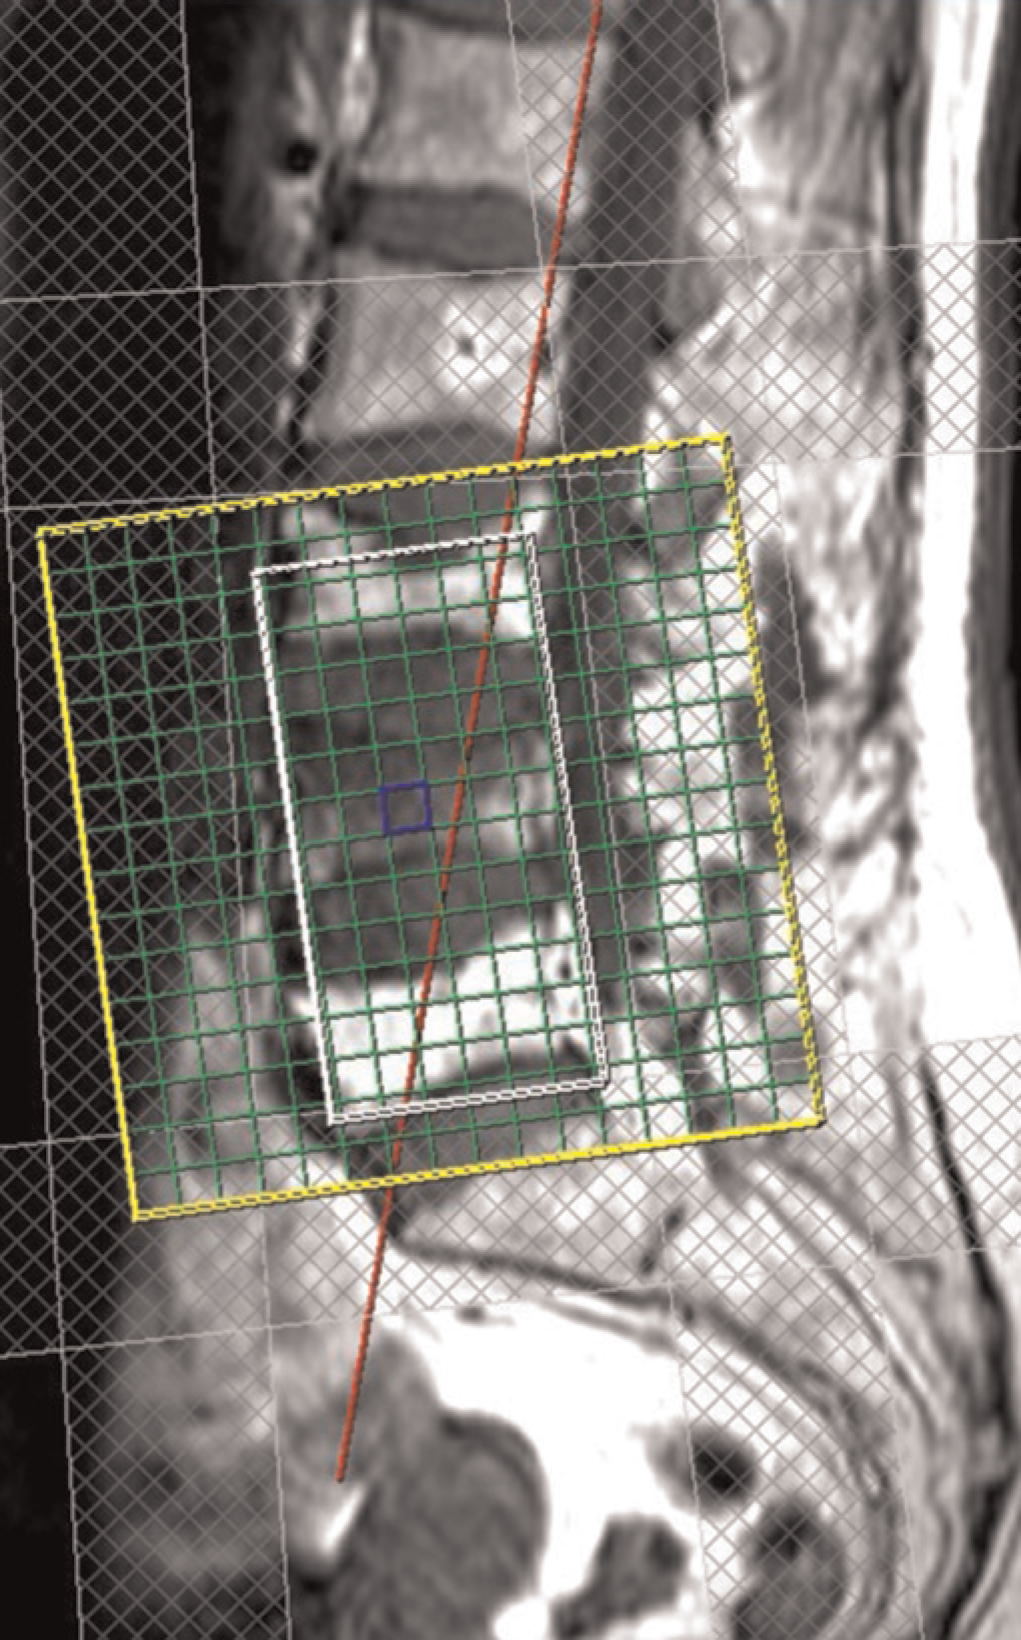
The In-Out phase technique was performed using a low-T1-weighted two-dimensional triple-echo spoiled gradient-echo sequence with the following parameters: repetition time (msec)/echo time (msec) of 192/2.46 (in-phase [IP1]), 3.69 (opposed-phase [OP]), and 4.92 (in-phase [IP2]); FOV 420 mm; section thickness 5 mm; matrix 320 × 320; number of sections 13; and acquisition time 2.5 min. We also adopted a dual flip angle approach (20° and 70°), as suggested earlier (11), in order to remove any possible ambiguity with respect to the dominant fraction, i.e. water or lipid (11, 12, 15). Indeed, in cases where fat is the minor (resp. major) constituent, the fat fraction calculated from the highly T1-weighted (70°) dual-echo gradient-echo sequence is greater (resp. lower) than that calculated from the intermediate-weighted (20°) sequence (11).
1H-MR spectroscopic data analysis
Spectra were analyzed using the Linear Combination of Model spectra LCModel package version 6.2.0C (S. Provencher; Oakville, Ontario, Canada, available at http://s-provencher.com/pages/lcmodel.shtml) (16), which is a user-independent frequency domain spectral-fitting program. All spectra consisted of a water peak (at 4.7 ppm) and one dominant lipid peak, methylene (CH2 at 1.3 ppm). For each voxel, relative vertebral fat content is expressed in lipid-to-water-ratio (LWR) obtained by dividing the lipid peak area by the water peak area. The percentage fat fraction (% FF) was derived from the formula: LWR × 100 / (LWR +1). To avoid very long acquisition times, we used a repetition time of 1.7 sec during spectroscopy. The water and fat signals were consequently saturated to different extents because their T1 values are very different. A correction factor for the T1 saturation effect was estimated for some subjects (n = 4) by performing acquisitions at a longer repetition time (TR = 5 s). Thus, the correction factor could be applied to the data collected at TR 1.7 s. From the spectroscopic grid (Fig. 1), we selected voxels within the spectroscopic volume of interest and excluded voxels located on the vertebral disc or on the spinal canal.
In phase-opposed phase data analysis
A fat fraction map was obtained from each section using pixel-by-pixel image calculations performed on a workstation (Leonardo release VB13; Siemens, Erlangen, Germany), as follows: a first image representing the IP signal intensity corrected for T2* decay (IPCorrected image) was calculated by using the ‘arithmetic mean’ function of the workstation, applied to each pair of in-phase images (IP1 and IP2) - since T2* relaxation was assumed to be linear between IP1 and IP2 (17) - and computed as SIIP*exp(-ΔTE/T2*). A second image (subtraction image) was computed using the ‘subtraction’ function of the workstation, applied to each pair of IPCorrected and OP images. Finally, the fat fraction map was calculated using the ‘division’ function of the workstation, applied to each pair of subtraction and IPCorrected images then multiplied by 50 to produce direct measurements of the fat fraction (the signal of a pixel represents the percentage of fat content) (Fig. 2). The postprocessing time necessary to build a complete fat map was consistently shorter than 2 min.
MR images and bone marrow fat map of a 73-year-old woman with an acute VCF of L4 and a Schmorl's nodule on L1. The three MR images obtained from the triple-echo (consecutive in-phase [IP1], opposed-phase [OP], and in-phase [IP2] echo times) spoiled gradient echo sequence (192/2.46, 3.69, 4.92; flip angle 20°) are displayed on the top from the left to the right. The bone marrow fat map is built after three successive operations performed using basic image calculation functions. The IPCorrected image (bottom left of the figure) represents the in-phase signal intensity corrected for T2*decay and is calculated using the ‘arithmetic mean’ function of the workstation (IP1 + IP2)/2. A subtraction image is then obtained using the ‘subtraction’ function of the workstation (IPCorrected - OP). Finally, the fat fraction map (on the bottom right of the figure) is obtained using the ‘division’ function of the workstation applied to the subtraction image and IPCorrected image then multiplying by 50 (100*(subtraction/2*IPCorrected)) to obtain direct measurements of the bone marrow fat fraction (the signal of a pixel represents the percentage of bone marrow fat)
For the data analysis of the quantitative in/opposed phase MRI, we used a program developed in-house using PVWave (Visual Numerics Inc. Boulder, CO, USA) that allowed the superposition of a grid identical to that used in spectroscopy on the Fat Fraction image. For each ROI, the result represents the percentage of fat when water is the major constituent or the percentage of water (100 - % FF) when fat is the major constituent.
Statistical analysis
We used the software SYSTAT 10.2 (Systat Software, Inc. Chicago, IL, USA) to analyze the results of statistical analysis. The results were expressed as mean ± SD and analysis of variance (ANOVA) and Pearson's correlation were used. We divided our data into three different groups of vertebrae: acute VCF, chronic VCF and non-fractured vertebrae. Statistical significance was set at P ≤ 0.05.
Results
There were two types of VCF in our population with more than one fracture type in some subjects: acute (n = 10) or chronic compression (n = 9), respectively with or without a bone marrow edema pattern (hypersignal on T2 STIR) (Table 1). Spectra were of good quality in all cases, i.e. the full width at 50% peak height, was always better than 0.45 ppm. Fig. 3 is an example of spectra taken from a normal vertebra and from an acute compressed vertebra. Mean values of fat fraction obtained with IOP triple-echo gradient-echo imaging showed an excellent correlation (Pearson correlation: r2 = 0.85, P < 10-4) with the spectroscopic values in Fig. 4.
Example of spectrum generated from LCModel: Water (W) left and fat protons (F) right. Above: Acute compression fracture, below: non-compressed vertebrae
Correlation between fat fraction estimated by spectroscopy and MRI (In-Out): r2 = 0.85; P < 10-4
Patient data

The analysis for fractured vertebrae was conducted using the ANOVA test. Table 2 shows a significant decrease of fat fraction (evaluated by both techniques) in acute VCF versus both chronic VCF (P, 10) and non-fractured vertebrae (P < 10-7). Percent fat content decreased in acute VCF due to edema and yellow marrow replacement. However, there was no significant difference in FF evaluated by both techniques between non-fractured vertebrae and chronic VCF.
Comparison of fat fraction (FF) at MRI and MRS

Statistically significant difference between non-fractured vertebrae and acute compression (P < 10-7)
Statistically significant difference between acute compression and chronic compression (P < 10-9)
Statistically significant difference between acute compression and chronic compression (P < 0.07)
Discussion
In this work we used the in/opposed phase triple-echo method recently employed for quantification of liver fat.
This method has proved its ability to replace MR spectroscopy for quantification of hepatic steatosis (12), given the excellent correlation and concordance between those techniques. The comparison of this method with 1H MR spectroscopy herein showed similar results, thereby confirming the validity of the triple-echo technique applied to vertebral bone marrow fat quantification. The combination of 1H-MRS and opposed-phase imaging for an accurate quantification of FF has been suggested (18), but we think that the use of a triple echo method with a dual flip angle is sufficient for a valid quantification of fat. Moreover, the fact that the spectroscopic option is not available in every MR imaging center represents a limiting factor for the use of this later technique.
The use of 2D-PRESS for bone analysis is quite new and has the advantage of allowing a selection among several voxels within and around the studied vertebrae, which can be helpful for marrow evaluation of focal or spotty disease.
According to Träber et al. (19), the relative fat fraction is a promissing parameter in the differential diagnosis between osteoporosis and tumorous infiltrations of bone marrow. The potential value of MR spectroscopy in assessing bone weakness has also been studied earlier (20) and the values obtained in our study (Table 2) are similar to those (6, 21), but bone marrow osteoblast-adipocyte relationship is complex and the two cell types can be independently affected (22). We have also demonstrated that there is a significant difference between non-fractured vertebrae and acute fracture, and between acute compression and chronic compression. This may correspond to the fracture healing process (the recently collapsed vertebra shows bone edema, hyperemia, and yellow marrow replacement) (23).
Very few studies have used the in/opposed phase imaging for a quantitative (24) rather than a qualitative (25, 26) evaluation. In our study, relative fat quantification demonstrated a significant drop in fat content during the acute phase of VCF. This fall of the fat fraction may be the consequence of increased free water in the interstitial space of bone marrow of the fractured vertebra (27, 28). The in/opposed phase technique, with its better spatial coverage of the spine than MRS, can also provide analysis of other tissues such as the inter-vertebral discs or muscles.
There are several limitations of the present study including the reduced number of patients and the absence of histologic quantification of the bone marrow fat fraction. Moreover, all the included subjects have osteoporosis, and the study does not have a true control group.
In conclusion, fat mapping using a triple-echo gradient-echo sequence allows one to distinguish between acute and chronic benign VCF.
Footnotes
Acknowledgment
The authors are grateful to Rehan Yazdani, MD for his review of the article.
None