
Abstract
Background
Diffusion-weighted imaging (DWI) offers a non-invasive technique that can reveal microscopic details about the architecture of both normal and anomalous tissues. Some studies have confirmed DWI can detect the early changes of tumors that have originated from various organs, even after treatment.
Purpose
To compare the usefulness of apparent diffusion coefficient (ADC) and morphologic magnetic resonance (MR) imaging for monitoring the therapeutic response of metastatic disease in lymph nodes to radiotherapy.
Material and Methods
Twenty-six rabbits (metastatic, n = 17; non-metastatic, n = 9) were divided into group A (metastatic, n = 10), group B (metastatic, n = 7) and group C (non-metastatic, n = 9). Groups A and C underwent irradiation, whereas group B was set as a reference. Standard MR imaging and DWI were performed before and 1, 3, and 7 days after radiotherapy for all rabbits. The lymph node volumes and ADCs were measured and evaluated with repeated measures ANOVA. The difference between group A and B was analyzed using Student's t-test.
Results
In all rabbits, a total of 35 lymph nodes were found, including 16 nodes in group A, 10 in group B and nine in group C. In group A, 3 and 7 days after therapy ADCs were significantly higher than pre-treatment and 1 day after therapy (P < 0.05). For groups A and B, a significant difference of ADCs was present 7 days after therapy. A significant difference of variation of ADCs among the three groups was also present (P < 0.001).
Conclusion
DWI is superior to morphological MRI in monitoring early radiation response in animal models.
Metastatic disease found in lymph nodes is an important criterion of tumor development and considered as one of the most important prognostic factors. Radiotherapy is a primary method for the treatment of metastatic lymph nodes. It can also be used, at times, to prevent local recurrence after surgery (1, 2). The response to the therapy, which is typically evaluated based on morphological images, plays a significant role in a patient's prognosis. Pathological examinations are considered the ‘gold standard’ to evaluate the response of lymph nodes to irradiation, however, the occult locations of some lymph nodes and radiotherapy reactions in peripheral tissues make it difficult to fully evaluate a patient's response to radiotherapy.
Currently, either computed tomography (CT) or standard MRI are the most common methods to monitor changes in tumor size (3-5). Unfortunately, these assessments occur relatively delayed in the disease process due to functional changes in tumors that occur prior to the alterations in size that can be detected by morphological imaging. DWI, as a non-invasive MRI technique, offers the possibility to monitor changes in both normal and anomalous tissue at a cellular level. Several animal models and human studies have indicated the potential usefulness of DWI in helping predict response to chemotherapy (6-10). Researchers have noted early increases in ADCs that occur after treatment, and these increases in ADC are a more sensitive marker for response to treatment than changes in tumor size (11-13). To our knowledge, researchers have not evaluated the early alterations of ADCs in metastatic lymph nodes after radiotherapy. This study is aimed to evaluate the ADCs of lymph nodes to evaluate the early response to radiotherapy in animal models.
Material and Methods
Animal model
All studies were conducted with the approval of the Animal Care Committee at our institute. The experiments were conducted on 26 healthy New Zealand white rabbits (weighing 1.8-2.5 kg), which were provided by The Animal Experimental Center of our Hospital.
All rabbits were divided into two groups: metastatic group (n = 17) and non-metastatic group (n = 9). In the metastatic group, VX2 carcinoma suspension (0.5 mL, approximately 1 × 10⁶-8 cells/mL) was injected in the right thigh of each animal. In addition, the metastatic group was divided into two subgroups: group A (n = 10) and group B (n = 7). In the non-metastatic group (C), Complete Freund's adjuvant (F5881, Sigma, USA) was injected on the left dorsal footpad of each animal with 0.5 mL. Groups A and C received ionizing irradiation two weeks and one week after injection, respectively. Group B served as the control group.
Standard MRI and DWI were performed before and at 1, 3, and 7 days after irradiation. At each of the time intervals, two animals, respectively, from group A and C were sacrificed for histological analysis.
Irradiation
Each rabbit in groups A and C received 10 Gy of radiation, using a linear accelerator (6MV X line, Varian 21EX, Varian Medical Systems, CA, USA). The rabbits were placed in a prone position in an all-body lead shield. A dose rate of 2 Gy/min, a source-to-surface distance of 100 cm, and a field size of 8 cm × 14 cm were used.
MR examination
All MR imaging studies were performed with a 1.5-T scanner (MAGNETOM Avanto, Siemens Healthcare, Erlangen, Germany) with a commercial 6-channel surface coil. MRI images covered the bilateral popliteal fossa and iliac fossa areas. Standard MR imaging and DWI images were acquired during the same procedure. Standard MR imaging consisted of a coronal T2-weighted localizing sequence (repetition time msec/echo time msec, 4.09/2), an axial T2-weighted turbo spin-echo sequence (3000/14; average 6; FOV 320 mm2; matrix 256 × 192), and a T1-weighted turbo spin-echo sequence (640/11; average 6; FOV 320 mm; matrix 256 × 192).
DWI images were acquired in the transverse plane by using a spin-echo echo-planar imaging sequence with diffusion-gradient encoding in three orthogonal directions. The parameters were as follows: TR 5000 ms, TE 81 ms, FOV 320 mm2, matrix 128 × 128, section thickness 4 mm, gap 0.4 mm, and b values of 0, and 1000 sec/mm2. The ADCs were calculated according to the formula ADC = [ln(SI1 / SI2)]/(b2-b1), where SI1 and SI2 are signal intensities by sequence S1 and S2, b1 (= 0) and b2 (= 1000) are gradient factors of sequences S1 and S2, respectively. ADC maps were automatically calculated inline on a pixel-by-pixel basis with incorporated software on a commercial workstation (Syngo; Siemens Healthcare, Erlangen, Germany).
Imaging analysis
The imaging features of lymph nodes on T1-weighted imaging (T1WI) and T2-weighted imaging (T2WI) were evaluated. According to World Health Organization criteria (14), volumes of all nodes were measured at each time interval. Volumes were obtained by the products of longest diameter and the longest perpendicular diameter (2D measurement).
DWI images and ADC maps were evaluated on the workstation (Syngo, Siemens Healthcare). Referring to T2WI, circular regions of interest (ROI) were respectively placed in the parenchyma of each node, avoiding vessels, necrosis and cystic areas. Each ROI was composed of 5 pixels. The average ADC of three measurements of each node was taken as a representative value.
Pathologic examination
After MRI examination at each time interval, one rabbit from groups A and C, respectively, was sacrificed, and lymph nodes were removed and infiltrated with 10% formalin for fixation. All lymph node specimens were embedded with paraffin and cut in 5-um-thick histological sections. The sections were stained with hematoxylin-eosin (H&E).
Statistical analysis
Statistical analysis was performed using SPSS (version 16.0; SPSS, Chicago, IL, USA). Results are presented as mean + SD for continuous variables. The variant of volumes and ADC values were evaluated with repeated measures analysis of variance (ANOVA). Student's t-test was used to compare the lesion volumes and ADC values between group A and B at each of the time intervals. A difference of P < 0.05 was considered significant.
Results
MR imaging
A total of 26 enlarged lymph nodes were found in group A and B, including 16 nodes in group A and 10 nodes in group B. In group C, nine enlarged nodes were all in the ipsilateral popliteal fossa.
All nodes showed iso-intensity on T1WI and hyper-intensity on T2WI. In group A, by 7 days after irradiation, necrosis was seen in seven nodes with hyper-intensity signal on T2WI. Table 1 summarizes the volumes of lymph nodes in the metastatic group at each time point before and after radiotherapy. No statistically significant difference in nodal volume was shown between variation in the irradiation group and that in the control group (B) (F = 1.687, P > 0.05). There was no statistical significance of nodal volumes shown between group A and B at each time interval (all P > 0.05).
Volumes of lymph nodes at each time interval (mm2)

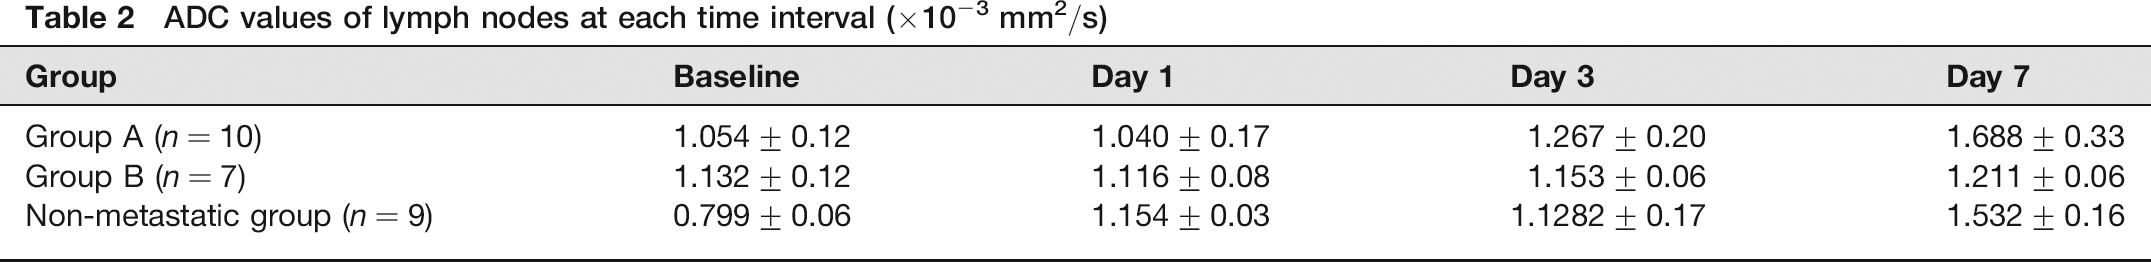
The parenchyma of lymph nodes showed high signal intensities on DWI maps and low signal intensities on ADC maps (Figs. 1 and 2). Table 2 summarizes the ADC values of lymph nodes in the metastatic and the non-metastatic groups at each time interval before and after radiotherapy. Statistically significant difference was shown between the variation of ADC values of irradiated nodes and that of control rabbits (F = 9.682, P < 0.001) (Fig. 3). No statistically significance difference was shown between the variation of ADC values between group A and C (F = 2.722, P > 0.05). In group A, before and 1 day after radiotherapy, there was no statistical significance (P > 0.05) of ADC values of irradiated lymph nodes, although a slight decrease of ADC was noted for 1 day after radiotherapy. However, ADCs at 3 days and 7 days were significantly greater than that on the day prior to irradiation and day 1 in group A (all P < 0.05).
DW MR images of lymph node metastases in group A before (a) and 1 day (b), 3 days (c) and 7 days (d) after treatment. Enlarged lymph nodes were seen on the right (arrow). These nodes showed high signal intensities on DWI maps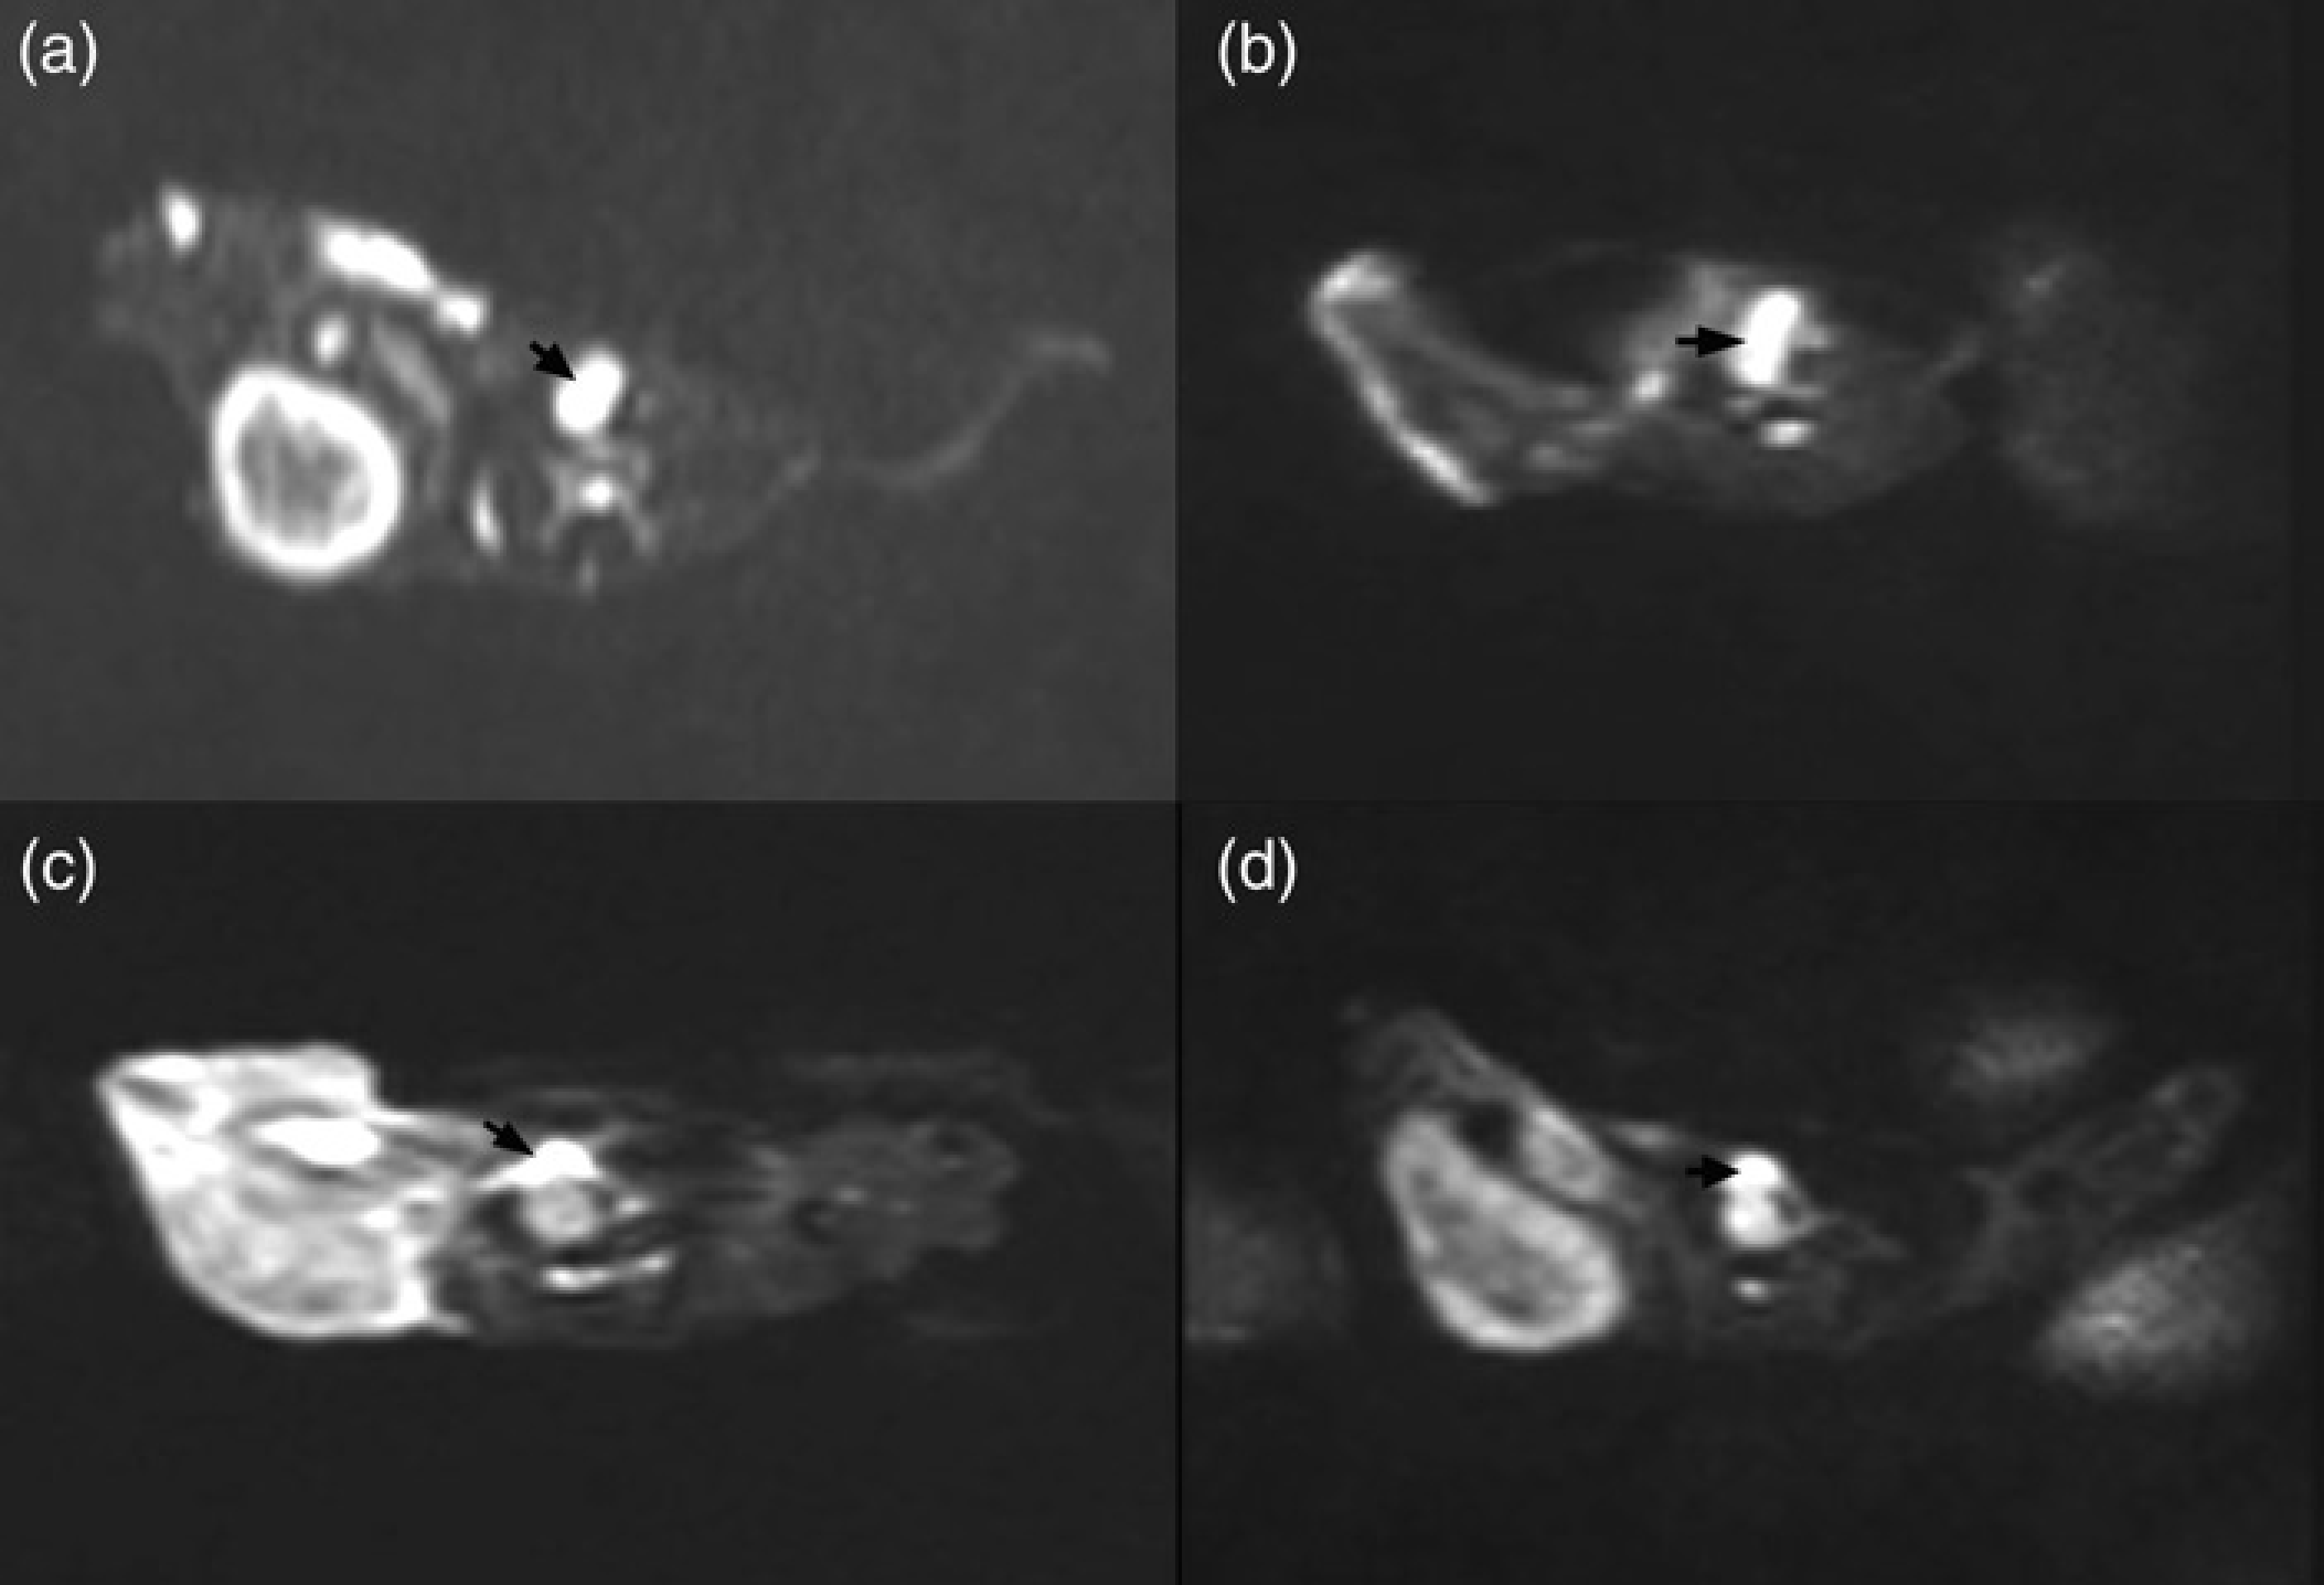
DW MR images of lymph node in non-metastatic group before (a) and 1 day (b), 3 days (c) and 7 days (d) after treatment. Enlarged lymph nodes were seen on the left popliteal fossa (arrow). These nodes showed high signal intensities on DWI maps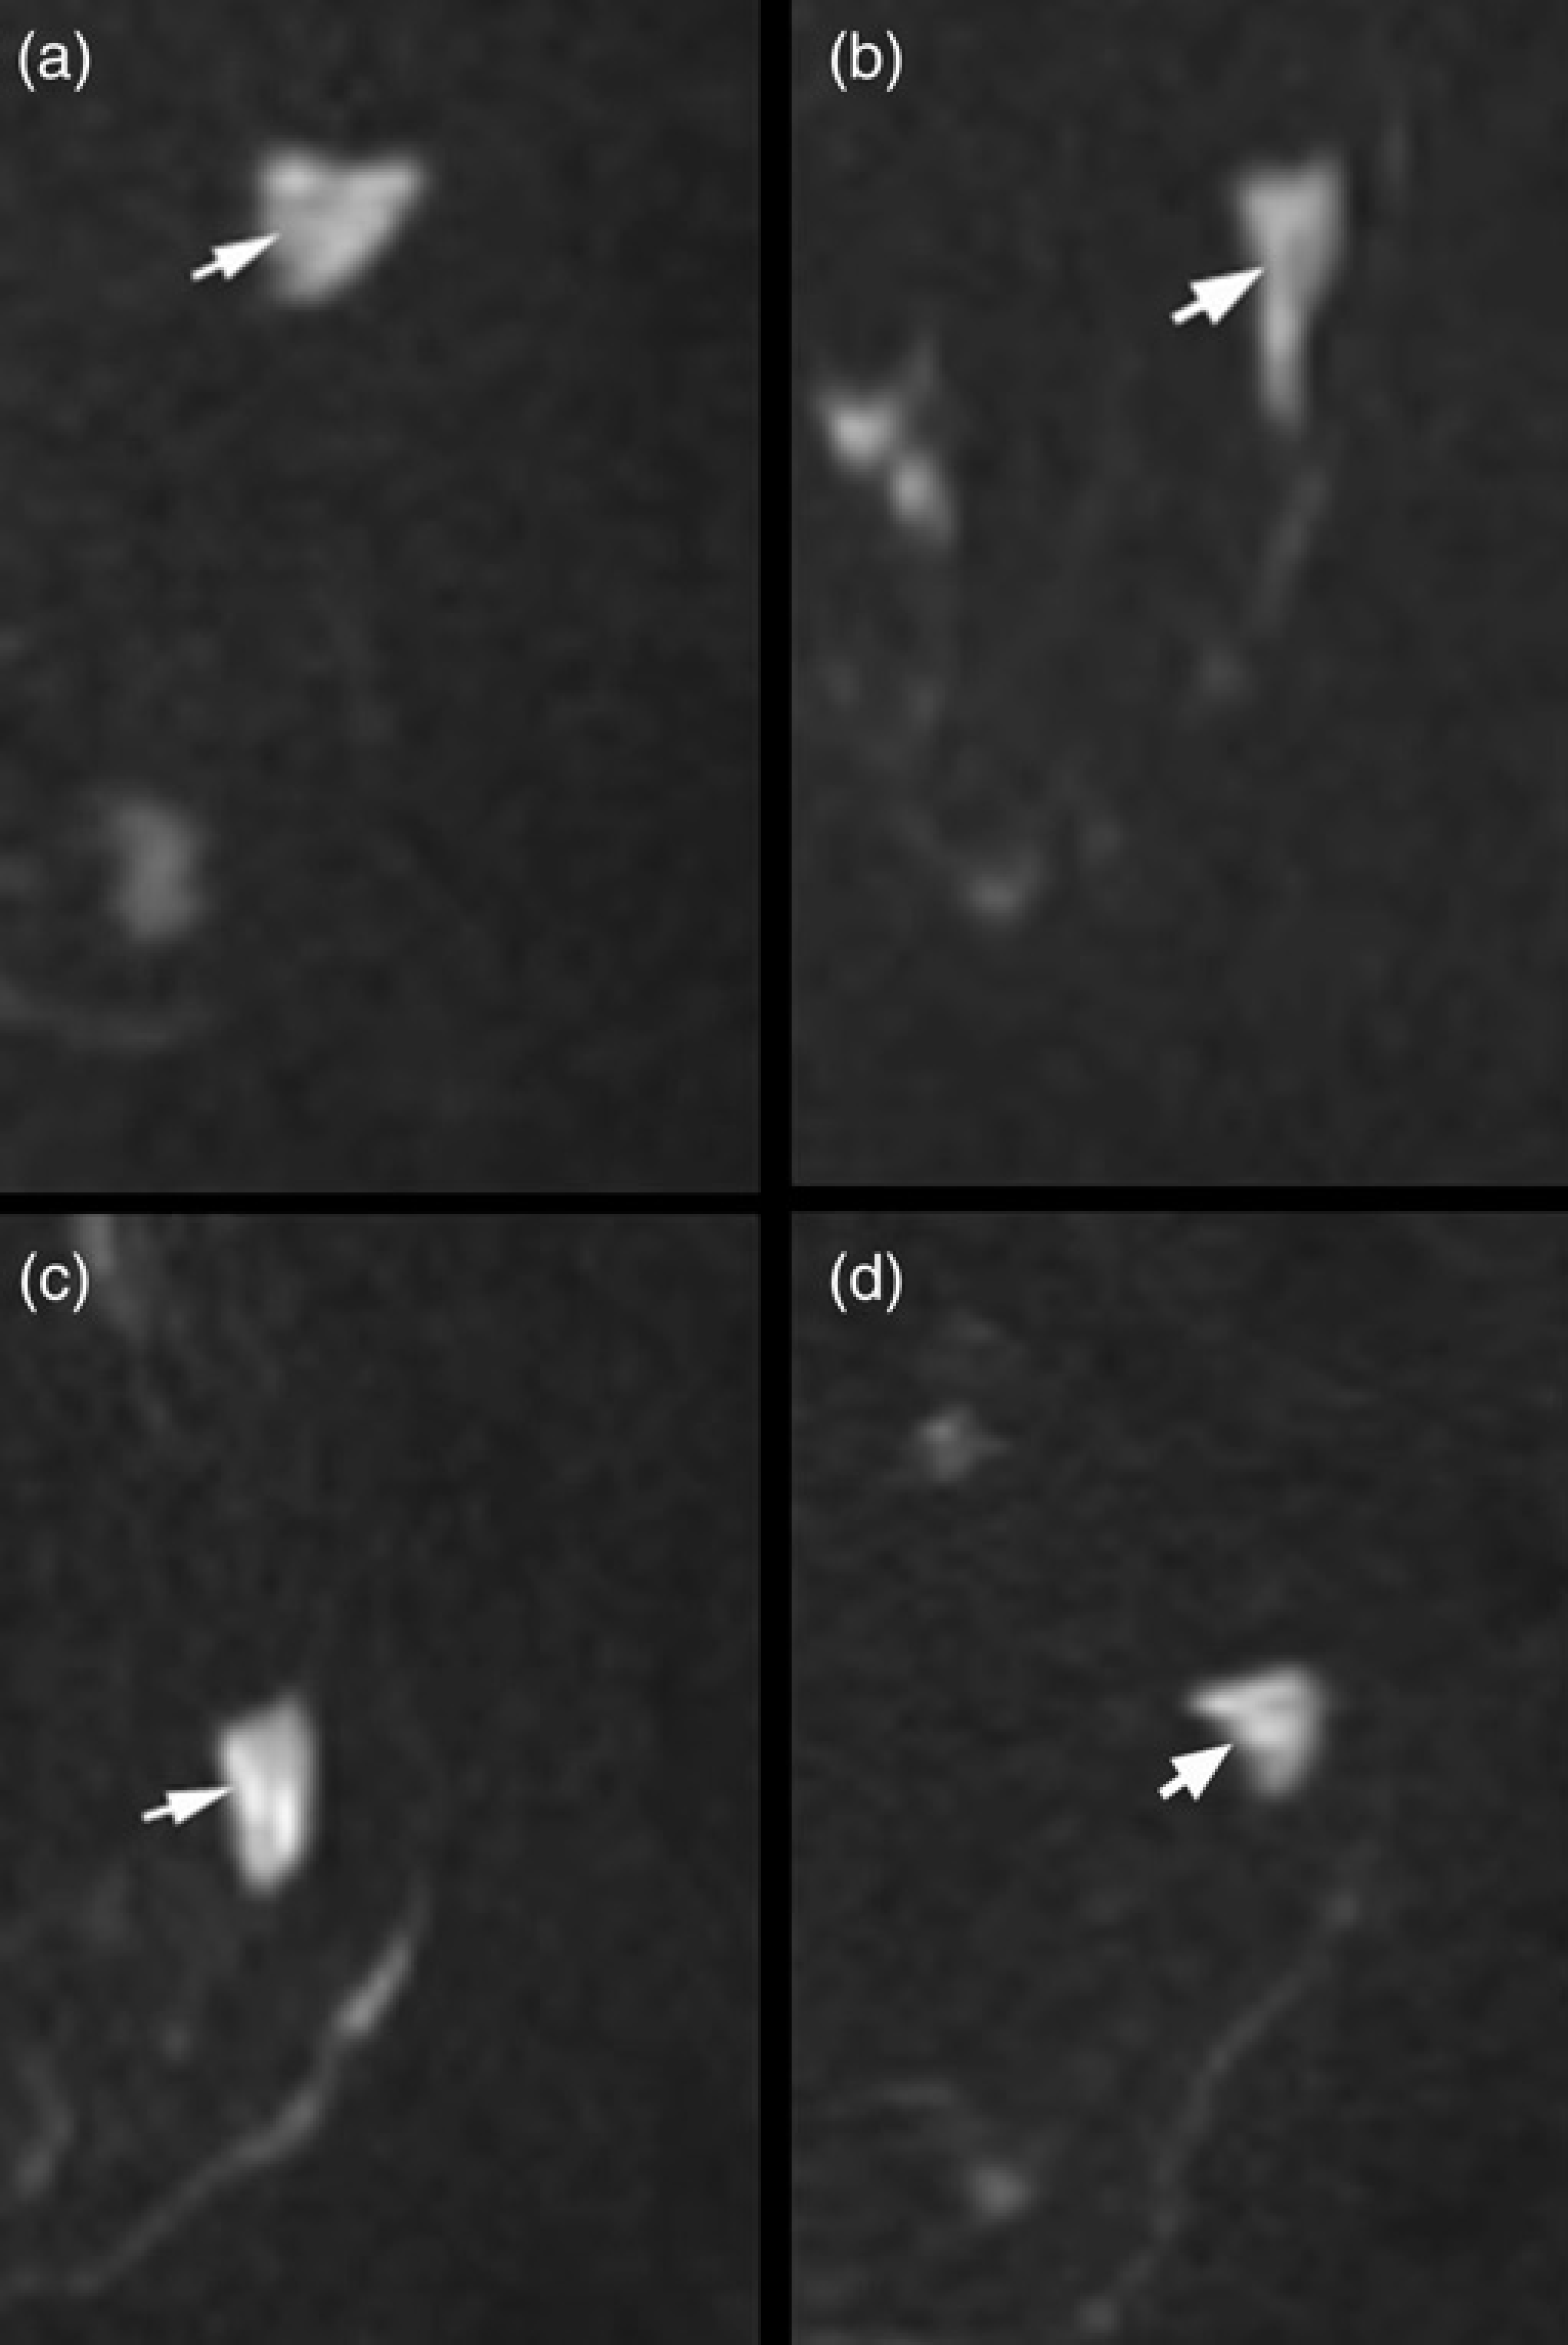
ADC value curves of metastatic and non-metastatic groups. Graph showed that ADC value of group A and C were significantly increased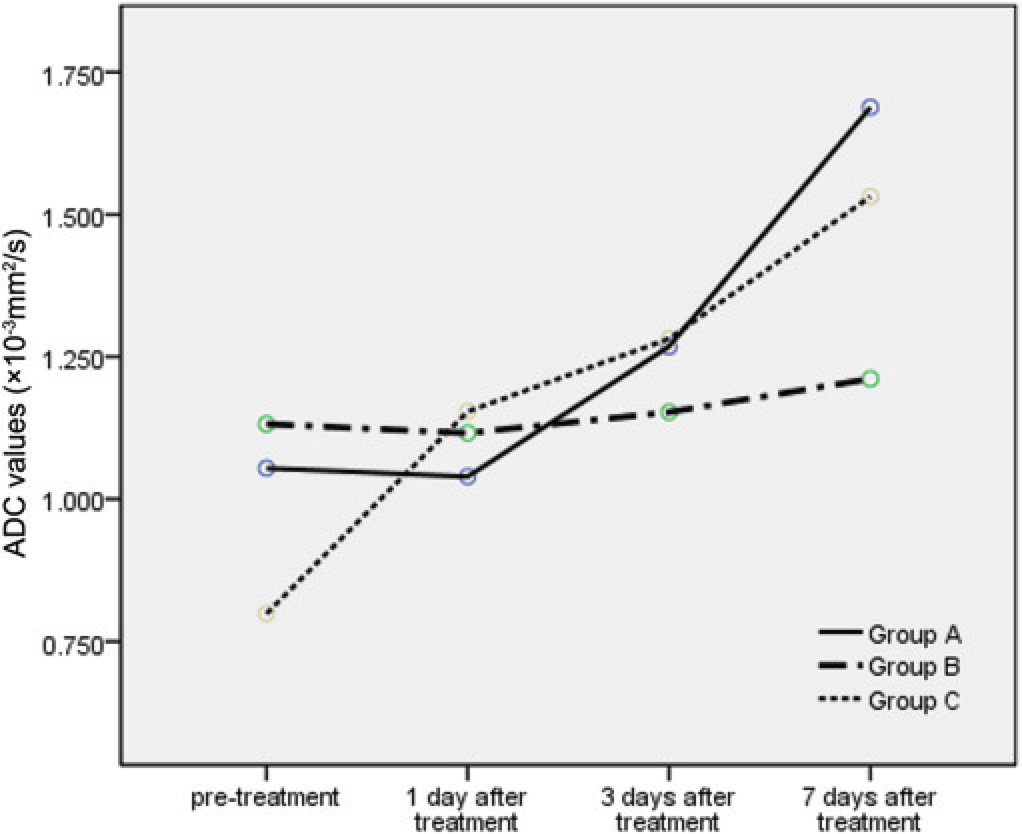
ADC values of lymph nodes at each time interval (×10-3 mm2/s)
Pathologic features
Photomicrographs of a metastatic lymph node 1, 3, and 7 days after irradiation were shown in Fig. 2. At 1 day after treatment, the number of viable tumor cells showed nuclear condensation and nuclear collapse, as well as cytoplasmic swelling and vacuolization. By 3 days after treatment, necrosis of tumor cells, residual contours of tumor cells and nuclear fragmentation were seen. By 7 days, more marked scattered necrosis in lymph nodes was seen.
In group C, 1 day after irradiation, lymphocytes were replaced eosinophils and macrophages. At days 3 and 7, the number of eosinophils decreased, while macrophages increased. In addition, edema of interstitium and dilation of lymphatic sinus were seen to the process (Fig. 4).
Photomicrographs of metastatic and non-metastatic lymph nodes at 1, 3, and 7 days after radiotherapy. In group A, 1 day after radiotherapy, swelling of cells appeared (×400) (a); 3 days after radiotherapy, necrosis of tumor cells were present. Residual contours of tumor cells can be seen (arrow head) (×200) (b); 7 days after radiotherapy, scattered areas of necrosis in lymph nodes were revealed (× 100) (c). In group C, 1 day after irradiation, a few macrophages with eosinophilic cytoplasm scattered in lymphocytes and dilation of lymphatic sinus was seen (× 100) (d); 3 days after radiotherapy, lymphocytes were replaced by clusters of macrophages (×100) (e) and 7 days after radiotherapy, the lymphatic interstitium loosened and wided (×100) (f)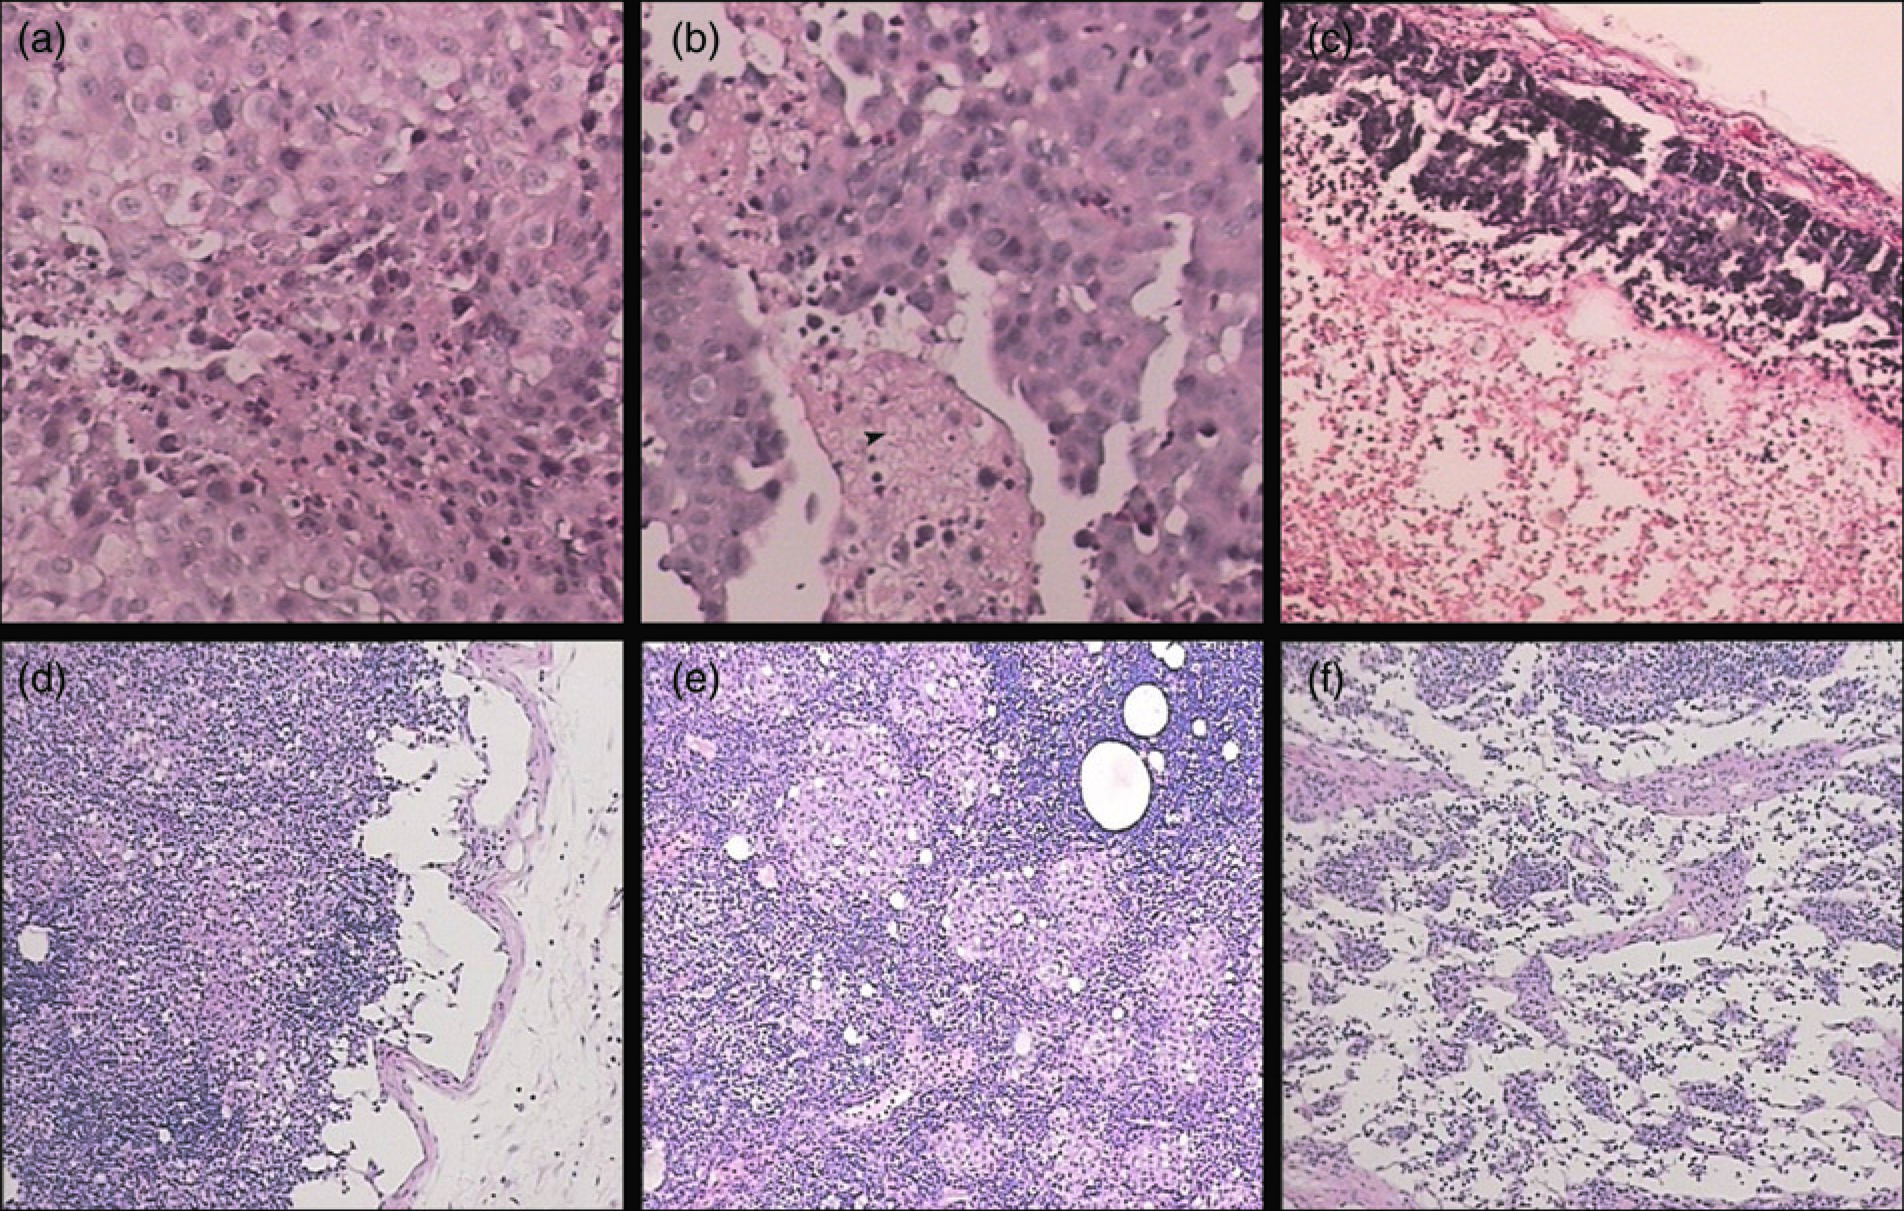
Discussion
Metastatic disease of lymph nodes significantly effects tumor development and represents an important prognostic factor. If size is used as a predictor of metastatic evolution, the short axis should be emphasized, as a lymph node frequently grows or shrinks along its short axis (3-5). According to Response Evaluation Criteria in Solid Tumors (RECIST), a lymph node can be included as a target lesion. However, measuring the longest diameter of lymph node metastasis in the axial plane according to RECIST involves the risk of neglecting the described pattern of response in lymph nodes (14). In this study, there was no statistically significant difference in nodal volumes between groups A and B. Li et al. (15) primarily evaluated the early response of VX2 tumors to irradiation with DWI. In his study, the volumes of VX2 tumors augmented in the process of radiation as a result of active tumor proliferation. Lymph nodes enlarge slower than primary tumors due to its special growth patterns. Tumor cells settle and proliferate in the subcapsular sinus, penetrate its endothelium and proliferate, and finally destroy the node. There are various forms of immune responses in the node, often including a complex fibrous and vascular response in human nodes (16).
Whether with CT or MRI, size analysis on morphology images may be inaccurate as an assessment tool, because a delay in morphologic changes in response to the completion of treatment may exist. Also, tumors may contain non-active tissues, such as fibrosis, necrosis, or injured cells. This produces a diagnostic dilemma in that the residual mass after treatment does not always equate with the residual disease. Furthermore, the early necrosis involves an admixture of the necrosis portion and viable neoplastic cell nests after 1 day or 3 days of irradiation. In a prior study, the area of early-phase necrosis showed low intensity due to low water content (17).
Signal properties on DWI reflect the microstructure and the physiologic state of tissues (18). In this study, 3 and 7 days after radiotherapy, ADC values of lymph nodes in group A increased significantly. By 3 days after irradiation, photomicrographs showed fragmentations of tumor cell nuclei, residual contours of tumor cells, and enlarged extracellular space. By day 7, areas of necrosis expanded and resulted in more extracellular space. These variances eventually resulted in the increase in ADC values (18).
A compact nucleus filling the entire cytoplasm is seen in a normal small lymphocyte with a high N/C (Nuclear/ Cytoplasm) ratio, which was one of the factors limiting the motion of water protons. Lymphocytes (white blood cells) and hematopoietic cells are constantly regenerating, and are, therefore, very sensitive to radiation. Intranodal cell populations, particularly lymphoid cells, are depleted immediately after irradiation but appear to repopulate within 24 hours from already circulating lymphocytes (19). In this study, numbers of macrophages within lymph nodes increased, replaced portions of the depleted lymphocytes. Two elements caused the increase in the number of macrophages: Freund's complete adjuvant stimulating cell-mediated immunity which increased numbers of macro-phages in regional lymph nodes (20) and relatively higher radio-resistant of macrophage (19). The cytoplasm of macro-phages is richer than that of lymphocytes. In addition, the interstitial edema seen both 3 and 7 days after irradiation, was manifested with loosening and widening of the interstitium. A relatively lower N/C ratio and more extracellular space resulted in the increase of ADC values (21).
Several limitations existed in our study. First, we induced two different kinds of lymph nodes, metastatic and non-metastatic nodes, both of which can be seen in patients with malignant tumors. Our results indicated ADC alteration in metastatic and non-metastatic lymph nodes occurred after radiotherapy due to different pathological features. In humans, pathological features of metastatic and reactive lymph nodes are more varied than our animal models. For example, reactive lymph nodes which contain fibrous connective tissue are more resistant to radiation. Our results only demonstrated ADC alterations in specific animal models. Second, the doses and schemes of radiation are closely related to body reactivity. In our study, a single dose of radiation was delivered. Relationships between the pathological alterations and the doses and schemes of irradiation warrant further study. Third, in this prospective study, we compared the capability of ADCs and morphological MRI in assessment of the early response of lymph nodes to radiotherapy in animal models. Long-term effects of ADCs were not assessed because of the short survival time of the animals injected with VX2 carcinoma suspension; more experiments are deserved for further clinical investigations.
In conclusion, the ADCs of metastatic nodes and non-metastatic nodes can reflect the general trend of water diffusibility as a result of pathological changes on cellular level after irradiation. However, the capability of diffusion-weighted imaging in differentiating various pathological changes is still limited. DWI is more sensitive than morphological MRI when used to follow lymph node changes in an animal model.
Footnotes
None