




Abstract
Background
Long-term physiological variations, such as seasonal variations, affect the screening efficiency at medical checkups. This study examined the seasonal variation in liver function tests using recently described data-mining methods.
Methods
The ‘latent reference values’ of aspartate aminotransferase (AST), alanine aminotransferase (ALT), alkaline phosphatase (ALP), gamma-glutamyltransferase (γGT), cholinesterase (ChE) and total bilirubin (T-Bil) were extracted from a seven-year database of outpatients (aged 20–79 yr; comprising approximately 1,270,000 test results). After calculating the monthly means for each variable, the time-series data were separated into trend and seasonal components using a local regression model (Loess method). Then, a cosine function model (cosinor method) was applied to the seasonal component to determine the periodicity and fluctuation range. A two-year outpatient database (215,000 results) from another hospital was also analysed to confirm the reproducibility of these methods.
Results
The serum levels of test results tended to increase in the winter. The increase in AST and ALT was about 6% in men and women, and was greater than that in ChE, ALP (in men and women) and γGT (in men). In contrast, T-Bil increased by 3.6% (men) and 5.0% (women) in the summer. The total protein and albumin concentrations did not change significantly. AST and ALT showed similar seasonal variation in both institutions in the comparative analysis.
Conclusions
The liver function tests were observed to show seasonal variations. These seasonal variations should therefore be taken into consideration when establishing either reference intervals or cut-off values, which are especially important regarding aminotransferases.
Introduction
Many plasma components show physiological variations over both the short and long term. 1 The evaluation of biological variations in biochemical tests is regarded as one of the important tasks for chemical laboratories. Although the magnitude of biological variations in various laboratory tests has been investigated, most studies have so far examined only short-term variations; usually within a few weeks. 2 The long-term management of patients requires consideration of long-term biological variations, such as seasonal variations. Moreover, long-term physiological variations are also important in epidemiological studies because they may affect the screening efficacy. For example, serum total cholesterol concentration increases significantly in the winter (1.8% in men and 2.5% in women). Despite this small change, the prevalence of hypercholesterolaemia (>6.2 mmol/L) is estimated to increase by 22%. 3 Among biochemical tests, liver function tests are essential not only for the patient follow-up, but also for medical checkups. However, there is presently little reliable information available regarding this issue.
Practical and technical problems need to be resolved to determine the seasonal variation accurately. It is necessary to measure a large number of samples repeatedly obtained from reference subjects. 4 It is also necessary to alter the assay methods to compensate for unexpected instability during the study period, especially in long-term studies. Two data-mining methods were applied in the current study to overcome these problems. Rather than recruiting reference subjects, a population with ‘latent reference intervals’ was extracted from routine laboratory data. 5 Patient records were selectively extracted, when other related tests showed no abnormal results. Ichihara and Matsuda 5 used such an extracted population to determine the reference intervals and to check for any bias in the laboratory data. The latent reference value extraction method is a useful data-mining tool that enables the analysis of sources of variations in laboratory test resulting from a large number of routine data. 6,7
To determine whether the liver function tests show seasonal variations, test results were extracted from a seven-year outpatient database using the latent reference value extraction method. Next, a locally weighted regression (Loess) method was adopted for the time-series data. 8,9 Seasonal variations were separated from long-term trend variations based on this time-series analysis. The extracted seasonal component was evaluated by fitting the curve to a cosine model.
Materials and methods
Data sampling
In general, blood was drawn into Insepack SQ® tubes (Sekisui Medical, Tokyo, Japan), a plastic tube containing coagulation-promoting agents. The serum was separated within an hour, and all variables were measured immediately with automated analysers (Hitachi 7350 and 7600; Hitachi High-Technologies, Tokyo, Japan).
This analysis used a seven-year database (2001–2006) of routine biochemical test results of adult outpatients (aged 20–79 yr) at Juntendo University Hospital, Tokyo, Japan. This database contains about 1,267,000 individual results (623,000 for men and 644,000 for women).
All personal identifiable information was deleted before any statistical analysis was conducted. The study protocol was in full accordance with the Declaration of Helsinki and the guidelines issued by the Ethical Committee of Japan Society of Clinical Laboratory Medicine.
First, all data were collected for 11 test results (aspartate aminotransferase [AST], alanine aminotransferase [ALT], alkaline phosphatase [ALP], gamma-glutamyltransferase [γGT], cholinesterase [ChE], total bilirubin [T-Bi]), total protein [TP], albumin [Alb], creatinine [Crea], glucose and C-reactive protein [CRP]) from the parent database. Then, eight test results were extracted from the latent reference subjects whose test results for five variables (AST, TP, Crea, glucose and CRP) were within the reference intervals. When the data were extracted for AST or TP, ALT or Alb was used as the reference variables. Seasonal variation was examined in eight of the 11 tests (AST, ALT, ALP, γGT, ChE, T-Bil, TP and Alb) as described below. The results of accuracy control sera covering reference intervals (Consera® N; Nissui, Tokyo, Japan) measured simultaneously with patient samples were also extracted to determine any technical variations. The assay methods in some laboratory tests changed during the study period. In those cases, the data measured by a new method were converted to those measured by the old method using a linear regression equation.
Data analysis
Extraction of seasonal variation
The monthly mean values of the extracted test results were calculated. All data that were not within the mean ± 2.6 standard deviations (SD) repeatedly (iterative truncation method 10 ) were excluded to avoid the effects of outliers. The monthly mean of the control sera was also calculated, and the statistical significance of the monthly variations of the means (from January through December) was evaluated using a one-way analysis of variance (ANOVA).
Thereafter, the Loess method was adopted for the time-series of the monthly means and they were separated into long-term trend variations, seasonal variations and residue (random) variations. Analyses were performed using the ‘tseries’ statistical software ‘R’ package (version 2.4.1; R Foundation for Statistical Computing, Vienna, Austria).
Fitting seasonal variation to function models
A cosine/sine function model (single cosinor method) was applied to the seasonal components to determine the periodicity and fluctuation range. 11 This periodic regression analysis approximates time-series values of a certain period (12 months in this study) by a cosine function using a least-squares method. The following parameters were generated using the Time Series Analysis Serial Cosinor software package (TSASC, version 6.3; Expert Soft Technologies, Esvres, France): midline-estimating statistic of rhythm (MESOR: rhythm-adjusted mean), amplitude (distance from MESOR to the peak of the fitted cosine curve) and acrophase (timing of the peak of the fitted cosine curve). The magnitude of seasonal variation was presented as the percent variation, defined as the peak/nadir difference divided by MESOR. The F-test was used for comparisons. A P value of <0.05 was considered to be statistically significant.
Validation of our methods using a second database
To validate the reproducibility of these methods, an additional analysis was conducted using a two-year database (2006−2007) from the Japanese Foundation for Cancer Research (JFCR) Hospital (Tokyo, Japan) consisting of 215,000 test results for outpatients.
Because the database period was not sufficiently long to determine trend variation, the monthly means and SD were simply calculated for each variable. This indicated whether these monthly means showed similar periodicity to the seasonal variation observed in the database of Juntendo University Hospital. The analysis was carried out only for AST and ALT.
Results
Determination of monthly means using the extracted laboratory test results
A total of 296,154 test results (119,684 in men and 176,470 in women) were extracted from the database by the latent reference individual extraction method. They represented 23.4% (19.2% in men and 27.4% in women) of the parent test results. The monthly mean and SD were obtained for each variable after iterative truncation. The mean ages of the extracted patients were similar among the variables. In addition, the monthly mean values were within the reference intervals for all variables (Table 1). Neither gender ratio nor mean age was statistically different in any of the variables over the 12-month study period (data not shown).
Final extracted data from the parent database
Data are presented as the mean (SD). The coefficient of variation (CV) was calculated from the mean and SD for the accuracy control serum (ACS) only
Abbreviations (assay method): AST, aspartate aminotransferase (IFCC/JSCC); ALT, alanine aminotransferase (IFCC/JSCC); ALP, alkaline phosphatase (JSCC); γGT, γ-glutamyltranspeptidase (JSCC); ChE, cholinesterase (enzymatic); T-Bil, total bilirubin (enzymatic); TP, total protein (Biuret); Alb, albumin (BCG/modified BCP). IFCC, International Federation of Clinical Chemistry; JSCC, Japanese Society of Clinical Chemistry
Circannual variation
One-way ANOVA revealed that all liver function tests except γGT exhibited significant periodicity. AST, ALT and ChE showed significant circannual variation in both men and women (P < 0.05), while T-Bil and Alb showed a significant circannual variation only in men, and ALP only in women (Figure 1). The test results of the accuracy control samples, however, showed no significant periodicity in any variable.
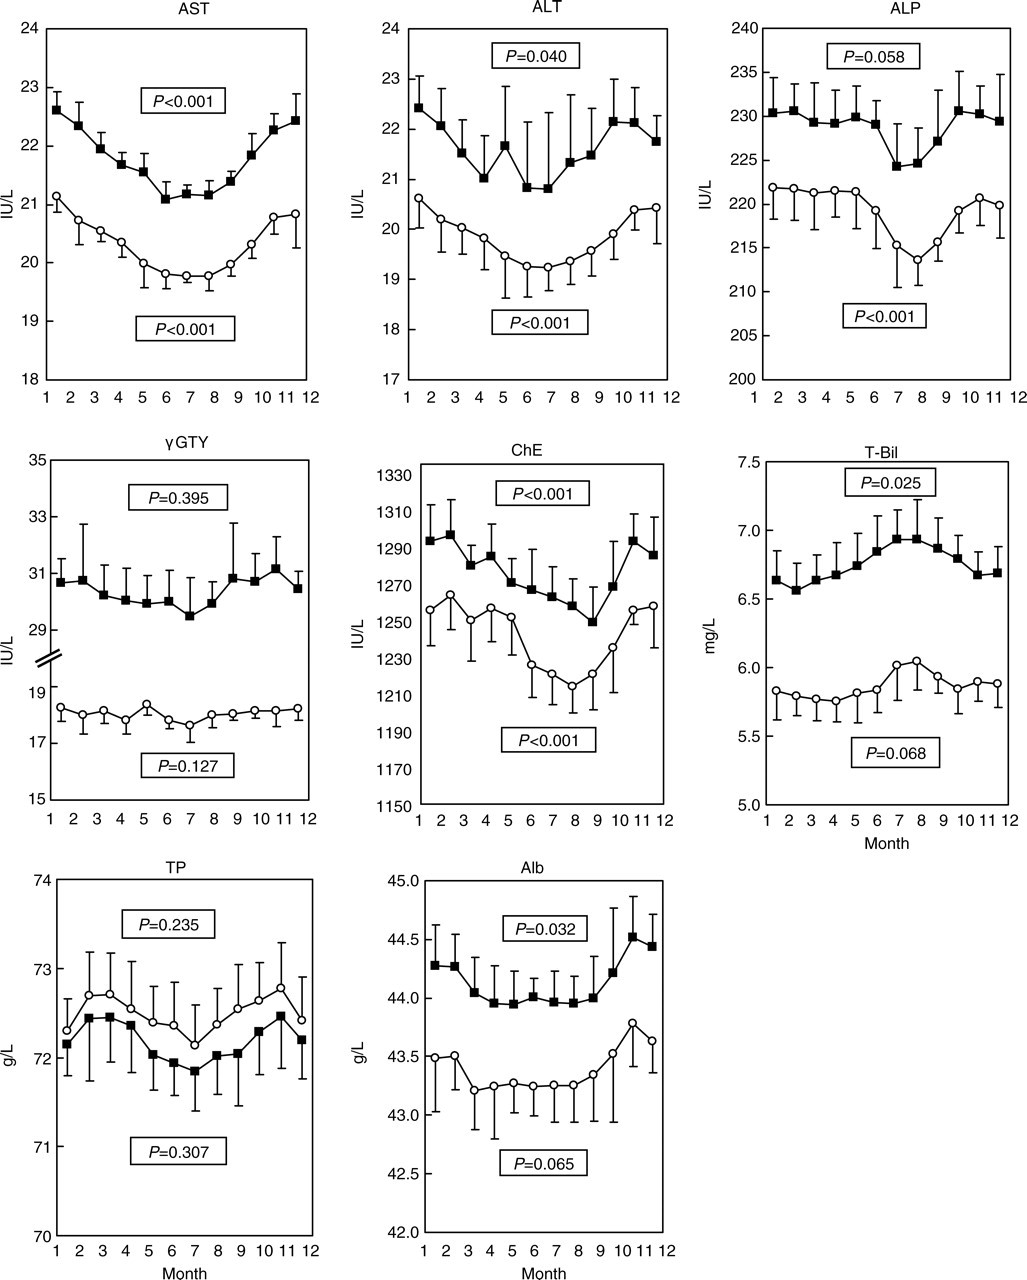
Monthly means ± standard deviations for each variable over a seven-year period (2000–2006) for women (open circles) and men (closed squares). P values: significance of annual variation, estimated using one-way ANOVA. AST, aspartate aminotransferase; ALT, alanine aminotransferase; ALP, alkaline phosphatase; γGT, γ-glutamyltranspeptidase; ChE, cholinesterase; T-Bil, total bilirubin; TP, total protein; Alb, albumin
Separation of seasonal variation from trend variation, and subsequent curve fitting to a cosine/sine model
The time-series data of the monthly mean for all eight laboratory tests were separated into seasonal and trend variations using the ‘Loess’ method (Figure 2, panel A). The trend variation in AST was only 20–30% of the seasonal variation. The trend variations in the other laboratory tests, however, were much greater, corresponding to between 60% and 254% (ALP in men) of the seasonal variation (Table 2). Trend variations in ALT and ChE (men and women) as well as γGT (men) exceeded the intra-assay coefficient of variations of the accuracy control sera (Tables 1 and 2). The trend variations in ALP and TP were greater than their seasonal variation.

Trend decomposition and cosine/sine model fitting for AST and ALT levels in women. Panel A, raw data (monthly means, solid lines) and trends (dotted lines) estimated using a Loess method; Panel B, the trend variation was subtracted from the raw data. The calculated data (solid lines) were fitted to a cosine/sine function (dotted lines) using a single cosinor method. AST, aspartate aminotransferase; ALT, alanine aminotransferase
Interquartile ranges of the variations estimated by the ‘Loess’ time-series analysis
*The percentage of the total variation is given in parentheses. The covariance of each components was not 0. Therefore, the total variation exceeded 100%
After removing any trend variation, a cosine/sine model was fitted to the seasonal variation using the single cosinor method (Figure 2, panel B). The models could be established in all the variables except γGT and TP in women. In these models, the acrophases (peak dates) of the liver enzymes were found in the winter (between December and early March), while for T-Bil, the acrophase was in the late summer (between August and September). According to the percent variation, AST and ALT had the largest seasonal variation in men and women, respectively (Table 3).
Seasonal variation and rhythm parameters of the analyses
MESOR, midline-estimating statistic of rhythm (rhythm-adjusted mean); 95% CI, 95% confidence interval
% variation, peak/nadir difference (2 × amplitude) divided by MESOR
*P < 0.001
Reproducibility of the method for separating seasonal variation
A comparative analysis using the database from JFCR Hospital revealed the monthly means of AST and ALT to show apparent periodicity with a peak in the winter and a nadir in the summer (Figure 3). The fluctuation in the monthly means for both tests was in good agreement with the graphs drawn using the function models obtained from the database of Juntendo University Hospital.

Comparison of the observed (JFCR Hospital) and estimated (Juntendo) seasonal variation in AST and ALT. Solid line: the observed monthly means ± standard deviations for AST and ALT using the database from JFCR Hospital for women (open circles) and men (closed squares). Dotted line: estimated seasonal variation obtained from the Juntendo Hospital database. The cosine/sine functions were determined as described in the materials and methods. The chronological MESOR was adjusted to the overall means of the JFCR data. AST, aspartate aminotransferase; ALT, alanine aminotransferase; MESOR, midline-estimating statistic of rhythm; JFCR, Japanese Foundation for Cancer Research
Discussion
This study demonstrated that liver function tests show seasonal variations. Most liver function tests increased significantly in the winter, while T-Bil increased in the summer. In particular, the percent variation was greater in AST and ALT in comparison to the other variables. Both were highest in January and lowest in July. The percent variations ranged from 5.8% to 6.5%.
The seasonal variation in AST and ALT likely reflects physiological variations because the extracted data showed the characteristic features of the reference intervals (Table 1). Therefore, the extracted subjects can be considered to be healthy individuals. Second, the test results for the accuracy control samples showed no significant seasonal trends for any variable. Moreover, the gender ratios and mean ages showed no statistical difference throughout the year for any variable. These results strongly suggest that the observed seasonal variation did not result from technical variations or seasonal shifts in the patient population. Third, similar seasonal variations were detected in AST and ALT using another large database. The analysis using the database of JFCR Hospital demonstrated that the variations in the monthly means were consistent with the graphs drawn by the function models obtained from the initial database (Figure 3).
There are other reports on seasonal variation in AST and ALT in humans. The AST levels in 2600 women in their third decade showed a peak in April to June and a nadir in October to December, with a fluctuation range of 11.7%, whereas the ALT levels showed a peak in January to March and a nadir in April to September, with a range of 5%. 12 This previously reported pattern of ALT variation is consistent with the results described herein, whereas that of AST does not. The AST levels showed no seasonal variation in male workers undergoing health checkups whereas the ALT levels showed a peak in April to June and a nadir in October to December, with 13% variation. 13 Neither AST nor ALT show any significant seasonal variation in young adults and elderly persons. 14 However, these studies measured only the AST and ALT three or four times a year. In addition, they did not adopt any computer-based methods. Therefore, the discrepancies among these studies may have resulted from some inaccuracy or low sensitivity of the methods used.
There are two possible mechanisms for the observed seasonal variations in AST and ALT. One explanation is the haemoconcentration and haemodilution of intravascular substances caused by seasonal changes in vascular tone. The vascular tone in the summer is reduced due to high temperature or increased physical activity. Conversely, the vascular tone increases in the winter due to low temperature or lower physical activity. Vascular tone is an important determinant of intravascular volume, and such changes are associated with secondary fluctuations in many intravascular molecules. Likewise, serum cholesterol shows seasonal variations, 15 and its fluctuation is similar to that observed for AST and ALT in this study. Note, however, that the percent seasonal variation in ALT and AST was 5- to 10-fold greater than that for other intravascular proteins, such as TP and Alb (Table 3).
Another possible explanation is that the AST and ALT levels increase due to climatic stress or hormonal change in the winter. Seasonal variation in AST and ALT is reported in humans, and other mammals, 16–18 reptiles 19 and fish. 20 The AST and ALT levels in Ethiopian goats have been reported to be significantly higher in the long-rainy season, after the long-rainy season and in the dry season than in the short-rainy season. 17 In Shiba goats (Tokyo), ALT is significantly higher in the autumn and winter than in the summer. 18 In catfish, ALT is higher in the winter than in the summer. These findings support the hypothesis that climatic stress varies among the seasons, and that high stress increases AST and ALT levels. Alcohol intake in humans generally increases in the winter, which may also contribute to seasonal variations in AST and ALT. 21 Future studies are required to clarify the precise mechanisms underlying these observations.
Other variables also showed seasonal variation in the current study, although the magnitude was much smaller than that of the changes observed for AST and ALT. Closely similar to AST and ALT, the ALP levels are also higher in the winter than in the summer. Woitge et al. 22 reported patterns similar to those observed in this study. They suggested that bone turnover is reduced in the summer. If so, the activity of the bone-specific ALP isozyme likely decreases, resulting in low total ALP activity in the summer. However, many studies have failed to detect any seasonal variations in ALP 12–14
No seasonal variation was identified in γGT. Likewise, Nicolau and Haus 14 found no significant seasonal variation in γGT in either young adults or elderly persons. In male workers undergoing medical checkups, however, the γGT levels show a peak in March to May and a nadir in August to December, with a fluctuation range of 29%. 13 This seasonal variation may be caused by business-related alcohol consumption.
Ando et al. 23 reported the ChE levels to become elevated in women in the winter, but they did not change significantly in men. In the elderly, T-Bil increases in the summer only in men, which is quite consistent with the findings of the current study. 24 The TP and Alb levels show inconsistent results, including no seasonal change 12,13 and a reduction in the spring and elevation in the summer has only been observed in women. 14,24
In addition to the drawbacks of the methods used in previous studies, inconsistencies in seasonal variation may be further attributable to various confounding factors. First, seasonal variation is generally small relative to the reference intervals of healthy subjects. Second, study populations have great diversity in terms of gender, age, race, sample size, and other parameters, including lifestyle. Furthermore, differences may exist in the conditions of blood drawing and sample storage, plus technical factors, such as room temperature at measurement, the types of automated analysers used, the quality of the measuring reagents and so on. The current study was able to identify relatively small seasonal variations, probably because it employed a seven-year database consisting of more than 1,200,000 test results, and removed any technical errors due to trend variations from seasonal variation by a time-series analysis. Therefore, the evaluation of seasonal variations in liver function tests requires sophisticated data-mining methods.
Factors related to technical imprecision and trend variations were greater than the seasonal variation in most variables (Table 1). Technical imprecision and trend variations are two major factors that produce technical errors. Therefore, technical errors likely mask seasonal variations or distort their patterns. This trend variation needs to be monitored or, if possible, eliminated from the measured values by means of future advances in laboratory technology.
In conclusion, liver function tests show seasonal variations. Such seasonal variations should therefore be taken into consideration when defining the reference intervals or cut-off values, which are especially important for AST and ALT.