




Abstract
The aim of this review is to examine the recent literature on using advanced magnetic resonance imaging (MRI) techniques for finding neuroimaging biomarkers that are sensitive to the detection of risks for Alzheimer's disease (AD). Since structural MRI techniques, such as brain structural volumetry and voxel-based morphometry (VBM), have been widely used for AD studies and extensively reviewed, we will only briefly touch on the topics of volumetry and morphometry. The focus of the current review is about the more recent developments in the search for AD neuroimaging biomarkers with functional MRI (fMRI), resting-state functional connectivity MRI (fcMRI), diffusion tensor imaging (DTI), arterial spin-labeling (ASL), and magnetic resonance spectroscopy (MRS).
Keywords
Alzheimer's disease (AD) accounts for about 60% of all cases of dementia and is a progressive neurodegenerative disorder characterized by gradual deterioration in cognition, function, and behavior (1). More than 30 million are affected worldwide. Age is an important risk factor with AD. It occurs in nearly 8% of individuals over 65 years and 30% over age 85 years in developed countries. The progression of AD is gradual with the average patient living 8–10 years after symptom onset.
AD is pathologically characterized by the appearance of amyloid plaques and neurofibrillary tangles and by the loss of large cortical neurons in the hippocampus, entorhinal cortex, and association areas of the neocortex (2). A definitive diagnosis of AD can not be made during life; instead, patients are provided a provisional diagnosis of possible or probable AD based on clinical, laboratory, and neuroimaging evidence using the NINCDS-ADRDA or DSM-IV criteria (3).
There is increasing evidence showing that the pathological process associated with AD may begin decades prior to diagnosis (4). The preclinical stage of AD may be divided into two periods: a ‘latent’ phase, with no observable symptoms, and a ‘prodromal’ phase, characterized by mild symptoms that do not meet diagnostic criteria for probable or possible AD.
Early detection of AD risk would enable preventive and more effective treatment of the patients, resulting in a time delay in the symptom onset that can significantly decrease the prevalence of the disease (5). In addition to the neuroimaging biomarkers for early identification of AD that will be discussed in detail in this review, there are also clinical and genetic biomarkers which will be briefly summarized below.
Clinical biomarkers
The prodromal phase of AD is characterized by progressive isolated memory deficits, a condition that has been termed as mild cognitive impairment (MCI). The precise definition of MCI is somewhat controversial. MCI refers to those subjects who show objective memory impairment beyond what is felt to constitute normal aging but do not fulfill the diagnostic criteria for dementia. The accelerated rate of progression from MCI to AD and dementia has been well-documented in multiple studies. About 40% of MCI subjects progress to clinically diagnosed AD over a 4-year period. Approximately 60% of MCI patients have autopsy-verified AD (5). The clinical assessment of possible/probable AD is based on the patient history and medical examination including assessment of cognitive functions. Because these clinical measures are highly dependent on age and education, there remain questions as to whether these measures can accurately discriminate the early AD-related neuropathology from the normal aging effects on cognitive capacity.
Genetic biomarkers
The most useful genetic marker that can improve the prediction of AD is the apolipoprotein (APOE) ε4 allele on chromosome 19. The APOE ε4 allele confers a genetic susceptibility but is not autosomal dominant. The presence of ε4 allele is associated with a well-established risk factor for increased incidence of AD and decreased onset age (6). However, the APOE ε4 genotype is not a reliable predictor of prognosis in asymptomatic subjects due to the high false-positive and false-negative rates (7). AD can develop in the absence of the ε4 allele, and the ε4 allele carriers can avoid the disease (>60%).
Neuroimaging biomarkers based on volumetry and morphometry MRI
Due to the uncertainties associated with the clinical diagnosis and genetic biomarkers discussed above, neuroimaging is increasingly playing a more important role in the study and clinical diagnosis of AD (8, 9). A variety of novel neuroimaging modalities have been adopted for the scientific investigation of pathophysiological processes underlying the development of AD and for identifying specific diagnostic patterns in individuals who may be at risk of AD. These include structural CT, MRI, and different functional neuroimaging techniques. In particular, MRI measurements of structural volume and voxel-based morphormetry (VBM) have been extensively used for AD studies during the past 15 years (9). Early changes have been demonstrated in the hippocampus and entorhinal cortex (10, 11). Multiple changes in the brain anatomical features beyond those associated with normal aging, including enlarged ventricles, decreased cortical thickness, and axonal loss in white matter, are also found in both young and old AD patients across the spectrum of the disease severity (8, 9). As confirmed by longitudinal studies (12, 13), the hippocampus and entorhinal cortex have been identified to suffer from the most severe atrophy (up to 40%), consistent with the memory deficits experienced by all AD patients. The MRI images shown in Fig. 1 also clearly illustrate the volumetric deficit of the hippocampus in an AD patient versus a normal control.
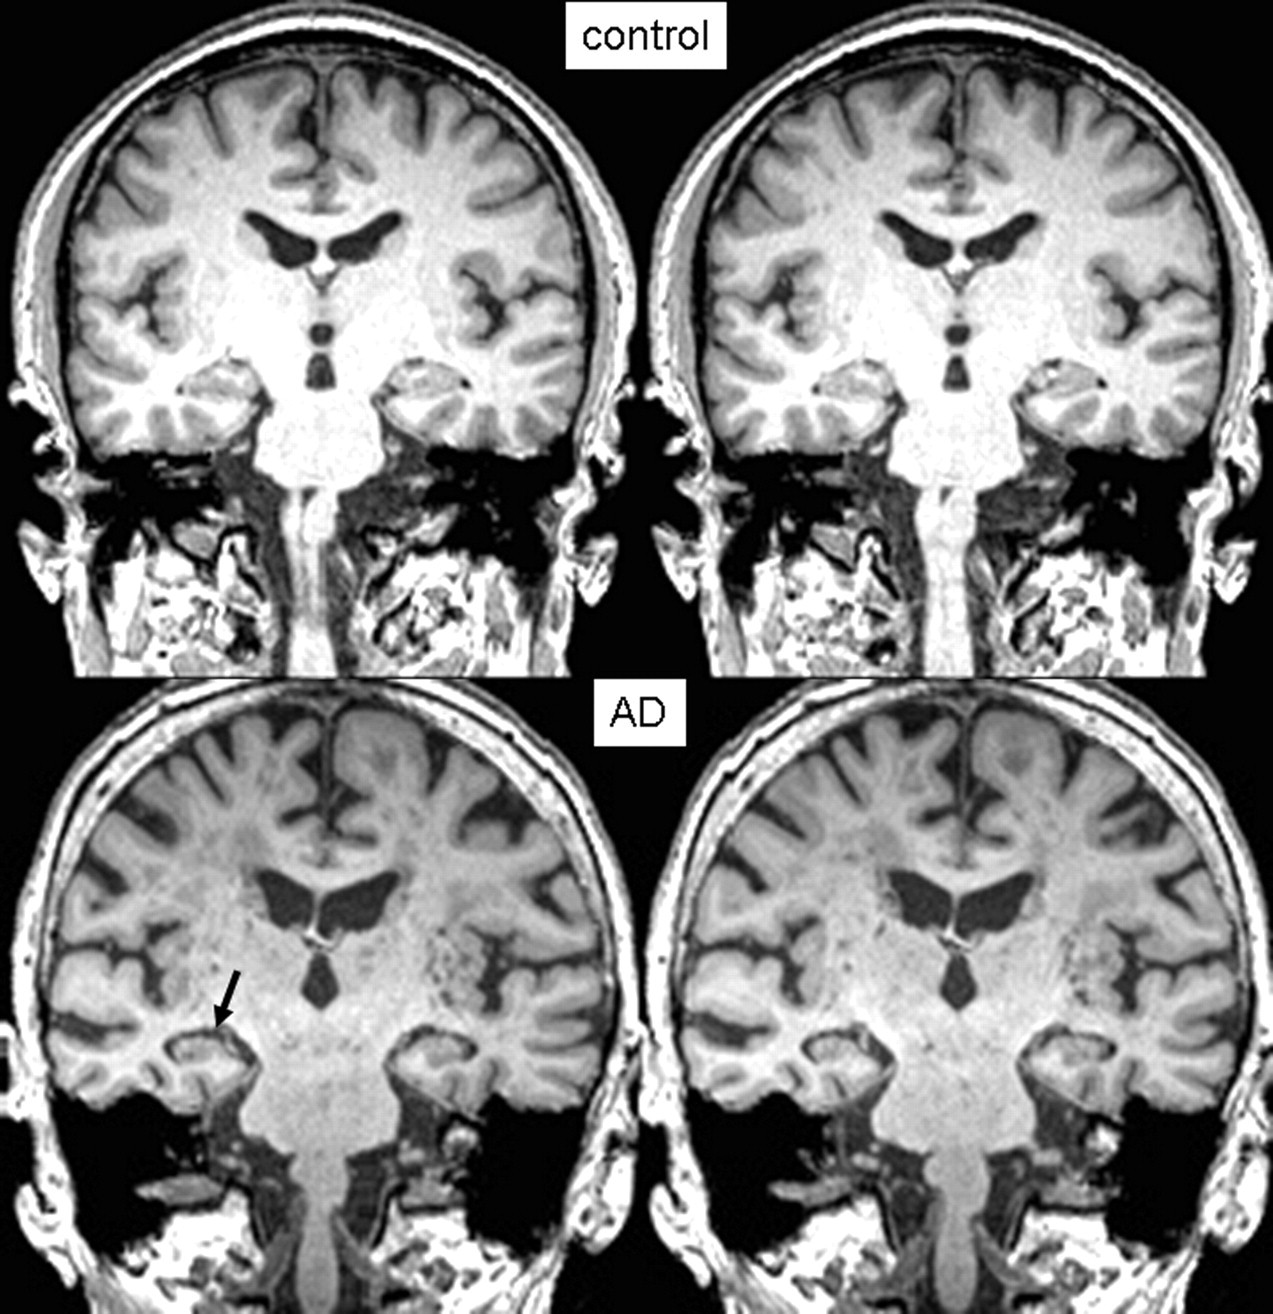
Coronal T1-weighted MR images showing volumetric difference in the hippocampus between (top) a normal control and (bottom) an AD patient
The validity of hippocampal volume as a diagnostic biomarker is also supported by its strong correlations with pathoanatomical and functional measures. Several groups have reported that there is a high correlation between the hippocampal volumes from MRI studies and the histological estimates. Multiple studies (9) have also demonstrated that there are significant correlations between the structural measurements and a wide variety of cognitive measures. It is true that there is substantial variability in the volume reduction measured by MRI even among patients with a similar degree of cognitive impairment. This is hardly surprising, considering the different scanners, acquisition protocols, post-processing procedures, and the severity of the impairment. With the development of high field MRI techniques, 3T clinical MRI scanners have become widely available in the last few years and the hippocampal anatomy can be examined at higher spatial resolution afforded by the improved tissue contrast and signal-to-noise ratio (SNR) efficiency. The uncertainty in the manually defined boundaries of the hippocampal formation can be significantly reduced. This point is clearly demonstrated by the high resolution in vivo and ex vivo MRI images of the human hippocampus acquired at 7T, as depicted in Fig. 2. Worldwide, there are about 50 human MRI scanners at 7T and above under operation. A couple of 7T initiatives are currently under way in the Nordic countries. Preliminary results in the last few years have demonstrated that high field MRI is a very promising technology to improve in vivo brain studies (14–19).
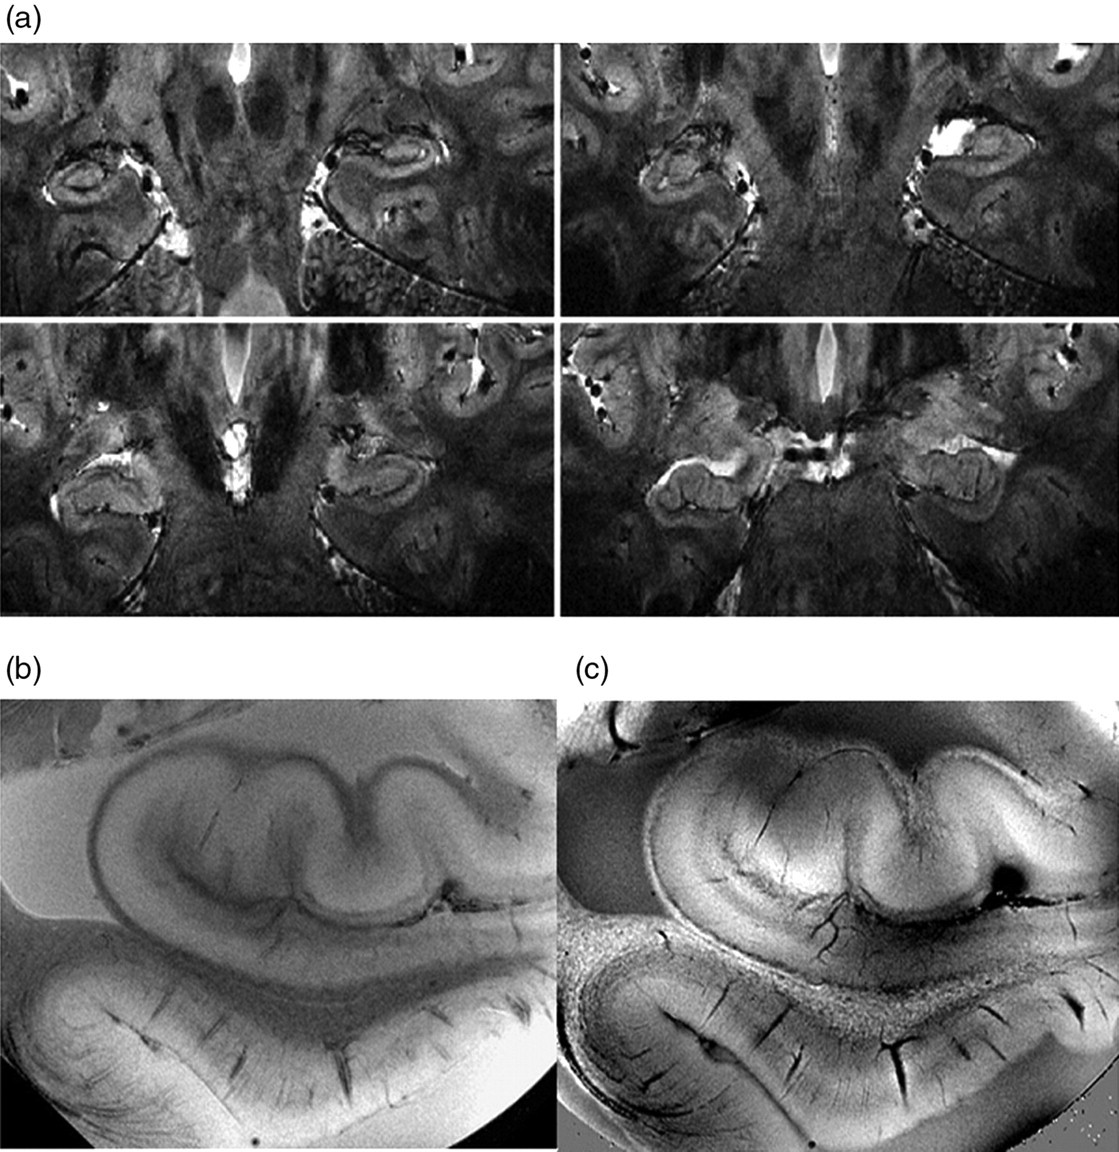
(a) In vivo high-resolution (0.2 × 0.2 × 1.0 mm3) MR images of the human hippocampus acquired at 7T using susceptibility-weighted contrast, (b) magnitude image of the postmortem hippocampus at 50 µm, (c) the corresponding phase image of the postmortem hippocampus at 50 µm. The images were acquired by the author, when working at the Laboratory of Functional and Molecular Imaging, National Institute of Health, and were orally presented at the Annual Meeting of the International Society of Magnetic Resonance in Medicine in 2008 (106)
It should be noted that the measures of brain atrophy typically reflect the relatively late stages of neuronal loss and may not be ideal for identifying early neuropathological changes. Therefore, in addition to the structural MRI procedures, which have already been widely implemented in routine clinical practice, a spectrum of novel MRI tools is being adopted for the scientific study of pathophysiological processes underlying the development of AD, including functional MRI studies of brain activation and functional connectivity, perfusion measurements with arterial spin-labeling (ASL), and assessment of brain metabolism with magnetic resonance spectroscopy (MRS).
fMRI biomarkers for AD
Functional MRI based on blood oxygenation level dependent (BOLD) contrast measures the hemodynamic response to neural activity. The BOLD effects are usually measured using rapid volumetric acquisition of images with T2*-weighted contrast. With multi-channel detector based snap-shot imaging techniques, such as echo-planar imaging and spiral acquisition, whole-brain images can be acquired at a couple of millimeter resolution with moderately good temporal speed of 2–4 seconds. Since early 1990s, fMRI has been widely used for mapping human brain responses to various sensory, motor, and cognitive stimuli.
Findings from fMRI memory studies suggest that middle temporal lobe (MTL) regions are more reliably activated during encoding, frontal areas tend to be activated during retrieval processes (20, 21), and cognition is associated with activation of the medial parietal lobe including posterior cingulate cortex (PCC) and precuneus. Novel picture encoding was found to be a reliable task that consistently involves the hippocampal function and is particularly relevant to the memory deficits that occur in AD (22–24). Therefore, fMRI activation of at-risk adults during picture encoding was considered to be an appropriate methodology for examining the initial changes in brain function that occur in preclinical AD.
In the last decade, fMRI studies with different cognitive tasks have deepened the understanding of underlying pathology leading to AD and how the brain functions were altered to potentially compensate for the damages caused by the disease. fMRI has also showed potential for becoming a possible tool for early detection of AD risks. Several groups have recently applied fMRI to subjects in the latent phase to identify the earliest signs of neurodegeneration – prior to any symptoms characteristic of MCI or AD (25–27). Evidence to date indicates that functional decline preceds the occurrence of structural atrophy in preclinical samples with first degree family history and APOE risk factor (25–27).
There have been multiple studies to characterize functional activation in the hippocampus for individuals at risk for AD (25–27). Greater BOLD signal intensity and larger activation volume have been observed in fMRI studies of episodic encoding of non-demented adults with the ε4 allele (25). There is a general increase of brain activation in non-hippocampal regions but lack of activations in MTL. The observation was interpreted as the following: the memory task became more challenging to the at-risk subjects, therefore, it resulted in an increase of the overall activation in the brain. The increased activation in other brain regions was the direct result of the lack of activation in the hippocampus to compensate for its functional deficit. Such observation and interpretation are consistent with the neuro-psychological finding that deficit in episodic recollection memory is among the earliest and most prominent symptoms of AD (28).
The results of some of the BOLD fMRI studies are probably obscured by the neuropsychological performance of the subjects. The ε4 carriers performed more poorly than the non-ε4 group on some tests of episodic memory. Thus, it is unclear whether the results are related to APOE genotype, poor general memory performance, or some interaction between these two variables. Additionally, there are also some concerns regarding whether the fMRI results were due to the differential patterns of brain atrophy between the ε4 and non-ε4 cohorts. Segmentation of whole-brain gray matter, white matter, and cerebral spinal fluid (CSF) compartments and volumetric estimation of MTL gray matter would explain whether the BOLD fMRI results were influenced by the differences in brain atrophy across the genotype groups. Nonetheless, the findings from these earlier studies (25, 29) were further confirmed by the later studies (22, 24, 26, 30) that reported also increased brain activation in the young (27) and middle-aged individuals at risk for developing AD.
fMRI based on BOLD contrast allows non-invasive in vivo assessment of hemodynamic responses to external stimuli. fMRI is a promising approach with much strengths for studying individuals at risk of AD. It can be used to measure brain activation of cognitive processes that are typically difficult to isolate with behavioral assessment, such as encoding and retrieval. Despite the strengths of fMRI, studies using this technique to examine at-risk individuals have yielded some inconsistent findings. Some studies have reported increased BOLD response and activation volume in people at risk for AD as compared to normal controls suggesting compensatory mechanisms (25, 31); while others (26, 32–38) have shown decreases indicating neuronal deficits related to AD pathology. First of all, it should be noted that both the frontal and hippocampal activations are very delicate and difficult to detect in a robust manner, because BOLD fMRI results in these brain regions are quite susceptible to magnetic susceptibility related artifacts. In addition to the apparent differences in subject populations, the types of cognitive paradigms could contribute to the observed discrepancies. The variability in accuracy of fMRI task performance may also significantly influence the BOLD signal response. The variability in fMRI task performance may confound the variance that is attributable to the AD risk factors (26, 27). In order to use fMRI measurement for diagnosis and classification of AD status, it is, therefore, necessary to develop strategies that can disentangle the effect of AD risk factors from those of experimental reproducibility, neuropsychological performance, differential brain anatomy, and normal aging physiology.
Resting-state functional connectivity biomarkers for AD
Although the spontaneous low-frequency fluctuations in the brain physiological activity has been known for more than five decades, the mapping of the functionally-related network in the brain based on the temporal synchrony of spontaneous fluctuations was not started until 1995, when Biswall et al. (39) discovered the temporal synchrony in the spontaneous low-frequency fluctuations in resting-state BOLD MRI signals and used it as a measure of functional connectivity between distant brain regions. This approach, referred to as functional connectivity MRI (fcMRI), exploits the similarity between low frequency fluctuations in signal intensity in spatially separated brain regions (40). Although the precise physiologic mechanism measured with fcMRI remains obscure, fcMRI has received enormous attention in functional brain mapping. A rising number of studies tried to explore this approach to gain insights into the ‘restlessness’ mind at rest. fcMRI has been successfully used to map various brain networks between spatially remote brain areas that are functionally relevant, consisting of regions known to be involved in motor function, visual processing, executive function, auditory processing, memory, attention, and the so-called default-mode network. In the last few years, there has also been a rapidly growing interest in using the resting-state fcMRI for clinical studies of AD (41–46), because functional connectivity may be altered by neurological diseases and connectivity mapping may be a powerful measure of cognitive states and sensitive to differences between controls and patients (40).
Deactivation and default mode
The concept of deactivation can be divided into task-independent and task-specific. Certain brain regions show a decreased BOLD activity during a variety of attention-demanding tasks in comparison to the resting-state baseline (47). These task-independent signal decreases cover regions such as the medial parietal cortex, superior and inferior medial frontal regions and posterior lateral parieto-occipital cortices (48). The baseline activity of this brain network has been defined by Raichle et al. (47) as an organized default mode of brain function that is suspended during task- or goal-directed brain activity. It appears that with the increasing workload in cognitive tasks, resources are redirected from the default mode network to task-specific cortical regions, resulting in decreased activity of the default mode network. Activity within the default mode network was hypothesized to be mostly inwardly directed high-order cognitive processes, e.g. goal-oriented planning, encoding, and memory functions (49, 50). Although the default mode activity is not so well-defined and does not involve specific task performance, several studies (41, 42, 51–55) have recently reported apparent differences in activity in the default mode network between AD patient and normal control groups. Rombouts et al. (51) have recently observed specific alterations in the default mode network using visual encoding and non-spatial working memory tasks and they were able to distinguish between healthy controls, MCI and mild AD patients. Accordingly, the default network was impaired in MCI patients showing significantly less deactivation than the healthy controls (51, 55).
Task specific deactivations in normal controls have been a subject of extensive studies (56–59). The existence of deactivation in brain irrelevant to the stimuli was first demonstrated by Kawashima et al. (60) using a selective attention task. The leading hypothesis today suggests that the task-specific deactivation has the function to facilitate the task-specific activations through the suppression of task irrelevant cortical regions to enable the subject to focus the attention on the relevant task.
A few recent studies (51, 55, 61) in patients with MCI and AD demonstrated that not only their activation patterns differed significantly from those of the healthy subjects but also that they were different in their ability to deactivate the task-specific cortical regions, which were traditionally thought to be irrelevant for the execution of the task. Using an active navigation task, Drzezga et al. (61) showed that the decrease in regional cerebral blood flow (rCBF) in the task-irrelevant auditory cortices was diminished in patients with MCI and even completely disappeared in patients with probable AD. Furthermore, the amount of the deactivation was shown to be inversely correlated with the cognitive performance. In a BOLD fMRI study of memory task, Celone et al. (62) demonstrated that the deactivation in medial and lateral parietal regions was correlated with the severity of the memory deficit. Similar results were also reported in another fMRI study of visuospatial associative task (57). There is growing evidence suggesting the deficit in deactivating certain cortical regions seems to lead to a significantly deterioration in cognitive task performance.
Resting-state functional connectivity
The default mode network represents only one of the many resting-state functional connectivity networks. The concept of resting-state functional connectivity suggests that the brain is spontaneously active in the absence of a goal-driven task, showing rich intrinsic dynamics which can be modulated by external stimuli. Several resting-state fMRI studies (49, 63) have reported apparent inter-subject similarity in the identified network patterns. Damoiseaux et al. quantitatively evaluated the inter-subject consistency of these resting-state network patterns (63). They found not only reproducible network patterns consistent across subjects and sessions, but also evaluated the voxel-wise cross-subject variation for these networks and estimated that the average amplitude modulation of the BOLD signal is about 3%, comparable with the signal changes induced by normal task-related stimuli. Their analysis identified 10 consistent network patterns common for the entire subject group each with potentially known functional relevance from other neuroimaging studies. Some additional patterns unique to a given scanning session or subject can also be detected, as shown by the network patterns observed by us in a single normal adult (Fig. 3).
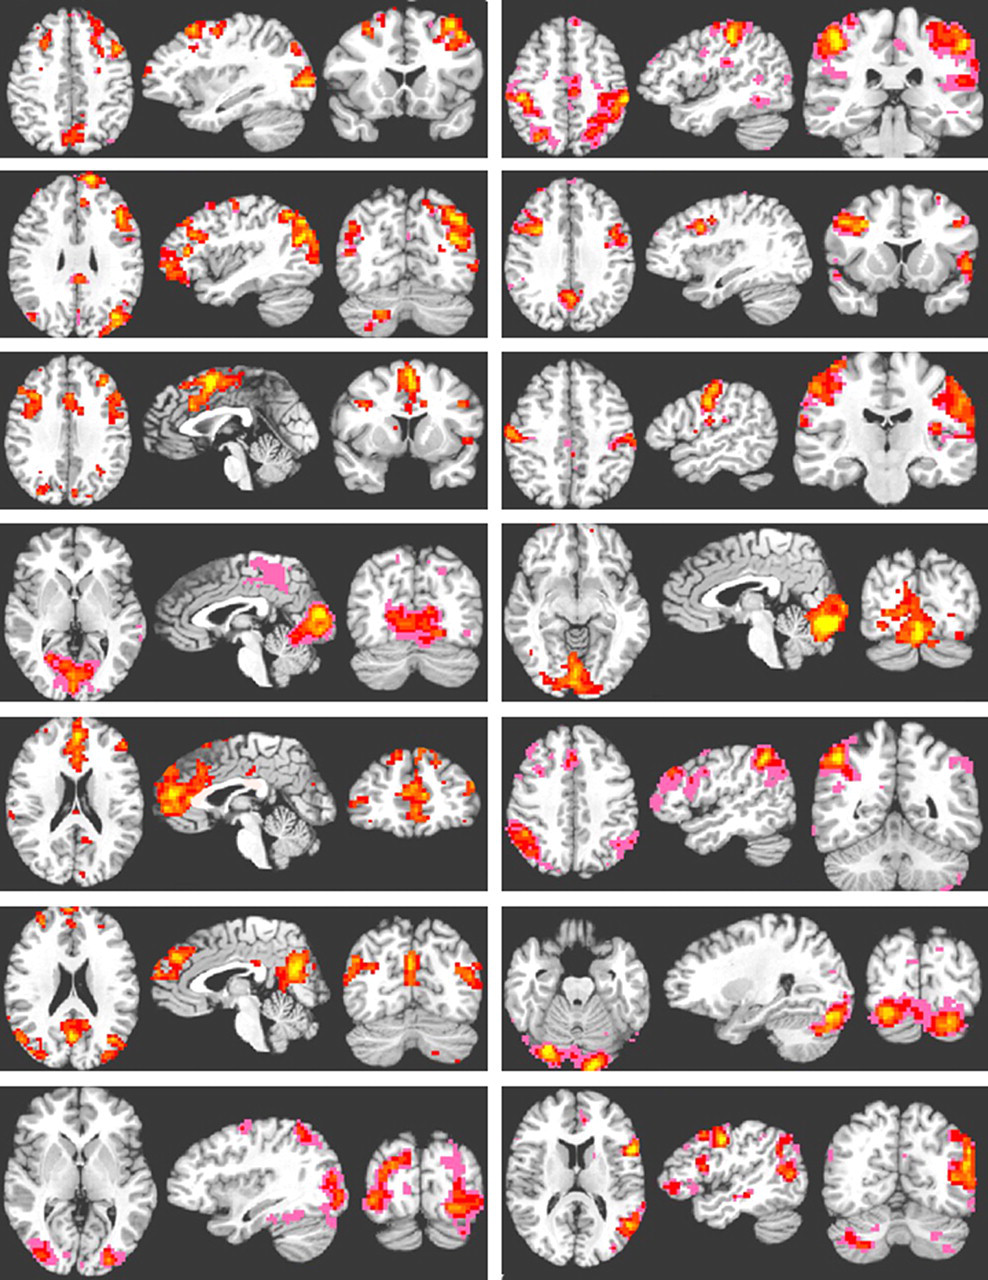
A set of connectivity network patterns from a normal adult (male, 20 years old) as extracted from an independent component analysis of 10 minute resting-state BOLD fMRI measurements at 3T. The resting-state BOLD fMRI data were acquired at 3 × 3 × 3 mm3 resolution with TR/TE = 2000/35 ms. The identified networks are quite similar to the group average results reported previously (63)
A relevant question for using the resting-state fcMRI approach to assess the risk for AD is how these resting-state networks in general and the default mode network in particular are affected by ongoing pathology leading to the neuronal damages in AD. Recently, abnormal resting-state connectivity patterns have indeed been reported in different brain regions in individuals at the risk for AD by different groups (42, 43, 45, 46, 52, 54, 55). The involved brain regions include anterior prefrontal cortex, MTL, PCC, precuneus, and parietal lobe. The most consistent observation is the decreased connectivity in PCC, precuneus, and prefrontal cortex which are the important parts of the default mode network. The changes in these brain regions (42–46, 54) were suggested to be sufficiently specific to differentiate between the normal elder group from AD patients and, therefore, could be considered a promising biomarker to identify imminent AD risk.
Investigations have tried to derive specific parametric measures to characterize the alterations in the resting-state brain activities. Li et al. (44) evaluated the cross-correlation coefficients of the spontaneous low frequency (COSLOF) components between the time courses for voxels in some specific region of interests and found significant differences in the COSLOF index among the control, probable AD, and MCI groups (44). They investigated also the relationship between the COSLOF index and cognitive performance. It was reported that the relationship between the COSLOF index and Mini-Mental Status Examination score followed an exponential function, indicating a rapid decrease in cognitive capacity for AD patients when the COSLOF index fell below a certain threshold. Maxim et al. used the fractional Gausian noise parameter to quantify the difference in the resting-state brain dynamics between the normal controls and AD patients (64). It was shown that that there were significant differences between patients with early AD and age-matched control subjects in the persistence of the fractional Gaussian noise in several foci of the default mode network.
Considering the various structural and functional network alterations associated with AD discussed above, an important question that needs to be addressed in order to use the resting-state functional connectivity mapping for assessing the risk status is the following: are the alterations in the resting-state functional connectivity related to the anatomical structure changes? Since the affected brain networks coincide largely with the early anatomical atrophy observed in AD patients, it is likely that the alterations in the resting-state functional connectivity observed in individuals at risk for AD are pathologically specific. Characterizing the disruption of resting-state functional connectivity and the underlying neural synchrony in AD patients may improve the understanding of some clinical features of the disease. Mapping of the resting-state functional connectivity may even become a promising biomarker of clinical relevance capable of differential diagnosis. It has been speculated that the breakdown of the default mode network in AD patient might lead to accelerated deposition of amyloid plaque in some specific cerebral regions (55). This is consistent with the observation that the default mode network pattern in young adults resembles astonishingly the pattern of amyloid plaque deposition in AD patients.
rCBF biomarkers for AD
ASL is a non-invasive MRI technique (65, 66) for the measurement of rCBF by labeling of the arterial water and using it as an endogenous tracer. With ASL the magnetization of arterial blood water is inverted in a region proximal to the imaged region. This is followed by a delay to allow the labeled blood to arrive at the capillary bed in the tissue of interest. The labeled blood diffuses into the tissue resulting in the local alteration of the longitudinal magnetization. Perfusion is measured by subtracting the images acquired with arterial spin labeling from control images that are acquired in the absence of labeling (67). ASL has been employed to measure rCBF in different populations, including healthy young and elder groups (68, 69), individuals carrying AD risk genotype (70, 71), MCI (72–74) and probable AD patients (72–77).
ASL studies of AD patients (72, 73, 77) demonstrated similar patterns of regional hypoperfusion as those revealed with positron emission tomography (PET) and single photon emission computed tomography (SPECT). It has been reported that both MCI and AD patients have significantly decreased rCBF in the anterior and posterior cingulate gyrus with deficit extending to the medial precuneus compared with that in the normal control subjects. This observation has also been largely confirmed by the results of our recent ASL study summarized in Fig. 4. It has been reported that the probable AD patients have decreased rCBF relative to the normal control subjects and MCI patients in the left inferior parietal, left lateral frontal, left superior temporal, and left orbitofrontal lobes. However, MCI and AD patients have significantly elevated rCBF in the hippocampus and other medial temporal structures (72, 75), particularly after correction of gray matter atrophy in these regions which are affected early in AD development. In summary, both decrease and increase in rCBF have been observed in the transition from normal cognition to AD, indicating the pathological processes associated with AD development are dynamically complex and may involve compensatory mechanisms at the neuronal and vascular levels. This seems to agree with the evidence from the fMRI studies.
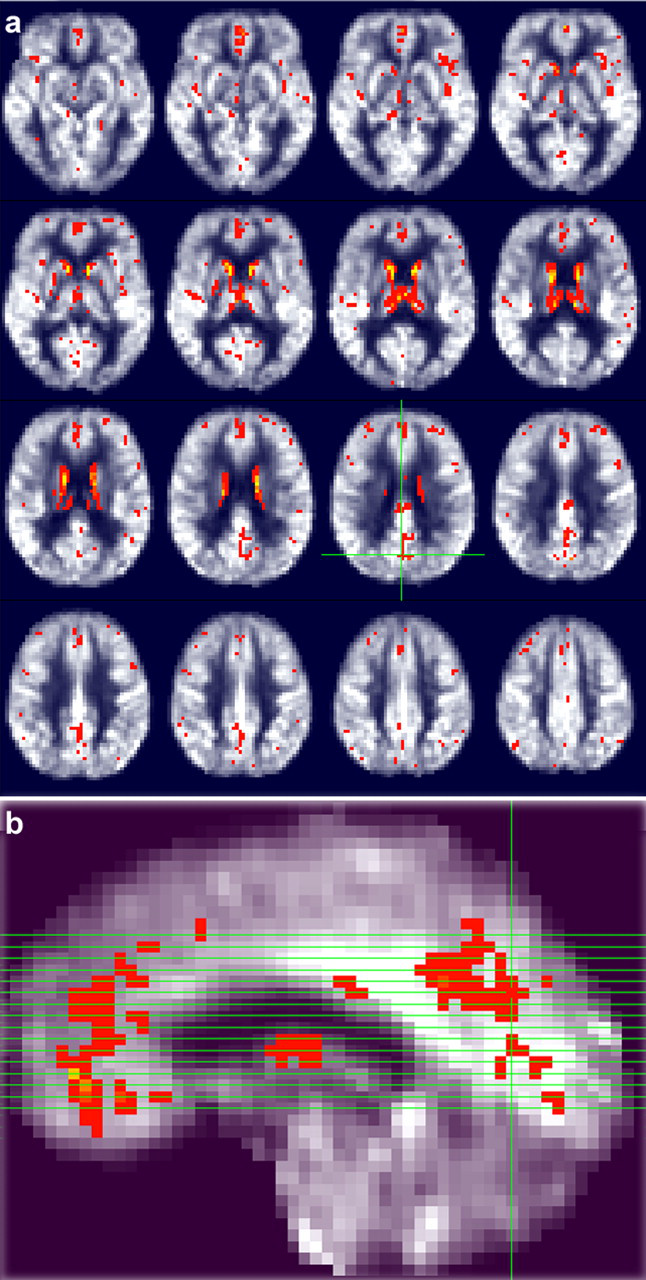
A set of axial rCBF maps obtained from a group of healthy adults (n = 40) using (a) pulsed continuous ASL measurements at 3T with overlaid statistical results in red color showing brain regions with significantly perfusion deficit (p < 0.01) for a group of probable AD patients; (b) sagital image showing the locations of the axial slices. The rCBF data were acquired using a 10-minute ASL protocol at the spatial resolution of 3 × 3 × 6 mm3
The up-to-date ASL techniques (78, 79) have several advantages over PET and SPECT including the use of an endogenous tracer rather than an intravenously administered contrast agent, relatively high spatial resolution, brief scan time of a few minutes, and capability to perform repeated rCBF measurements (73). Compared with 1.5T, ASL measurements at 3T are quite favorable because of the increased T1 relaxation time for the labeling spins and improved SNR efficiency. These features are very relevant for assessing the effects of potential AD treatments including agents designed to enhance cognition and cerebral metabolism. We are currently using the pulsed continuous ASL techniques at 3T to study the rCBF changes in response to the intake of some potential drugs.
Fractional anisotropy as a biomarker for AD
With DTI measurements, diffusion-weighting gradient pulses are applied to make the MRI signal sensitive to the water self-diffusional motion in the tissue along the directions of the applied diffusion encoding gradients (80, 81). Typically, the diffusion-weighted images are measured in multiple directions to extract the entire diffusion tensor set from which the eigenvalues and eigenvectors can be computed (82). The direction of the principle eigenvector of the diffusion tensor is usually considered to coincide with the direction of the local fiber tract. Therefore, DTI measurements can be used to determine the orientation of the fiber tracts and the neural network connections between different brain regions. Fig. 5 shows an example set of tractography results based on whole-brain fiber tracking and a specific volume of interest, respectively.

(a) Fiber tracking result for a healthy volunteer based on the whole-brain fiber tractography; (b) fiber tracking result for a probable AD patient based on a selected region of interest of 2 mL in the temporal lobe
Combining fiber tractography with the simplified parametric indexes derived from eigenvalues, such as fractional anisotropy (FA), the tissue microstructure, composition, and organization integrity can be studied quantitatively along a specific fiber bundle. Tract-based FA has become an imaging marker commonly used to study microstructural white matter abnormalities in various pathologic states. Encouraged by the notion that DTI may be more sensitive in the detection of white matter pathology than other conventional MRI scans, there is a rapidly growing interest in using DTI for AD studies. Particularly in the last few years, the number of DTI publications on AD studies doubled almost annually.
A number of DTI studies have reported reduced FA in probable AD patients compared to the normal controls in the splenium of the corpus callosum and the cingulum bundle (83–88). Differences between AD patients and normal controls have also been shown within several other brain regions that involve higher cognitive functions, such as the frontal, middle temporal, and parietal white matter, but not in the brain regions serving primary functions. The results of decreased FA in these affected brain regions suggest that microstructural degradation of cerebral white matter in AD may lead to the decline of cortical connectivity and impairment of cognitive functions.
In MCI subjects, evidence of white matter damage from DTI studies is still limited. Several studies showed significant reductions of FA for MCI subjects in the temporal, parietal, posterior cingulate, and hippocampal white matter (89–92). Reduced FA in the cingulum bundle (88) and the splenium of the corpus callosum (84, 93) has also recently been reported. However, there are inconsistencies across the studies regarding the precise locations of the white matter abnormality in MCI subjects. For example, FA changes in the fornix and the orbitofrontal white matter have been reported for non-demented adults of APOE carriers in familial AD (94). Such changes have not been confirmed in MCI and AD patients. These types of inconsistencies might be related to the differences in the subject profiles and methodologies used for analyzing the DTI data.
More recent studies (88, 90) used tractography-based method by studying changes in specific fiber tracts. Such studies used not only the simplified FA parameter but also the eigenvalues directly. The diffusion tensor eigenvalues may be separated into components which describe diffusivity parallel or perpendicular to the axonal tracts. Axial diffusivity parallel to axon tracts and radial diffusivity perpendicular to axon tracts may be helpful to better describe the underlying pathology of white matter alterations reflected by FA. It has been suggested that decreased axial diffusivity may be related to axonal loss and increased radial diffusivity may be associated with loss of myelin. The reported findings for early AD and MCI subjects so far indicate that the reduced FA in the temporal lobe (89) and posterior cingulate fasciculus is associated with the alteration of diffusivity along the fiber tracts suggesting axonal degeneration. However, the results from frontal regions showed signs of increased diffusivity perpendicular to the axons indicating altered myelination.
From a theoretical point of view, microstructural alterations of the cerebral fiber system should be among the earliest changes in neurodegenerative disease. Unlike volumetric measures based on T1-weighted MRI, diffusion anisotropy index and other directional diffusivity parameters can provide quantitative measures of the local microstrucal integrity, environments, and organization. Therefore, DTI derived parameters have potential to become more sensitive quantitative markers than the conventional volumetric MRI for the early diagnosis of AD, as also indicated by some preliminary studies summarized above. If this can be confirmed by studies based on larger patient population, DTI may find application in clinical practice for assessing AD risks.
MRS biomarkers for AD
MRS takes advantage of the fact that hydrogen atoms residing in different chemical environments differ slightly in their nuclear magnetic resonance frequencies. With the selective excitation techniques based on the combination of selective radio frequency and magnetic field gradient pulses, the distribution of these 1H resonances in a given volume of brain tissue in the order of a few milliliters can be extracted as a spectrum. Saturation is usually needed to suppress the dominant water component. Besides the large residue water peak, the typical discernible peaks include choline (Ch), creatine (Cr), N-acetyaspartate (NAA), lactate, and other minor peaks.
MRS of the hippocampus is under-utilized in the studies of normal aging and AD, even though the hippocampus is clearly among the earliest and most consistently affected structures in AD. The slow development of hippocampal MRS can be attributed to at least two major factors. Firstly, the reproducibility and accuracy of hippocampal MRS are currently insufficient for clinical practice, stemming primarily from the difficulty of magnetic field shimming in this region and the intrinsic tissue complexity of the hippocampus, leading to broad line-width, limiting spectral resolution, and inadequate water suppression. Thereby, it results in poor accuracy and reproducibility. Secondly, the duration of spectroscopic studies, although significantly improved due to the availability of higher magnetic field and more sensitive detectors (95), is still about 10 min in duration, which may be too long for some AD patients.
As discussed above, a large body of in vivo neuroimaging data has shown that the hippocampus and the entorhinal cortex are affected early in the development of AD, consistent with the memory dysfunction, as the defining symptom of Alzheimer's disease. Several groups have demonstrated that AD patients have reduced hippocampal NAA concentration or lowered NAA/Cr ratio than the normal controls (96, 97). This point is also illustrated by Fig. 6 showing a typical in vivo 1H MR spectrum acquired by us at 3T from the brain of an AD patient. Similar findings have also been reported in other brain regions, such as the parietal, occipital cortex (98), and posterior cingulate (99–102). In a recent 3T MRS study of AD, MCI and healthy control subjects by Wang et al. the metabolite changes in the hippocampus and posterior cingulate region were compared (103). It was confirmed that in the hippocampus, there were significant differences in NAA/Cr among the three subject groups. But they did not find any significant difference in the NAA/Cr in the posterior cingulate area. Instead, they found significant difference in the myo-inositol (MI)/NAA ratio both in the hippocampus and posterior cingulate region. It should be pointed out that myo-inositol has a more complex coupled spin system and it is typically harder to quantify with standard MRS techniques.
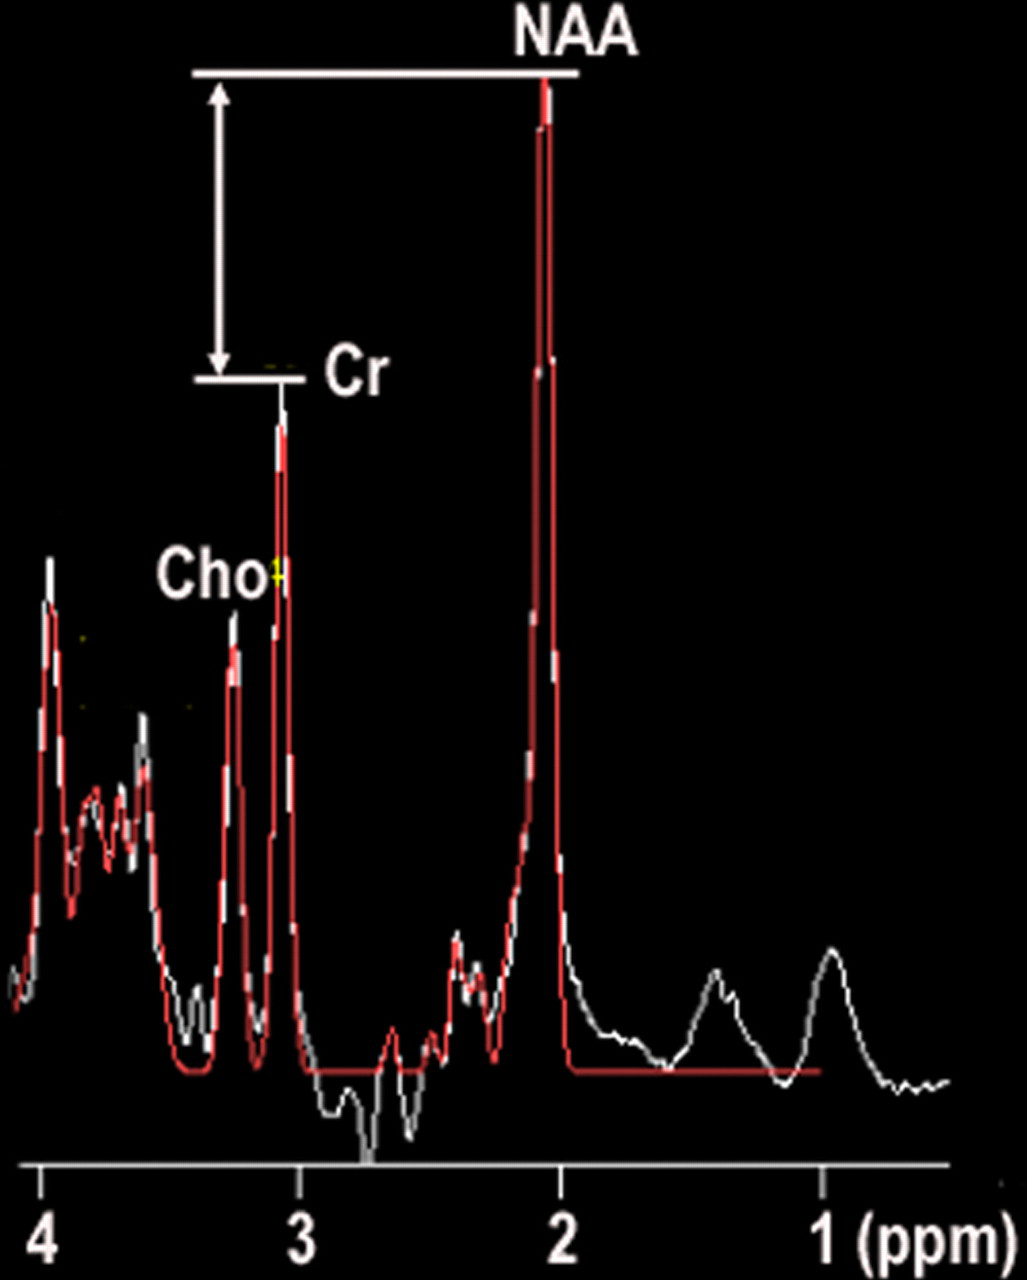
A typical 1H MRS spectrum acquired from the middle temporal lobe of a probable AD patient (female, 72 year old) showing reduced NAA/Cr ratio relative to that of normal control. The spectrum was acquired at 3T using the standard single-voxel point resolved spectroscopy method with 8 minutes acquisition time
Although many studies (96–102) have not found the MRS results to be very specifically predictive for AD risk, there are studies (97, 104, 105) that conducted both volumetric and MRS measurements and showed significantly improvement in sensitivity and specificity for discrimination of AD from normal elderly than does either measure alone. Particularly, 1H MRS and structural MRI findings were found to be complementary for characterization of MCI subtypes (104). This is reasonable, because MRI is known to under-estimate the degree of hippocampal neuron loss in MCI because of reactive gliosis. MRS may be sensitive to the molecular neuropathology of Alzheimer disease, which is thought to precede the structural brain alteration. However, hippocampal MRS is technically difficult as discussed above. Therefore, hippocampal MRS combined with quantitative measurements of hippocampal atrophy by MRI may improve the diagnosis of AD.
Longitudinal studies are clearly important for monitoring and predicting disease progression, however, there have been very few longitudinal studies utilizing MRS. Dixon et al. (8) reported that patients with mild AD displayed a 26–30% decline of NAA and NAA/(Ch + Cr) over the period of one year. However, due to the large standard deviation of the measurements and the limited number of subjects (n = 9), the change was not statistically significant. In comparison, the hippocampal volumetry displayed a statistically significant decrease, although the volumetric reduction of the hippocampus was only 12%, which was about half of the decline in the metabolites. Adalsteinsson et al. (24) conducted a similar study of 12 AD patients and found that gray matter NAA declined at a much faster rate than gray matter volume over the course of one year.
Conclusion
MRI has played a very important role in diagnosing early AD at the MCI stage, staging of AD, and differentiation of AD from other dementia. Recent technical advances in fMRI, fcMRI, ASL, DTI, and MRS have remarkably raised the value of magnetic resonance in AD research and clinical practice. With the advent of MRI technology, it is quite likely that in the near future MRI based neuroimaging biomarkers can play more important roles in the accurate assessment of AD risk, prediction of the symptom onset, monitoring the progression of AD, and assessing therapeutic effects.
Footnotes
ACKNOWLEDGEMENTS
Experimental assistance from P Westman is gratefully acknowledged.