
Abstract
Background
For men with clinically localized prostate cancer and candidates to receive radical prostatectomy (RP) a main concern is a cancer recurrence after treatment. Although previous studies have demonstrated the diagnostic utility of diffusion-weighted imaging (DWI) for prostate cancer, the prognostic value of pretreatment DWI has not been investigated yet.
Purpose
To investigate the incremental value of MRI-based T staging using DWI and T2-weighted imaging (T2WI) as compared with the clinical parameters in prediction of biochemical recurrence (BCR) after RP for clinically localized prostate cancer.
Material and Methods
Sixty MR examinations, obtained before RP between April 2002 and March 2009, were retrospectively reviewed using T2WI alone, DWI alone, or T2WI + DWI for T staging according to the 2002 American Joint Committee on Cancer guidelines. The relationship between MRI stage and BCR was evaluated using Kaplan-Meier survival estimates. Multivariate analysis and receiver operating characteristics (ROC) curve analysis were used to investigate the incremental value over the standard clinical variables in prediction of BCR.
Results
As of August 2009, 12 (20%) patients had BCR. Based on T2WI + DWI, both T3a (compared to OC disease) and T2 (compared to T1c) showed significantly higher BCR rates (p = 0.047 and 0.025, respectively). Multivariate analysis and area under ROC curve analysis confirmed the additional value of MRI staging to the conventional clinical variables in prediction of BCR.
Conclusion
The combination of T2WI and DWI on performing pretreatment MRI helped predict BCR after RP in clinically localized prostate cancer.
For men with clinically localized prostate cancer and candidates to receive curative treatment such as radical prostatectomy (RP) a main concern is a cancer recurrence after treatment. Therefore, nomograms and tables to predict recurrence following surgery have been constructed using preoperative parameters, such as clinical stage, prostate-specific antigen (PSA) level and the biopsy Gleason score (1–3).
Magnetic resonance imaging (MRI) is acknowledged as the best imaging method to stage and locate prostate cancer (4), since it has excellent soft-tissue contrast, providing high-resolution images. Traditionally, T2-weighted imaging (T2WI) has been used; however, T2 information alone has low sensitivity and specificity for cancer detection since other pathologies, for example, prostatitis and hemorrhage, can have a similar appearance (5, 6). MR spectroscopy (MRS) and dynamic contrast-enhanced MRI (DCE-MRI) have also been used, though they have several disadvantages. The main limitations of MRS are the low signal-to-noise ratio, limited metabolite information, and long data acquisition times (7). The limitations of DCE-MRI include unsatisfactory depiction of transition zone (TZ) cancer in the patients with hypervascular benign prostatic hyperplasia (8) and also there is no consensus regarding the best acquisition protocol and the optimal perfusion parameter for differentiating cancer from healthy tissue.
An alternative additional approach to the conventional T2WI, MRS, and DCE-MRI is diffusion-weighted imaging (DWI). Numerous authors demonstrated that the apparent diffusion coefficient (ADC) values are lower in the regions of prostate cancer than in the non-cancerous peripheral zone (PZ) (9–16) and TZ (13–16). Other authors suggested that the use of DWI in combination with T2WI improves the diagnostic accuracy (17–19).
Several previous studies evaluated the clinical utility of MRI/MRS to predict biochemical recurrence (BCR) of prostate cancer after RP, mainly according to the presence or absence of extracapsular extension (ECE) (20–25). Those investigators suggested that the MRI/MRS findings of the extra-prostatic disease were the independent significant predictors of BCR. However, so far no study to our knowledge has investigated the correlation between the tumor visualization on an individual basis on MRI among organ-confined (OC) prostate cancers and BCR. Moreover, the prognostic value of pretreatment DWI for prostate cancer has not been investigated yet. Therefore, the purpose of our study was to investigate whether pretreatment detailed T staging using DWI in addition to T2WI can help predict BCR after RP for clinically localized prostate cancer and have incremental value as compared with the clinical parameters.
Material and Methods
Subjects
This study was conducted in a retrospective and single-institutional fashion, and approved by the institutional review board. Informed consent was obtained from all participants. Between April 2002 and March 2009, 74 consecutive patients underwent MRI at our institution before RP.
Patients were excluded if MRI had been performed over 100 days before the biopsy (n = 5) or within 3 weeks after the biopsy (n = 2), considering the influence of post-biopsy hemorrhage and edema (26). Patients were also excluded if their neoadjuvant hormonal therapy (HT) had been started before MRI (n = 2). Furthermore, the patients with incomplete follow-up data (n = 4) and those who had received adjuvant HT (n = 1) were excluded, too.
The final study group consisted of 60 men with median age of 66 years, pretreatment PSA level of 8.1 ng/mL and biopsy Gleason score of 7. All patients were considered to have OC disease on the basis of digital rectal examination (DRE), and 41/60 (61%) were diagnosed as having non-palpable tumors (T1c). In our institute, patients with unequivocal bulky extraprostatic disease on MRI were not candidates for RP and were not included in this study population. Table 1 summarizes the patients' characteristics in our study.
Summary of the patients' clinical characteristics associated with BCR
PSA = prostate specific antigen, BCR = biochemical recurrence, DRE = digital rectal examination, HT = hormonal therapy
All RP procedures were performed by a single surgeon (TM) in a conventional retrograde fashion following Walsh et al. (27). The follow-up protocol was to monitor the serum PSA levels every 3 months in the first and second postoperative years, and every 6 months from the third year. BCR was defined as PSA elevation above 0.2 ng/mL at two consecutive postoperative visits starting 30 days after the completion of RP (28).
MRI data acquisition
All images were obtained using a 1.5 T superconducting MR system (Gyroscan Intera Nova Dual; Philips Medical Systems, Best, The Netherlands) with a 5-channel phased array coil. After obtaining three plain localizer images, T2-weighted turbo spin-echo images were acquired in the axial plane using the following parameters: (4700/120/17 [repetition time (TR)/echo time (TE)/echo train length]) four signal excitations; whereas T1-weighted turbo spin-echo images were acquired in the axial plane using the following parameters: (500/9/5) two signal excitations. Both T2-weighed and T1-weighted images were taken at 4-mm section thickness, 0.4 mm intersection gap, 200 mm field of view, 256 × 256 acquisition matrix, and 512 × 512 reconstruction matrix. Next, the axial DWI was acquired using a spin-echo-echo-planar imaging sequence using the following parameters: (2460/49 [TR/TE]), six signal excitations, 5 mm section thickness, 0.5 mm intersection gap, 270 mm field of view, 128 × 95 acquisition matrix, 256 × 256 reconstruction matrix, b factor of 0 and 800 sec/mm2, and sensitivity encoding (SENSE) reduction factor of 2. A right-to-left phase-encoding direction was used to decrease motion artifacts from the abdominal wall for all sequences.
MRI data interpretation
Two radiologists with six and 12 years of experience (KN and SY), who were blinded to the clinical data and surgical pathology, retrospectively interpreted MRI following the consensus on established criteria for prostate cancer (5, 6, 13, 29, 30) to determine the MRI T stage.
On T2WI, focal nodular areas of abnormal low signal intensity were considered as cancers, whereas focal non-nodular areas of abnormal low signal intensity were considered as benign lesions, such as post-biopsy changes or prostatitis (5, 6). On DWI, the focal nodular areas with abnormal high signal intensity were considered to represent tumors (13, 15, 30). If the lesions were hyperintense on T1WI, they were considered to represent post-biopsy hemorrhage.
Readers assessed the presence and extent of malignancy and staged the tumors according to the 2002 American Joint Committee on Cancer guidelines (31) as follows; T1c was not visualized, T2 was visible but without ECE, T3a showed capsular penetration, T3b had seminal vesicle invasion, and T4 was growing into the adjacent organs, such as the urinary bladder. ECE was judged as present on MRI if the findings were as follows: neurovascular bundle asymmetry, obliteration of the rectoprostatic angle, irregular bulging of the prostate contour, tumor signal intensity within the periprostatic fat, and overt extracapsular tumor (32).
T2WI was reviewed in random order to determine the MRI T stage. Three weeks later, DWI was reviewed in random order, too. In combined evaluation of T2WI and DWI, the staging was designated based on the higher of the two. On each evaluation, T1WI was used to rule out post-biopsy hemorrhage.
Statistical analysis
The relationship between the pretreatment MRI findings and BCR was evaluated using log-rank test from Kaplan-Meier actuarial survival estimates. Univariate and multivariate Cox regression analyses were used to compare the predictive values of MRI with the standard clinical variables such as the patient's age, duration of neoadjuvant HT, pretreatment PSA, biopsy Gleason score, and clinical stage based on DRE. We further investigated the incremental value of MRI staging to the clinical preoperative predicting table for BCR after RP (published by Han et al.) (1), using the area under the receiver operating characteristic (ROC) curve analysis. The area under ROC curves (AUCs) were compared by ANOVA together with jack-knifing bias-correction method (33).
Analyses were performed using Statview 5.0, JMP 8 (SAS Institute, Cary, NC, USA) and DBM MRMC Version 2.2 (CE Metz, The University of Chicago, Chicago, IL, USA). A significance level of 5% or less was used to define statistical significance.
Results
After a median follow-up of 45 months (range 3–84 months) after RP, 12 patients had BCR. The distribution of T staging on MRI is shown in Table 2. On T2WI, 29 patients were diagnosed as T1c, 21 as T2, and 10 as T3a. On DWI, 21 patients were diagnosed as T1c, 33 as T2, and five as T3a. In the combined evaluation of T2WI and DWI, 17 patients were diagnosed as T1c, 31 as T2, and 11 as T3a. Twelve T2WI-based T1c patients were diagnosed as T2 or T3a on DWI, and 10 of these 12 patients were diagnosed as having TZ tumors (Fig. 1). Four tumors were detected with T2WI only and were diagnosed as T1c on DWI, since they did not demonstrate focal hyperintensity on DWI. More patients were diagnosed as T3a with T2WI (n = 10) than with DWI (n = 5). Only one patient was diagnosed as T3a only with DWI. Staging with T2WI and DWI was the same in 40 patients but different in 19 patients. No patients were diagnosed as having T3b or T4 disease with MRI in our study.
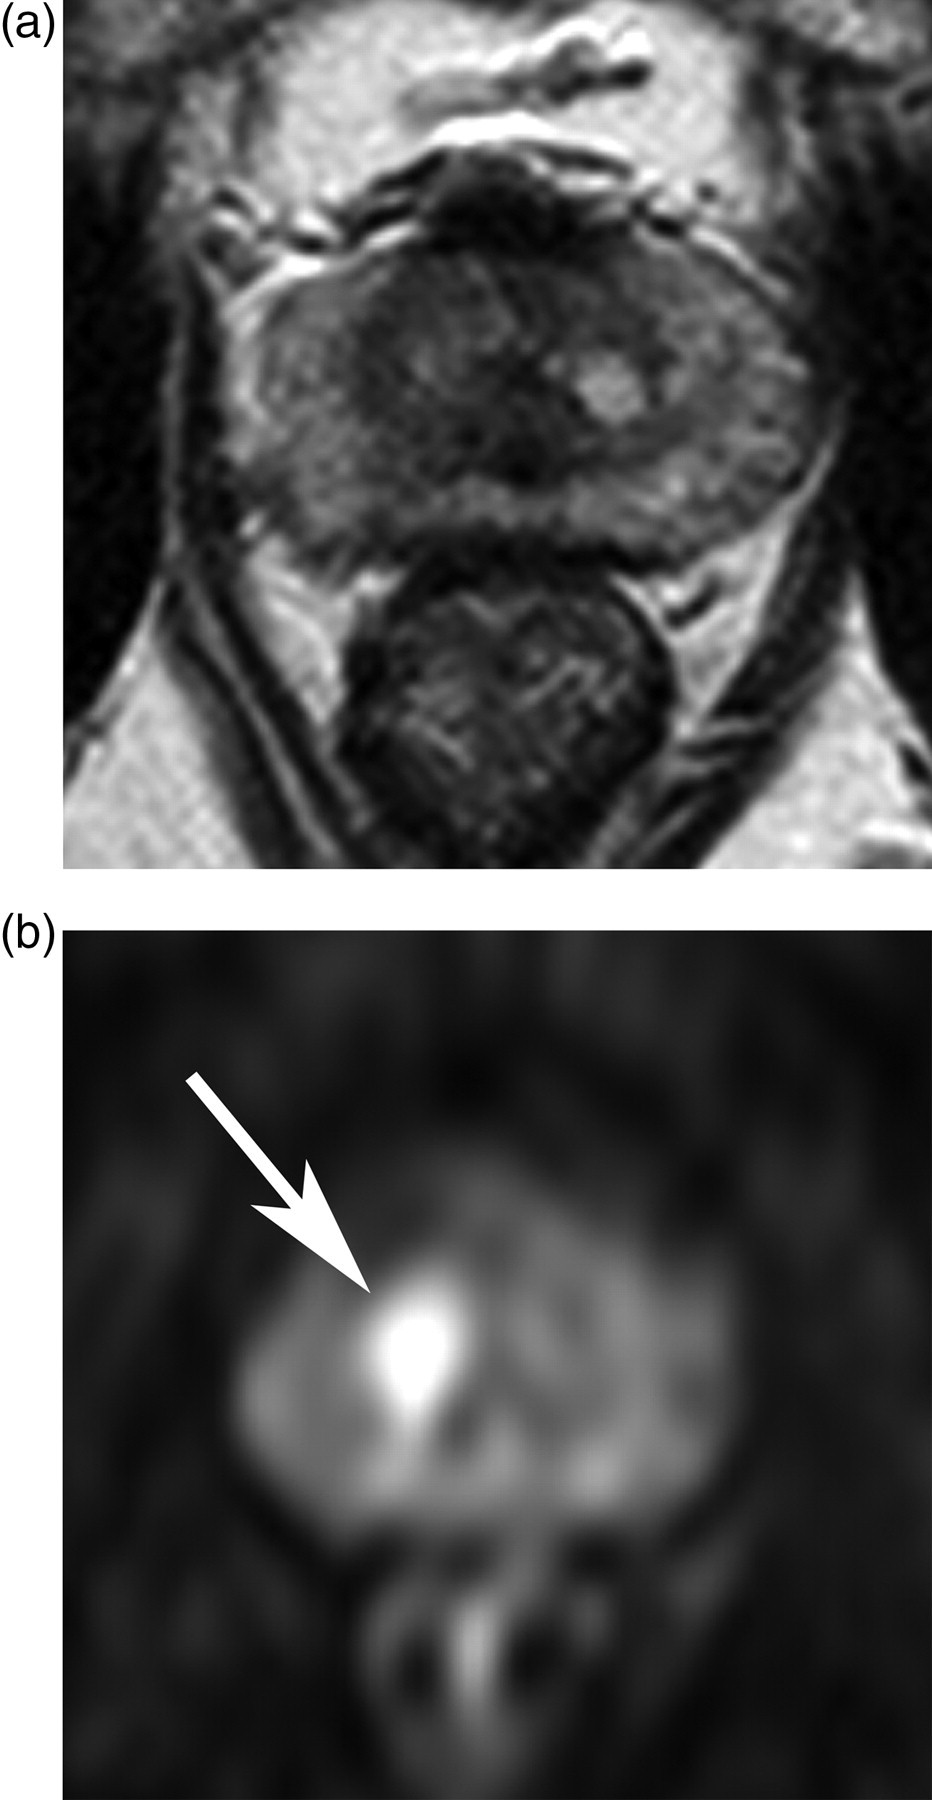
MR images of a 68-year-old patient with PSA serum level of 10.32 ng/mL, Gleason score of 7, and histologically confirmed stage T2a prostate carcinoma; (a) Transverse T2-weighted turbo spin echo image (4700/120) showing no apparent tumor (T1c); (b) Transverse diffusion-weighted image (b = 800) showing a focal high intensity area in the right transitional zone (arrow), which was classified as T2
Distribution of patients according to MRI staging
T2WI = T2-weighted imaging, DWI = diffusion-weighted imaging, N/A = not available
Numbers in parentheses represent percentages
BCR analysis by T2WI
On T2WI, the 3-year BCR free rates of OC disease (T1c or T2) and T3a were 85% and 70%, respectively. As compared to OC disease, T3a on T2WI was a significant predictor of BCR (p = 0.029) (Fig. 2a). The 3-year BCR free rates of T1c and T2 were 93% and 72%, respectively. There were no significant differences in the BCR rate between T1c and T2 (p = 0.177) (Fig. 2b).

Kaplan-Meier PSA recurrence-free survival curves according to T2-weighted imaging findings of (a) extracapsular extension (T3a) or organ-confined disease and (b) stage T1c or T2
BCR analysis by DWI
On DWI, the 3-year BCR free rates of OC disease and T3a were 82% and 80%, respectively. As compared to OC disease, T3a was not a significant predictor of BCR (p = 0.591) (Fig. 3a). The 3-year BCR free rates of T1c and T2 were 95% and 74%, respectively. There was a significant difference in the BCR rate between T1c and T2 (p = 0.027) (Fig. 3b).
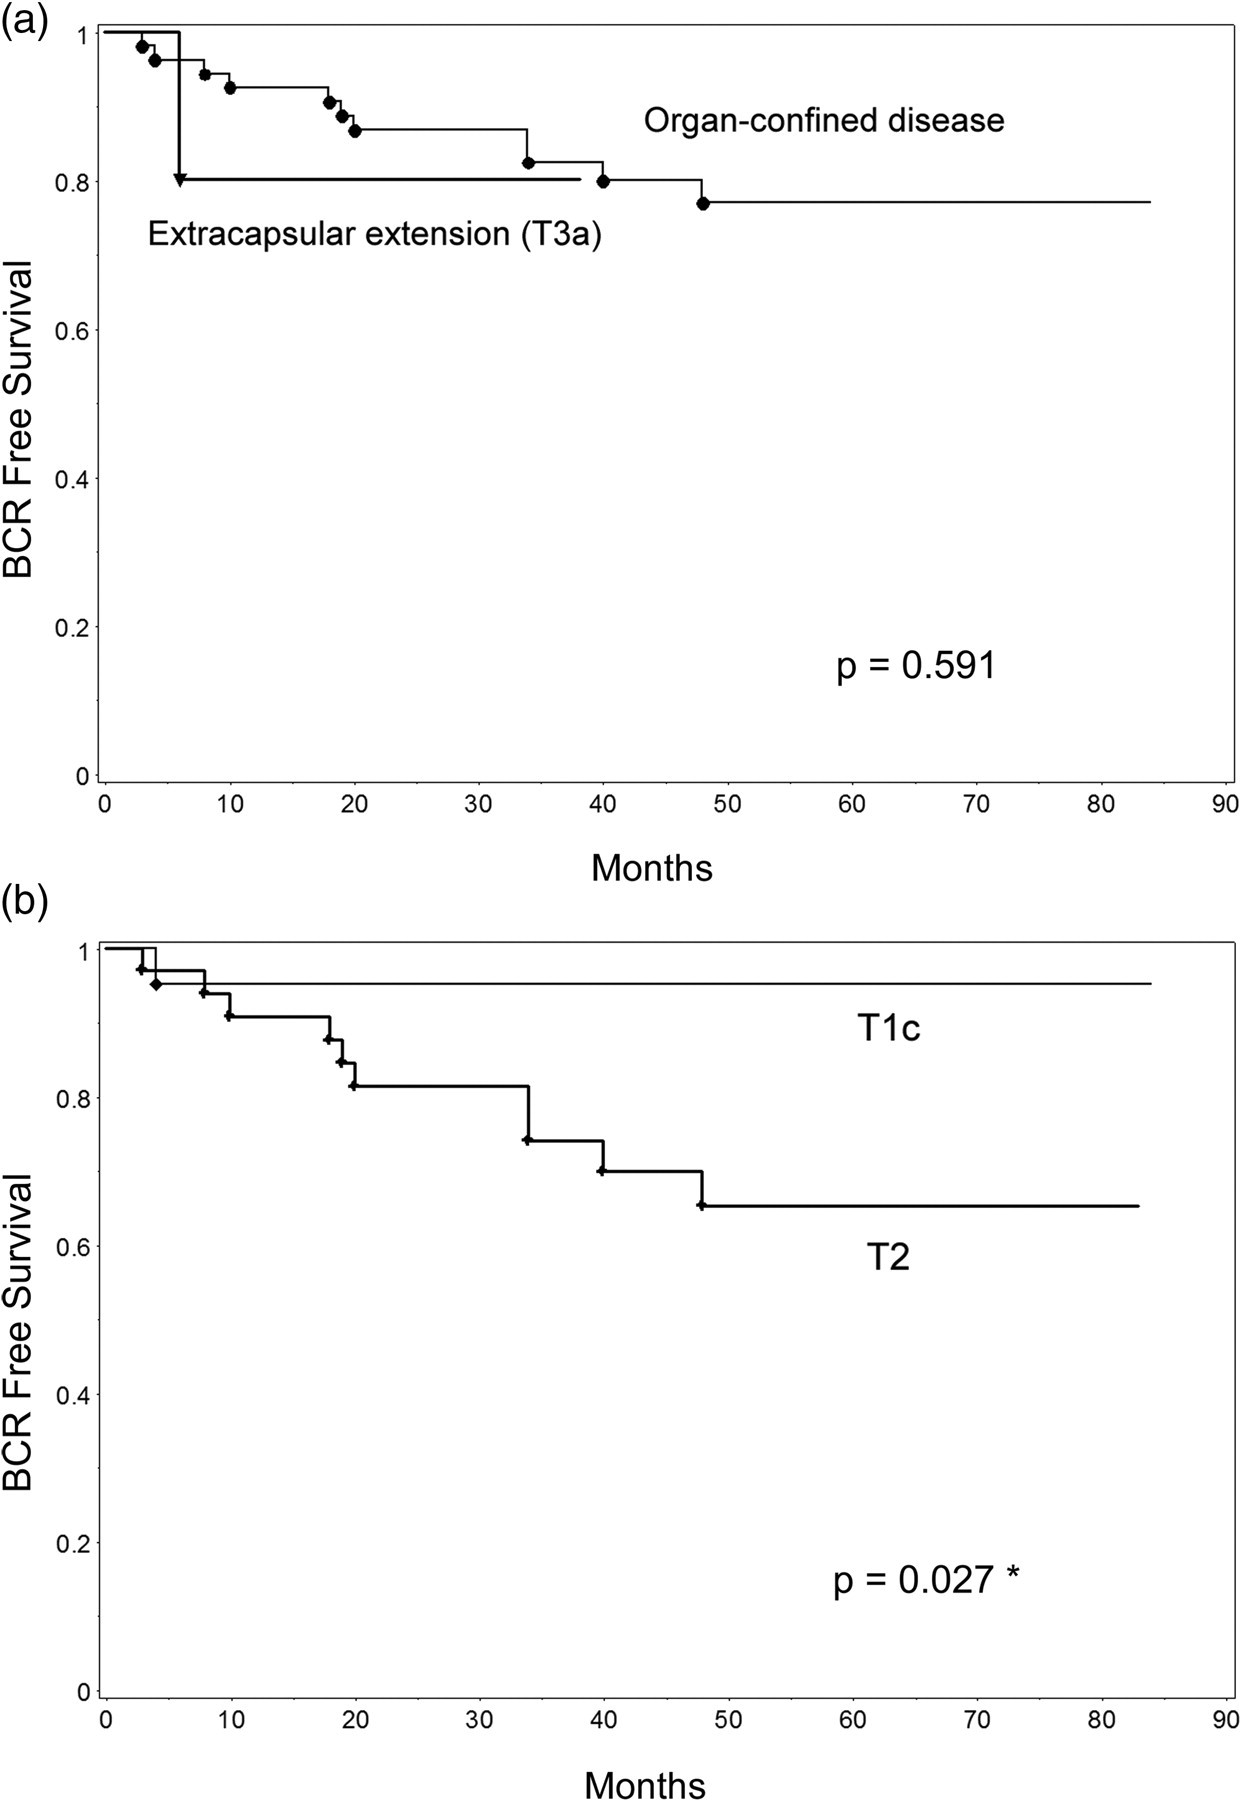
Kaplan-Meier PSA recurrence-free survival curves according to diffusion-weighted imaging findings of (a) extracapsular extension (T3a) or organ confined disease and (b) stage T1c or T2
BCR analysis by combination of T2WI and DWI
In the combined evaluation of T2WI and DWI, the 3-year BCR free rates of OC disease and T3a were 84% and 73%, respectively. As compared to OC disease, T3a was a significant predictor of BCR (p = 0.047) (Fig. 4a). The 3-year BCR free rates of T1c and T2 were 100% and 75%, respectively. There was a significant difference in the BCR rate between T1c and T2 (p = 0.025) (Fig. 4b).
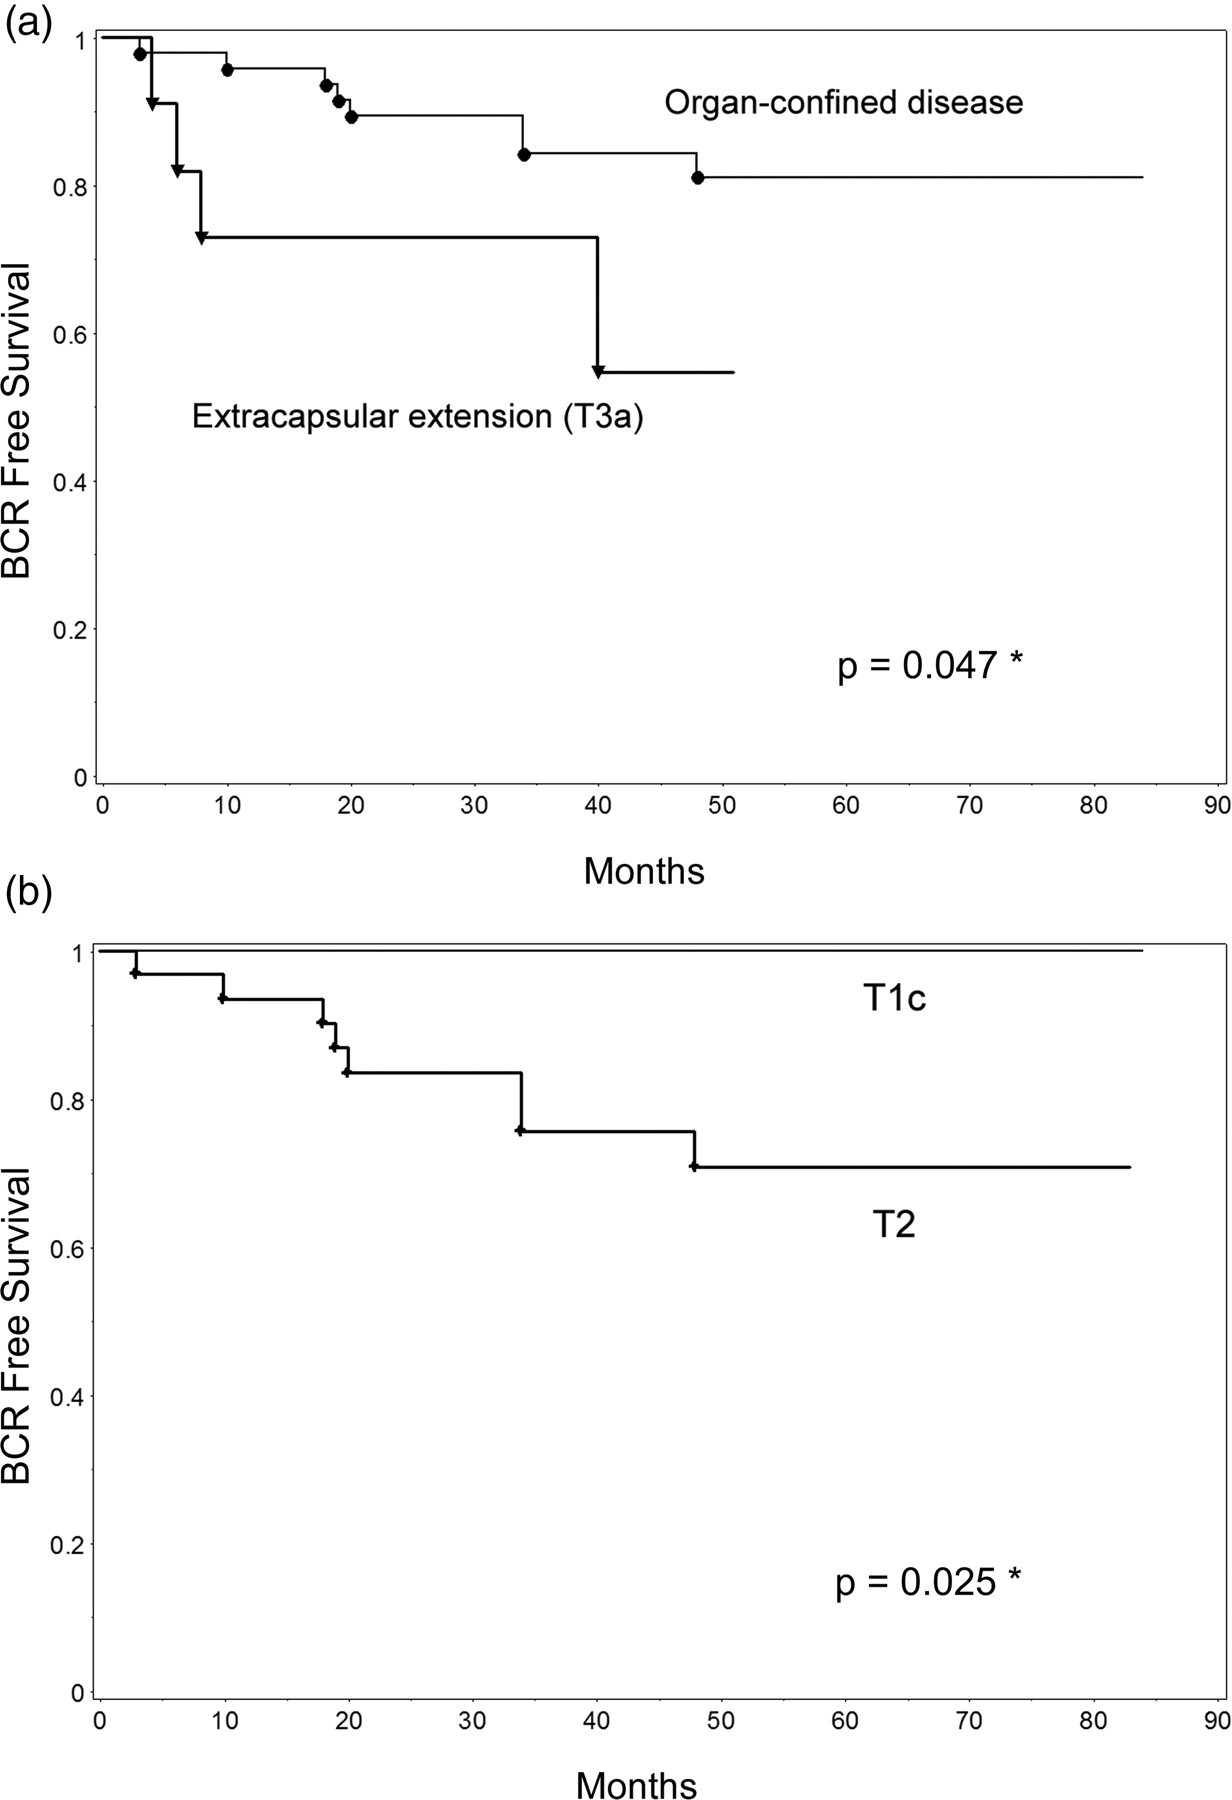
Kaplan-Meier PSA recurrence-free survival curves according to combined T2-weighted and diffusion-weighted MRI findings of (a) extracapsular extension (T3a) or organ-confined disease and (b) stage T1c or T2
Evaluation of MRI staging and the clinical variables to predict BCR by Cox regression hazard model
In the univariate analysis, high biopsy Gleason score (8–10) significantly correlated with BCR (p = 0.025) (Table 3).
Cox proportional hazard univariate and multivariate analyses for clinical variables and MRI T staging to predict BCR
*p < 0.05
BCR = biochemical recurrence, HR = hazard ratio, CI = confidence interval, OC = organ confined, PSA = prostate specific antigen, NHT = neoadjuvant hormonal therapy
In the multivariate analyses, which included MRI (T2WI + DWI) of stage T3a and clinical variables (age, pre-treatment PSA, clinical stage (T2a-c), biopsy Gleason score (8–10), and duration of neoadjuvant HT), MRI stage (hazard ratio [HR]: 4.62, 95% confidence interval [CI]: 1.11–17.64, p = 0.037) and biopsy Gleason score (HR: 4.58, 95% CI: 1.09–17.15, p = 0.039) significantly correlated with BCR (Table 3).
Comparison of MRI staging and the predicting table by ROC analysis
The AUC for the clinical predicting table plus T2WI + DWI staging (0.79) was significantly greater than the AUC for the predicting table alone (0.67) (p = 0.047) (Fig. 5). Neither AUC for the predicting table plus T2WI staging (0.73) nor DWI (0.75) staging was significantly greater than AUC for the predicting table alone (p > 0.05).
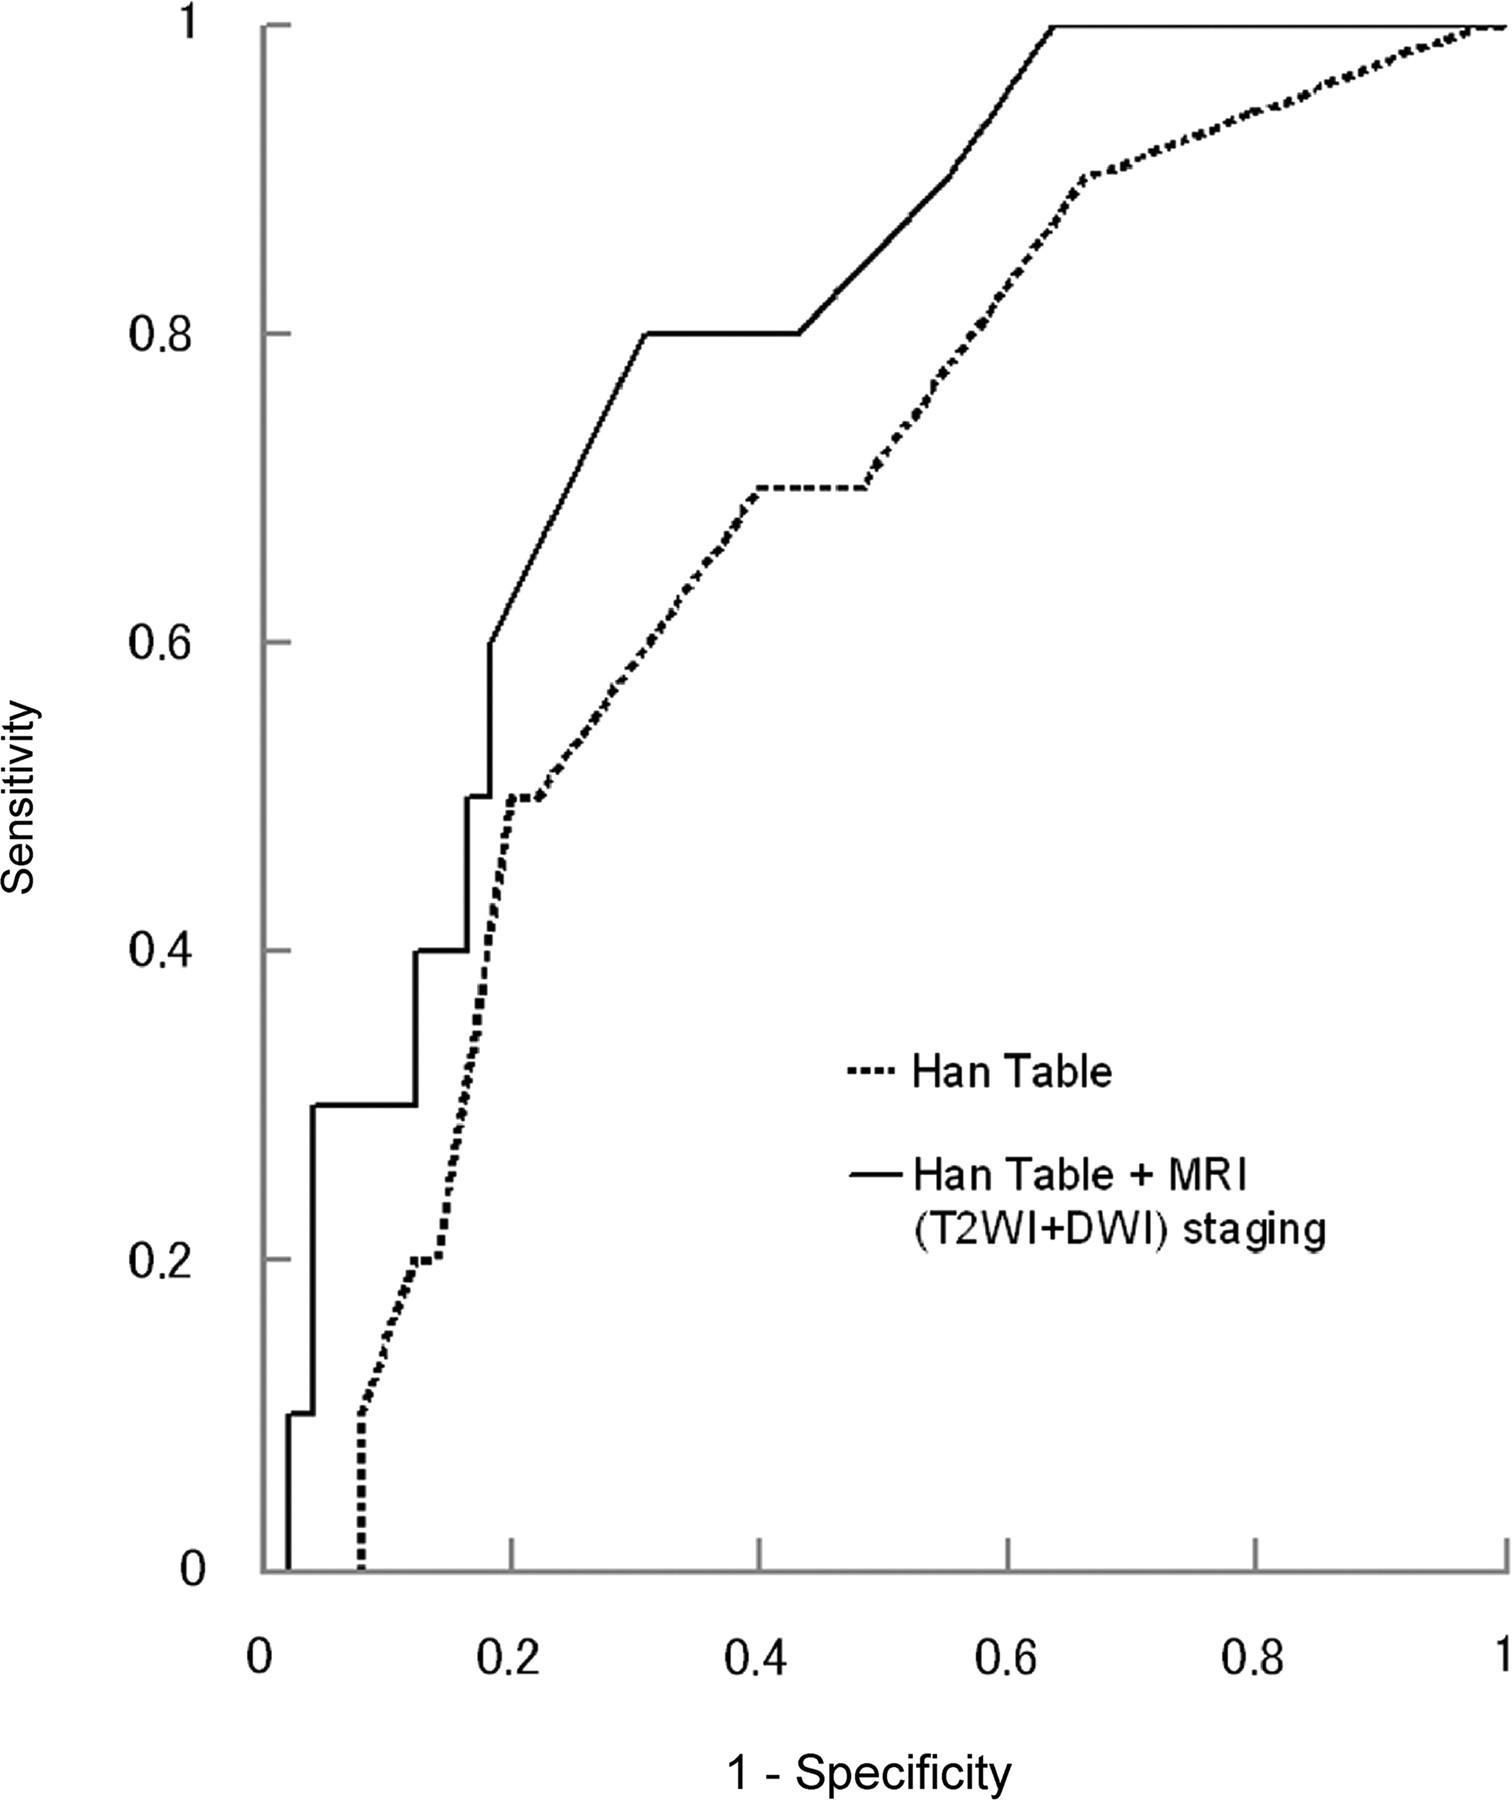
A graph showing receiver operating characteristic curves for probabilities of biochemical recurrence on the basis of the clinical preoperative predicting table (Han table) and the predicting table plus MRI (combined T2-weighted and diffusion weighted imaging) staging. The model containing the predicting table plus MRI staging (0.79) has a significantly greater area under curve than the model containing only the predicting table (0.67; p = 0.047)
Discussion
Similarly to the previous findings (21–25), our study revealed that detection of T3a disease on T2WI was a significant predictor of BCR as compared with OC disease. On the other hand, T3a on DWI was not a significant predictor of BCR as compared with OC disease, possibly because the lower spatial resolution and signal-to-noise ratio of DWI as compared with T2WI, and its inability to clearly visualize the periprostatic anatomy may obscure minor ECE. In fact, fewer T3a lesions were diagnosed by DWI than by T2WI (Table 2).
Among OC disease, T2WI-based T1c showed a lower BCR rate than T2, but the difference between them was not significant. On the other hand, the BCR rate of T1c was significantly lower than that of T2 on DWI. Some recent studies have suggested that ADC could reflect the pathological aggressiveness of prostate cancer and, therefore, poor prognosis. Gibbs et al. (34) and Wang et al. (35) reported that ADC inversely correlated with the tumor cellularity. Wang et al. also noted that the well-differentiated prostate cancer tended to have a higher ADC than the poorly differentiated prostate cancer. In addition, Tamada et al. (14) reported a significant negative correlation between ADC in PZ cancer and the tumor Gleason score. It could be speculated that, since more pathologically aggressive tumors tend to have lower ADC and are hyperintense on DWI, DWI-based T1c and T2 correlated well with BCR.
In the combined evaluation of T2WI and DWI, significant differences in BCR were noticed between T3a and OC disease and also between T1c and T2. This could be explained by the combined information from T2WI with high spatial resolution and signal-to-noise ratio providing anatomical information to diagnose ECE, and DWI representing the pathologic characteristics of the cancer.
We also investigated whether MRI stage may have additional prognostic value over the clinical prognostic variables. The multivariate analysis revealed that the MRI stage was a significant independent predictor. In addition, ROC analyses showed that MRI added prognostic information to the published predicting table, and the benefit of combined evaluation of T2WI and DWI was indicated, too.
Our study had some limitations. First, this was a retrospective study performed at a single institution. Second, image quality is not equal to state-of-the-art imaging. However, it is inevitable since a long follow-up period is required to evaluate prostate cancer prognosis. Third, patients who have undergone neoadjuvant HT and its possible influence on BCR should be considered. Nonetheless, in the present study, there was no significant difference in the prevalence or duration of neoadjuvant HT between the patients with or without BCR. The less significance in the use of neoadjuvant HT was also confirmed in the multivariate analysis. Fourth, the evaluation including pathological findings was not performed since the comparison between MRI and pathological results was not accurate in the patients with neoadjuvant HT which may alter the histopathological evaluation. Fifth, this study was based on limited number of patients (n = 60) during a long period (about 7 years). Analysis based on just 60 patients may have limited power to detect independent predictors of BCR, and it would be inappropriate to conclude that the factors showing no statistical significance in this study are definitely unrelated to BCR. Moreover, the long study period raises concern about the changes of the methodology. However, all of the therapeutic options, patients' characteristics, and MRI scan parameters had not changed throughout the period. Lastly, the patients diagnosed with unequivocal T3 or T4 on MRI were not included in our study, and this selection bias might influence the results. We believe that, under the condition of the analysis for relatively limited stage of the disease, MRI was a useful modality enabling prognostic prediction in the preoperative and non-invasive fashion. In this study, we found that MRI could evaluate the entire prostate gland more objectively than classical predictors such as DRE, and the additional information obtained with DWI could contribute to give the incremental value of MRI staging over the clinical predicting table for BCR.
In conclusion, the findings of ECE on T2WI and tumor visualization on DWI before treatment were important factors to predict BCR. The combined use of T2WI and DWI may have incremental value over the clinical variables and the preoperative clinical table to predict BCR for the patients with clinically localized prostate cancer who are candidates for RP.
Footnotes
ACKNOWLEDGEMENT
We cordially thank Professor Katsumi Yagi for his expert mathematical and statistical support.