
Abstract
Background
Direct comparison of different image reconstruction parameters to detect pulmonary embolism (PE) using 64-slice multidetector-row computed tomography (MDCT) is absent and the most accurate image reconstruction parameters have not yet been proven.
Purpose
To compare different image reconstruction parameters for detecting PE using 64-slice MDCT in patients suspected of having an acute PE.
Material and Methods
Forty patients who underwent pulmonary CT angiography with 64-slice MDCT for a suspected PE were included. Different image reconstruction parameters were used for each patient: axial and coronal images with slice thicknesses of 0.625 mm, 1.3 mm, and 2.5 mm and axial maximum intensity projection (MIP) images with slab thicknesses of 1.3 mm, 2.5 mm, and 5 mm. Four experienced radiologists reviewed the images. The diagnosis of a PE was based on consensus review of axial 0.625 mm slice thickness images by two chest radiologists with allowing multiplanar reconstruction. Accuracy and reproducibility (kappa value) were evaluated.
Results
In 15 of 40 patients, a PE was diagnosed. For detecting lobar PEs, axial images with a slice thickness of 1.25 mm and all coronal re-formatted images showed comparable results to axial images with a slice thickness of 0.625 mm. For detecting segmental PEs, axial images with a slice thickness of 1.25 mm and coronal images with a slice thickness of 0.625 mm re-formatted images showed comparable results to axial images of a slice thickness of 0.625 mm. For detecting subsegmental PEs, axial images with a slice thickness of 0.625 mm showed the highest sensitivity. Better reproducibility was obtained when the thinner slice thickness reconstructions were in axial and coronal images. However, reproducibility of MIP images with slab thicknesses of 2.5 mm and 5 mm was similar for detecting segmental and subsegmental PEs.
Conclusion
Thin-slice reconstruction of less than 1 mm is mandatory for visualization of PE at the subsegmental level.
Keywords
Since the introduction of multidetector-row computed tomography (MDCT) technology, visualization of peripheral pulmonary arteries and detection of small emboli have been significantly improved through thin-slice data-sets and use of multiplanar re-formatted (MPR) images. Now the clinical application of 64-row MDCT with submillimeter thin collimation is possible, resulting in nearly isotropic voxels fitted for reformation. An advantage of 64-row MDCT is faster scanning time, which results in decreased respiratory and cardiac motion compared with 16-row or 4-row MDCT.
However, when creating thin-slice data-sets and MPR images of the lung to visualize pulmonary arteries, the number of primarily acquired images rises significantly, thus influencing the time required for reading the CT images. Recently, various studies have focused upon which image reconstruction parameters are most accurate to detect embolic lesions of the pulmonary arteries (1–6). However, most papers reported results by using 16-slice CT (2–6). Reconstruction parameters for this testing vary from study to study. Thus, direct comparison of results of the existing studies is difficult.
The purpose of this study was to evaluate different image reconstruction parameters for their accuracy in detecting embolic lesions of the pulmonary arteries according to anatomic levels using 64-slice MDCT in patients suspected of having acute PE. Also, we evaluated the reproducibility of different image reconstruction parameters in the diagnosis of acute PE.
Material and Methods
Population
From February 16, 2008, to June 17, 2008, 47 consecutive patients were referred for MDCT because acute PE was suspected clinically. Of these 47 patients, seven patients were excluded because of previous histories of lung surgery. Consequently, 40 patients were included in the study (21 men and 19 women; age range 27–90 years; mean 64 years).
Image acquisition and analysis
For all patients, pulmonary CT angiography examinations were performed with a 64-slice MDCT (Lightspeed, VCT; GE Healthcare, Milwaukee, WI, USA) with a 0.35 s gantry rotation time. The acquisition protocol included 120 mL of contrast with 4 mL/sec (Iopromide, Ultravist 300; Bayer Schering Pharma, Berlin, Germany). Smart mA was used in all studies. Other parameters were 120 kVp, collimation 64 × 0.625 mm, covering a volume to include the entire chest in 6–10 s. Scan time delay was 25 s. The scan was performed in the caudocranial direction. From the CT raw data-sets, the following axial image reconstructions were created for each patient: slice thicknesses of 0.625 mm, 1.25 mm, and 2.5 mm, respectively. All axial images were transferred to an external workstation (Advantage Windows 4.3; GE Healthcare, Milwaukee, WI, USA). Maximum intensity projection (MIP) images were created with a slab thickness of 1.3, 2.5, and 5 mm, respectively, and coronal multiple planar reformation (MPR) images with slice thicknesses of 0.625 mm, 1.3 mm, and 2.5 mm. In summary, nine different image data-sets were re-formatted and evaluated for each patient.
Image interpretation
All images from 40 patients were loaded onto a workstation (Advantage Windows 4.3; GE Healthcare, Milwaukee, WI, USA) for interpretation. According to modification of commonly used nomenclature of the pulmonary tree and a scoring sheet outlined by Remy-Jardin et al., (7) two main, six lobar, 20 segmental, and 40 subsegmental arteries were evaluated in each data-set.
Four experienced chest radiologists (with 15, 10, 4, and 2 years of experience, respectively) independently reviewed images with different slice thickness. They were blinded to all clinical data and to the CT reports. Before image analysis, a training session was held for each reader to familiarize with the nomenclature and the image-reading strategy. The readers were allowed to use the scrolling stack mode for image interpretation and to manipulate the window width and level settings. The order of image reformations was randomized in all cases. Filling defects caused by a thrombus were defined as a positive result for a PE. In cases in which the pulmonary vascular segments were not sufficiently visualized for analysis, these vascular segments were counted as a negative finding regarding PE. We did not attempt to account for anatomic variants. In joint reading fashion, two radiologists (with 15 and 10 years of experience, respectively) reviewed axial images with a slice thickness of 0.625 mm for presence or absence of a PE. MPR images were available and used occasionally when initial joint readings were discordant. The consensus result was regarded as the reference standard. The institutional review board of our institute approved this study and informed consent was waived for this retrospective study.
Statistical analysis
Statistical analysis was performed using SAS, version 9.1 (SAS Institute, Cary, NC, USA). The axial images with a slice thickness of 0.625 mm reviewed in consensus by two chest radiologists were used as the reference standards to diagnose PE. According to the findings in the reference images, the sensitivity and specificity were calculated for all other data-sets. The number of images for each reconstruction parameter was recorded. Inter-observer agreement for the diagnosis of PE on different imaging parameters was assessed using kappa statistics. Comparisons of sensitivity, specificity, and reproducibility of different groups were performed by multiple comparisons test (Duncan's method). A P value less than 0.05 was considered to be statistically significant.
Results
Image number
The number of axial images with a slice thickness of 0.625 mm in a patient ranged from 409 to 593 (mean = 540 images), and those with a slice thickness of 1.25 mm and 2.5 mm ranged from 205 to 297 (mean = 270 images) and 103 to 143 (mean = 126 images), respectively. The number of coronal images with a slice thickness of 0.625 mm in a patient ranged from 232 to 393 (mean = 311 images), and those with a slice thickness of 1.3 mm and 2.5 mm ranged from 118 to 177 (mean = 151) and 60 to 97 (mean = 71), respectively. The number of MIP images with a slab thickness of 1.3 mm ranged from 169 to 263 (mean = 210 images), and those with a slab thickness of 2.5 mm and 5 mm ranged from 88 to 138 (mean = 111) and 47 to 70 (mean = 56 images), respectively.
Characteristics of the population and prevalence of acute PE
In 15 of 40 patients (38%), PE was diagnosed. Main complaints of patients were dyspnea (n = 24), leg pain (n = 10), chest pain (n = 4), cough (n = 3), general weakness (n = 2), edema (n = 2), headache (n = 2), hemoptysis (n = 2), fever (n = 2), shoulder pain (n = 1), and back pain (n = 1). Underlying diseases in the patients were malignancy (n = 11), heart disease (n = 9), fracture (n = 5), COPD (n = 4), hypertension (n = 11), diabetes mellitus (n = 5), renal failure (n = 2), intracranial hemorrhage (n = 2), systemic lupus erythematosus (n = 1), and hyperthyroidism (n = 1). Three of the 40 patients had no underlying disease. D-dimer was checked in all patients. D-dimer was elevated (>200 ng/mL) in 29, including all patients with acute PE. Deep vein thrombosis (DVT) was present in five patients, and all of them had acute PE.
The mean image quality scores in terms of the degree of vascular opacification, sharpness of vessel margin, and visibility of lung parenchyma were not different in patients with and without PE.
Among the 25 patients with no signs of PE, other diseases, such as pneumonia (n = 5), pleural effusion (n = 2), and malignancy (n = 1) were diagnosed.
Among 25 patients without PE, one-month follow-up data were available in 24 patients, and three-month follow-up data were available in 21 patients. In the one-month follow-up, one patient had died due to underlying malignancy (non-small cell carcinoma), the other patients were free of any signs or symptoms related with PE. In the three-month follow-up, another patient had died due to underlying malignancy (pharyngeal cancer) with septic shock, the other patients were free of any signs or symptoms related with PE. Otherwise, among the 15 patients with PE, three patients died within a month related to PE.
Accuracy and reproducibility of acute PE
The data evaluation was based on 40 × 9 data-sets (nine different re-formatted image data-sets per person) and a total of 40 × 9 × 68 vascular segments (68 different vascular segments of the pulmonary tree per data-set). The reference standard revealed 181 thrombotic lesions in 40 × 68 pulmonary segments. A main or lobar pulmonary embolism was identified in reference standard from 20% of the patients (n = 8). A segmental pulmonary embolism was identified in reference standard from 25% of patients (n = 10). A subsegmental pulmonary embolism was identified in reference standard from 30% of patients (n = 12).
For lobar pulmonary arteries, the sensitivity of the axial images with a slice thickness of 0.625 mm and the axial images with a slice thickness of 1.25 mm, and all coronal images were similar and ranged from 89.9 to 95.5. Kappa values were found to be 0.79–0.87. The sensitivity of axial images with a slice thickness of 2.5 mm and MIP images with a slab thickness of less than 2.5 mm ranged from 66.2 to 76.3, and kappa values were found to be 0.71–0.74. MIP images with a slab thickness of 5 mm showed the lowest sensitivity (66.2) with a kappa value of 0.63. However, the specificity of all images was similar and ranged from 98.5 to 99.5.
Regarding segmental arteries, axial images with a slice thickness of 0.625 mm (69.3) and axial images with a slice thickness of 1.25 mm (62.6) and coronal images with a slice thickness of 0.625 mm (62.7) showed the highest sensitivity. Coronal images with a slice thickness of 1.3 mm (60.9) and 2.5 mm (55.9) and MIP images with a slab thickness of 1.3 mm (52.8) and MIP images with a slab thickness of 2.5 mm (53.8) had a somewhat lower sensitivity. The group with the lowest sensitivity included axial images with a slice thickness of 2.5 mm (42.4) and MIP images with a slab thickness of 5 mm (44.4).
For subsegmental arteries, axial images of slice thickness of 0.625 mm showed highest sensitivity (43.8). Image reconstructions with other thicknesses showed a lower sensitivity. Axial images with a slice thickness of 2.5 mm showed the lowest sensitivity (16.9).
The specificity of subsegmental arteries ranged from 99.1–99.8, and was statistically different. Axial images with a slice thickness of 0.625 mm showed the lowest specificities (99.1), whereas axial images with a slice thickness of 2.5 mm, coronal images with a slice thickness of 2.5 mm, and MIP images with slab thicknesses of 2.5 mm and 5 mm showed the highest specificity.
Kappa values varied and ranged from 0.46 to 0.78. Axial images with a slice thickness of 2.5 mm and MIP images with a slab thickness of 5 mm showed the lowest kappa values.
All data are summarized in Table 1 and a case is presented in Fig. 1.
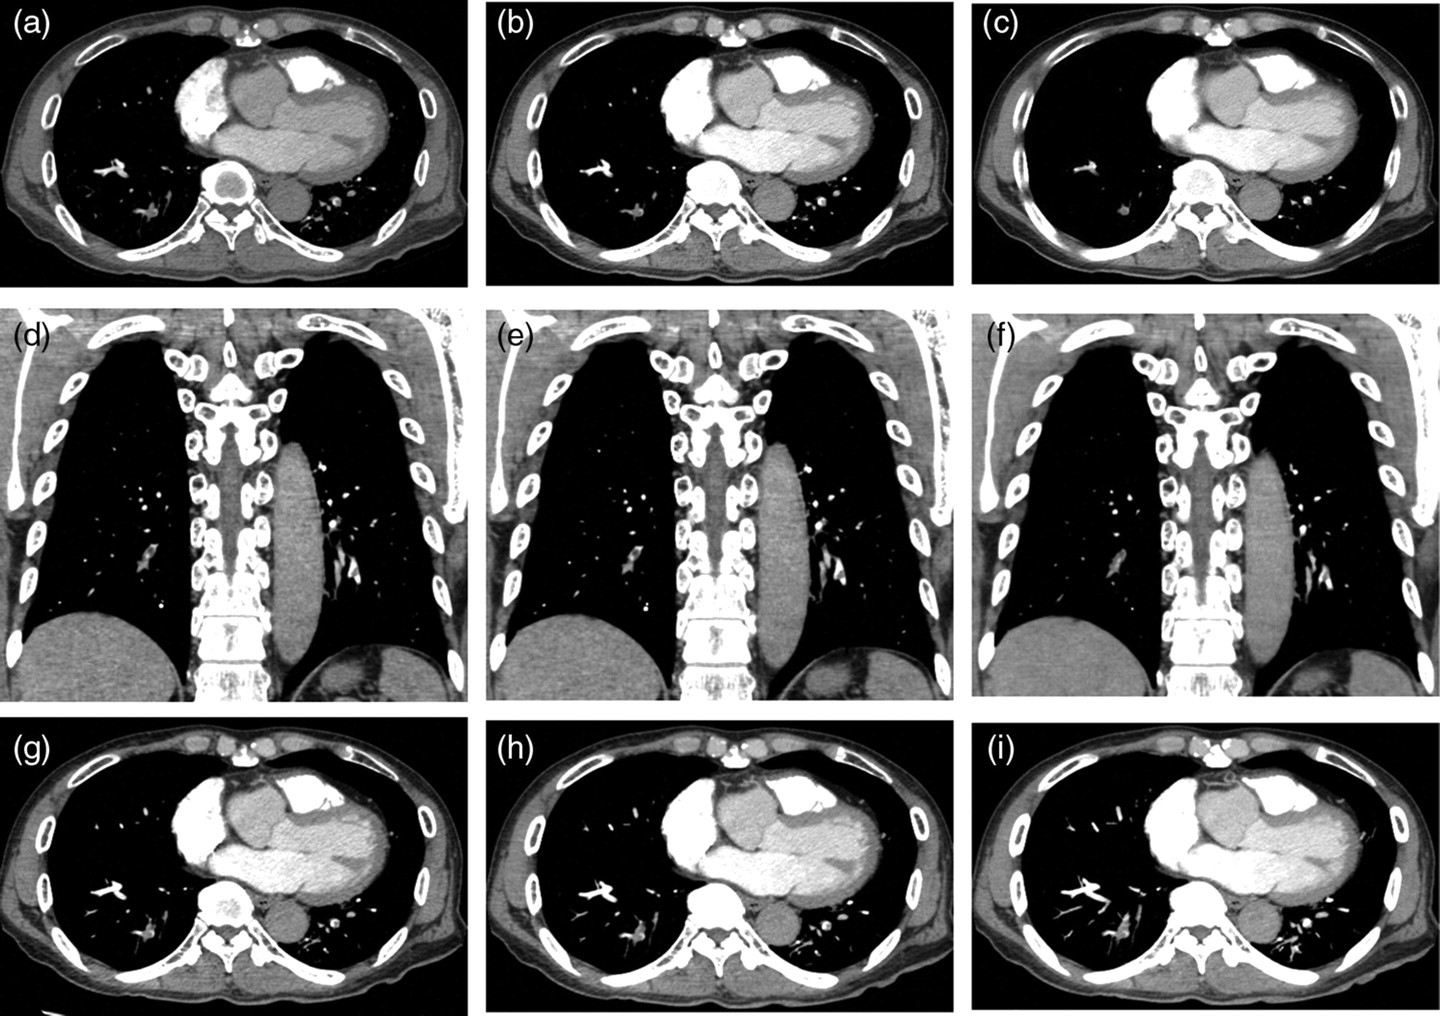
A 76-year-old male patient presents with acute emboli in both lower lobes. A focus on the segmental and subsegmental branches allows an adequate depiction of the emboli in both lungs in axial images with slice thicknesses (STs) of (a) 0.625 mm and (b) 1.25 mm. (c) However, axial images with a slice thickness (ST) of 2.5 mm are not sufficient to delineate the emboli in the left lower lobe. Coronal images with STs of (d) 0.625 mm, (e) 1.3 mm, and (f) 2.5 mm allow a clearer depiction of the embolic lesions in both lower lobes. Maximum intensity projection reformatted image with slab thicknesses of (g) 1.25 mm and (h) 2.5 mm enable the delineation of the emboli. However, MIP images with a slab thickness of (i) 5 mm fail to depict the emboli in the left lower lobe
Summary of statistical results of diagnosis of acute pulmonary embolism
Calculated by the ANOVA test
(A), (B), (C) = sensitivities and specificities identified by different letter (A, B, C) are statistically different by multiple comparisons (Ducan's method) test. For the lobar artery, specificities of each image are not different
Discussion
Conflicting results have been reported regarding which imaging reconstruction parameters are most accurate to detect PE. Heuschmid et al. (5) reported that in detecting segmental and subsegmental PEs, only axial images with a slice thickness of 2 mm proved to have results comparable with axial images with a slice thickness of 0.75 mm. Patel et al. (2) reported that MDCT at 1.25 mm collimation significantly improved visualization of segmental and subsegmental arteries. Jeong et al. (3) reported that 2.5 mm thick MIP images were found to provide satisfactory images compared to 1.25 mm thick axial images for the analysis of subsegmental pulmonary arteries in patients suspected of PE. However, most studies used 16-slice CTs, and the reconstruction parameters were different for each study. Thus, direct comparison of study results was difficult.
In the present study, different data reformations were evaluated regarding their accuracy and reproducibility to detect embolic lesions in patients suspected of having PE. To detect PE at the subsegmental level, axial images with a slice thickness of 0.625 mm showed the highest sensitivity. To detect PE at the segmental level, axial images with a slice thickness of 0.625 mm, axial images with a slice thickness of 1.25 mm, and coronal images with a slice thickness of 0.625 mm showed the highest sensitivity. Our results are similar to those of Patel et al. (2) in the aspect of axial images. The sensitivity of the MIP images regardless of slab thickness was not comparable to the highest sensitivity of axial images for detecting segmental and subsegmental PEs (3). As one might expect, the sensitivity was lower for smaller vessels. However, the specificity was similar regardless of the size of the vessels.
Reproducibility of 64-slice MDCT for detecting acute PE (inter-observer agreement; kappa value) shows higher agreement for the large lobar artery and lower agreement for segmental and subsegmental arteries in both axial and coronal images. Reproducibility of axial images with a slice thickness of 0.625 mm was comparable to those of axial images with a slice thickness of 1.25 mm and coronal images with a slice thickness of less than 1.3 mm. However, for MIP images, reproducibility varied, meaning that inter-observer agreement of the diagnosis of PE with MIP images was not constant.
Interestingly, accuracy and reproducibility of coronal re-formatted images with a slice thickness of 0.625 mm are similar to those of axial images with a slice thickness of 0.625 mm at the segmental artery level. Nishino et al. (6) reported that coronal reformation of the chest on 64-row MDCT were as informative as axial images for detection of main, lobar, and segmental pulmonary embolisms. They compared the 2 mm axial and coronal images for detection of PE with 64-row MDCT. Interpretation was concordant in 95% to 100% of cases for a main or lobar PE and in 80 to 82% of cases for a segmental PE. They concluded that concerning detection of PE, coronal images were superior but did not provide significant information affecting clinical management and showed one false-positive case. Vessels coursing vertical to the axial plane are more readily assessed with coronal re-formatted images than they are with axial images.
Although there has been an increasing consensus that image postprocessing is generally unnecessary for detecting acute PE in routine clinical practice (8) and that coronal reformation of pulmonary CTA should not be viewed merely as a complementary method, coronal re-formatted images are still attractive because of their high degree of accuracy using fewer images to achieve PE detection compared with thin axial images.
MDCT is known to be a reproducible method for the detection of PE (4). Our results revealed more detailed information; axial images with a slice thickness of less than 1.25 mm and coronal images with a slice thickness of less than 1.3 mm showed similar kappa values for detect segmental and subsegmental PEs. Those image qualities produced similar results independent of the radiologist who analyzed the images. Our results also recommend that when the incidental PE is seen on chest CT images with more than 1.25 mm slice thickness, it should be re-evaluated after reconstruction images with 1.25 mm slice thickness of axial images or less than 0.625 mm slice thickness of coronal re-formatted images.
There are several limitations of our study. The sensitivity for detecting PE in lobar and segmental artery is somewhat low in our study as compared with other reports. It might be due to disagreement on the interpretation of thrombi at the bifurcation area, anatomic variants of pulmonary arteries, and a larger number of interpreters. A second limitation is the small number of patients. However, about 1846 images of nine sets in each patient were made, and a total of 73,840 images were evaluated by each radiologist. So, it is not easy to expand the number of patients. A third limitation is that the diagnostic standard was consensus review of axial 0.625-mm slice thickness images by two chest radiologists with allowing multiplanar reconstruction. Although other methods such as pulmonary angiography had to be used as an alternative diagnostic standard, diagnostic pulmonary angiography is not performed in our hospital anymore; it is an inevitable limitation of clinical practice.
In conclusion, for the detection of lobar and segmental PEs, axial images with a ST of 1.25 mm and coronal images with a slice thickness of 0.625 mm and 1.3 mm are comparable to axial images with a slice thickness of 0.625 mm. For detection of subsegment PE, axial images with a slice thickness of 0.625 mm taken by 64-slice MDCT are most effective. Better reproducibility was obtained with a thinner slice thickness reconstruction for both axial and coronal images. Considering accuracy and reproducibility, thin-slice reconstruction of less than 1 millimeter is mandatory for visualization of PEs at the subsegmental level.