
Abstract
Background
Non-invasive MR imaging is expected to be used for accurate diagnosis and quantification of non-alcoholic steatohepatitis (NASH), because NASH is a progressive fatty liver disease. New MR techniques, such as fat fraction ratio (FFR) and T2* value measurement, have attracted an increasing attention, because those techniques can measure quantitative parameters of fibrosis, fat and iron deposition in the liver.
Purpose
To investigate the potential of FFR and T2* value in NASH with pre-enhancement, gadolinium-ethoxybenzyl-diethylenetriamine pentaacetic acid (Gd-EOB-DTPA) or super-paramagnetic iron oxide (SPIO)-enhanced MRI.
Material and Methods
Twenty-eight rats were divided equally into four groups (one control group and three NASH groups). All rats underwent unenhanced, Gd-EOB-DTPA, and SPIO-enhanced MRI. The T2* value of the liver was measured for each image sequence, and then changes in T2* values before and after each injection were analyzed using Dunnett's test. The reduction rate of T2* value before and 13 min after injection of Gd-EOB-DTPA or SPIO was analyzed using Mann-Whitney's U test. Moreover, FFR of the liver was measured before enhancement, and the relationship between fat fraction and the calculated fat area percentage on a pathological specimen was examined using Spearman's correlation test.
Results
On pre-enhancement, FFR and T2* value were 26.0% ± 12.0% and 21.5 ± 4.2 ms for all NASH groups, and 0.9% ± 0.5% and 30.8 ±−5.5 ms for control, respectively. Both FFR and T2* values were significantly different between the NASH and control groups. The reduction rate of T2* value was significantly lower in the NASH groups than in the control group on SPIO-enhanced MRI, though there was no significant difference on Gd-EOB-DTPA-enhanced MRI. FFR was correlated with the calculated fat area percentage for the pathological specimen.
Conclusion
Pre-enhancement FFR, T2* value measurement and reduction rate of T2* value on SPIO-enhanced MRI may help estimate the progress of liver fat deposition and fibrosis in NASH.
The increase in the prevalence of obesity has focused renewed attention on non-alcoholic fatty liver disease (NAFLD). In a small number of patients, NAFLD may evolve into more severe stages of liver disease, including non-alcoholic steatohepatitis (NASH) with or without fibrosis, cirrhosis, and occasionally hepatocellular carcinoma (1). NASH is recognized as a progressive fatty liver disease (2, 3), but the etiology of NASH is still unknown. NASH can be a cause of fatal outcome after major hepatectomy. Liver biopsy, the standard of reference for the assessment of NASH, is invasive and has sampling errors. Therefore, non-invasive imaging with liver-specific contrast agents and fat analysis by magnetic resonance imaging (MRI) are expected to be used for accurate diagnosis and quantification.
Identification and quantification of liver fat using MRI has been widely studied, and signal intensity loss on opposed-phase gradient echo T1-weighted images is frequently regarded as an accurate method for detection and quantification of liver fat. Ultrasonography and computed tomography (CT) can be used for the analysis of fatty liver infiltration, but they are not routinely used to quantify hepatic steatosis. Several analysis methods (4–6) using MRI have been discussed for the quantification of hepatic steatosis.
Quantitative analysis by T2* relaxometry has received increased attention in the area of MRI research. This T2*-weighted imaging (T2*WI) is based on a gradient-echo (GRE) sequence that is devoid of a re-focusing radio-frequency (RF) pulse and is more sensitive to field inhomogeneities (7). Previous studies have suggested a marked heterogeneity in iron distribution (8–10). In T2* relaxation, the cause of a loss of signal between in-phase and opposed-phase images must be taken into account. Those echo times are different and must be known for image interpretation and optimization, especially at a field strength of 3 Tesla (11). An accurate T2* value can assist in the assessment of iron content in the liver (12).
There are several reports that liver-specific MR contrast agent, such as super-paramagnetic iron oxide (SPIO), can increase detection sensitivity of hepatic tumors (13, 14). SPIO particles act as a negative contrast agent and cause local magnetic field inhomogeneity, resulting in considerable T2* shortening (15). SPIO uptake in Kupffer cells in the liver parenchyma is affected by liver function, therefore, the T2* shortening of the liver parenchyma on SPIO-enhanced MRI may make a prediction of degree of liver function (16). Tomita et al. (17) stated that SPIO-enhanced MR may help to identify NASH patients from patients suspected of having NAFLD.
While it is possible to evaluate liver function using T1-weighted gradient echo images with gadolinium ethoxybenzyl diethylenetriamine pentaacetic acid (Gd-EOB-DTPA) (18–20), Gd-EOB-DTPA not only shortens the T1 value, but also the T2* value of the liver. Gd-EOB-DTPA may also reveal the degree of liver damage as clearly as that seen using SPIO.
The benefits of 3 Tesla MRI have been established. A field strength of 3 Tesla allows for a higher signal-to-noise ratio (SNR), which can be traded for greater speed, higher spatial resolution, or both (21). Additionally, susceptibility (T2* shortening) effect of the gadolinium (Gd) based MR contrast media is enhanced on higher field MR system and contrast enhancement of the Gd can be increased.
Therefore, we used 3 Tesla MRI with Gd-EOB-DTPA and SPIO enhancement to investigate the potential of the T2* value measurement for the evaluation of NASH in the rat liver.
Moreover, the fat fraction ratios obtained by MR (FFR) based on a multi-echo gradient-echo T2* weighted sequence was compared with the fat area percentage on examination of pathological specimens. Thus, the aim of the present rat study was to investigate the possibility of using liver FFR and T2* values on T2*-weighted MRI to differentiate NASH from normal liver parenchyma.
Material and Methods
Animal model
All experimental protocols were approved by the responsible Animal Experiment Committee. Twenty-eight male Sprague-Dawley rats were divided into four groups. One group received a standard diet (control group or group 1). Three groups (groups 2, 3, and 4) were fed a choline-deficient diet (Dyets, Bethlehem, PA, USA; product No. 518753) for 4, 7, and 10 weeks, respectively (NASH groups). The diet contained the following components: 143.7 g/kg of amino acids, 100 g/kg of corn-starch, 100 g/kg of dextrin, 50 g/kg of cellulose, 406.7 g/kg of sucrose, 4.3 g/kg of sodium bicarbonate, 35 g/kg of salt mix, 10 g/kg of vitamin mix, 0.33 g/kg of ferric citrate, 100 g/kg of Primex, and 50 g/kg of corn oil. The mean weight of the control group was 407 ± 25 g. The mean weights of groups 2, 3 and 4 were 341 ± 12 g, 355 ± 14 g, and 346 ± 11 g, respectively.
Magnetic resonance imaging (MRI)
All MRI examinations were performed under anesthesia using 64.8 mg/mL of pentobarbital sodium (Somnopentyl, Kyoritsu Shoji Co., Tokyo, Japan) injected intraperitoneally. Approximately 0.3 g/kg of subcutaneous urethane (Tokyo Kasei Kogyo Co., Tokyo, Japan) was added when needed for additional anesthesia. During the entire study period, all rats were maintained under specific pathogen-free conditions at 22 ± 2°C with 12 h of artificial lighting from 7 AM, and were fed with chow pellets and water ad libitum.
Gd-EOB-DTPA (Primovist®, Bayer Schering Pharma AG, Berlin, Germany; 0.025 mmol Gd/kg, 0.25 mol/L) and ferucarbotran (Resovist®, Bayer Schering Pharma AG, Berlin, Germany/FUJIFILM RI Pharma Co.,Ltd, Tokyo, Japan; 8 µmol Fe/kg by decuple dilution, 0.5 mol/L) as SPIO were injected into the rat tail vein at intervals of 24 h (day 1, Gd-EOB-DTPA; day 2, SPIO).
All rats underwent MRI with a 3-Tesla MRI unit (Achieva 3.0T Quasar R2.5.3, Philips Medical Systems, Best, The Netherlands) before and after the administration of contrast agents. Multi-echo in- and out-of-phase MR imaging and T2* measurements were performed. T2*-weighted multi-echo fast field echo images (mFFE; TR 209; TE 2.3; ΔTE 1.15; echo number 24; flip angle 30°; field of view 150 mm; matrix size 96 × 96; pixel resolution 1.56 mm; acquisition time 21 s; no respiratory gating; slice thickness 3 mm) were obtained before and after injection of contrast medium (every 2 min from 3 to 13 min) using a knee 8-channel coil and sensitivity encoding (SENSE). Shorter ΔTE was used to avoid the T2* shortening effect of iron deposition.
Histologic analysis
After MRI examination, all rats were sacrificed by deep anesthesia with diethyl ether. The rats' livers were removed and subsequently fixed in phosphate-buffered 10% formalin. The right lobe of the liver was divided into two sections at the long middle line, and sections were embedded in paraffin blocks. A section from each paraffin block was stained with hematoxylin and eosin (HE) to observe pathologic structures or with sirius-red to evaluate liver fibrosis. The measured percentage of fat area, based on a threshold for histologic liver sections, was obtained using WinROOF image processing software (Mita Corp., Tokyo, Japan). The fat area percentage of the pathological specimen was calculated as fat area/whole area × 100.
Imaging analysis
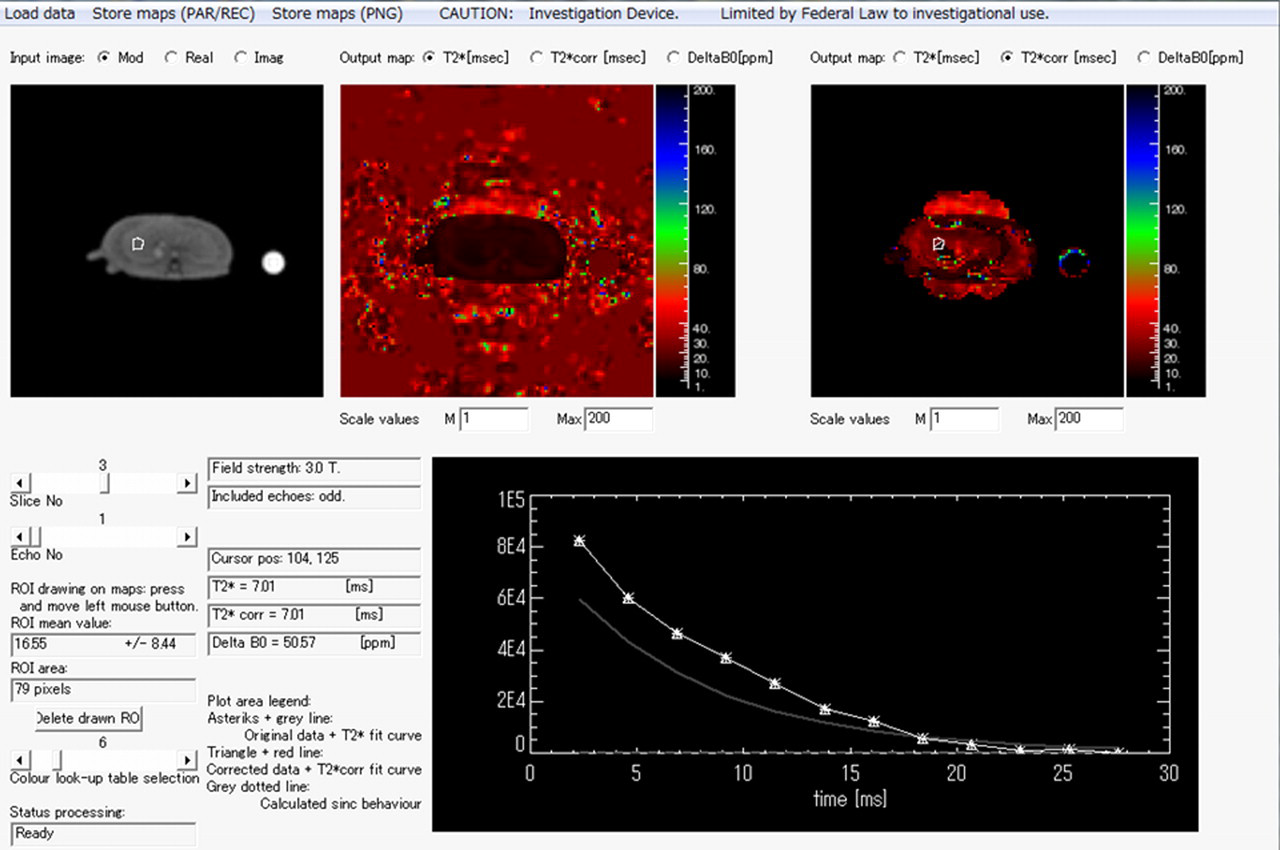
Philips Research Integrated Development Environment (PRIDE; Philips Electronics Medical Systems, Best, The Netherlands) software written in Interactive Data Language was used for imaging analysis (Fig. 1). For T2* value assessment of multi-echo gradient-echo images in the liver, regions of interest (ROIs) within the liver were drawn manually. A ROI (50–100 pixels) was placed on a homogeneous area of liver parenchyma for each slice. The evaluation of a representative liver T2* value was performed by fitting an appropriate model to the signal decay within the ROIs. The global liver T2* value was evaluated using a pixel-wise technique and optimized signal decay model, which was introduced in a previous report (22). The T2* value was determined using 3 regions taken from 3 slices of the right lobe of each rat liver and then area-averaged using an optimized signal decay model. An exponential curve fitting model was used for the analysis. T2* values were compared with the results of the histopathology. Reductions in the rate of the T2* value between pre- and post-Gd-EOB-DTPA or SPIO enhancement were measured for the control group and all NASH groups using the following equation:
T2* value was measured using a research software. This T2* Philips Research Integrated Development Environment (PRIDE) software was written in Interactive Data Language for imaging analysis. A ROI (79 pixels) was drawn on maps and T2* fitting curve of liver parenchyma was obtained as this figure (T2* value = 16.6 ms, for NASH 7W of SPIO enhanced MRI at 7 min)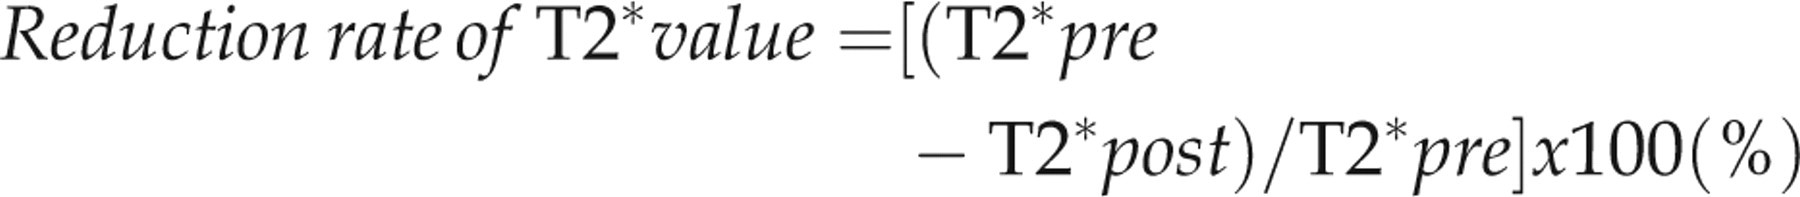
The liver FFR on the T2*-weighted image sequence was measured before enhancement. Thus, the FFR was calculated from the following equation (23):

To investigate the relationship between FFR and histologic grade, the FFR and the fat area percentage calculated by histological analysis were compared.
Statistical analysis
Dunnett's test, as a multiple comparison procedure, was used to evaluate the differences in the T2* values of the liver parenchyma on each scan, both pre- and post-contrast injection. The reduction rate of the T2* value before and after contrast administration was analyzed by Mann-Whitney's U test. The FFR on MRI and the fat area percentage of the pathological specimen were compared by Spearman's correlation test. The Statistical Package for Social Science Programming (version 11.0; SPSS, Chicago, IL, USA) was used for analysis. A P value less than 0.05 was considered significant.
Results
Diffuse macrovesicular steatosis and mild fibrosis were observed histologically in all NASH groups; no steatosis was observed in the control group (Figs. 2 and 3). Within the NASH groups, group 2 showed steatosis without fibrosis, and groups 3 and 4 showed steatosis with slight or only mild fibrosis.
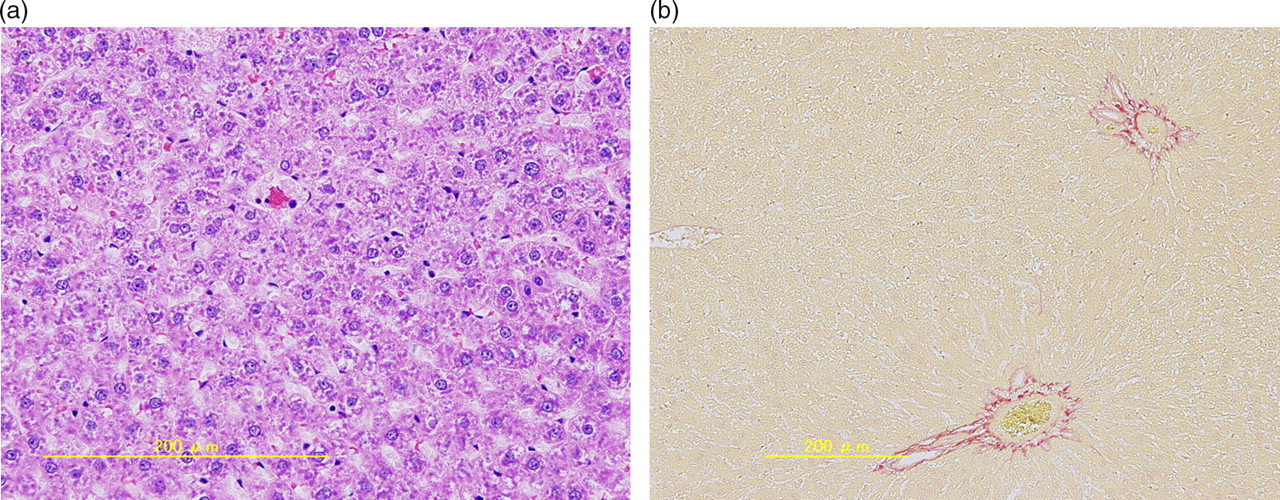
Histologic sections of the control group by hematoxylin-eosin stain (a) and sirius-red stain (b). There was rare fibrosis in the control group
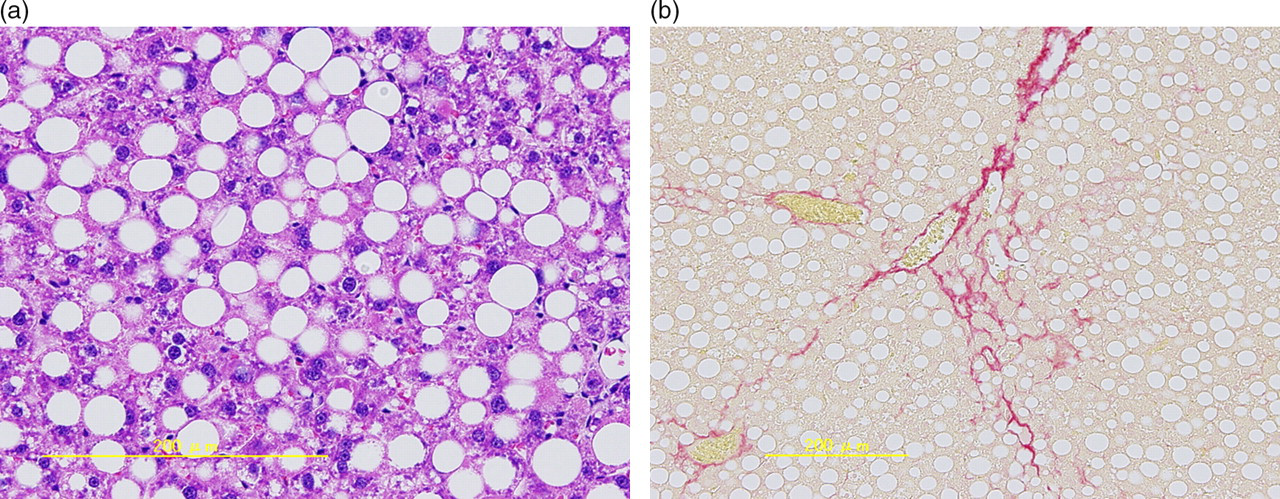
Histologic sections of NASH by hematoxylin-eosin stain (a) and sirius-red stain (b). Diffuse macrovesicular steatosis and mild fibrosis were observed in all NASH groups. There was no heterogeneous distribution of macrovesicular steatosis and fibrosis in the NASH livers
T2* value of the liver parenchyma on pre-enhancement for control and NASH groups
On pre-enhancement, the mean T2* value of all controls was 30.8 ± 5.5 ms, whereas that of all NASH groups was 21.5 ± 4.2 ms. Thus, the T2* value was shorter for all NASH groups than for the control group (P < 0.05) (Tables 1 and 2).
T2* value of liver parenchyma for control and NASH in Gd-EOB-DTPA (units are in milliseconds)
Gd-EOB-DTPA = gadolinium ethoxybenzyl diethylenetriaminepentaacetic acid, Pre = Pre-enhancement, Control = Control with standard diet, NASH = Non-alchoholic steatohepatitis, 4W = 4 weeks with choline-deficient diet, 7W = 7 weeks with choline-deficient diet, 10W = 10 weeks with choline-deficient diet
T2* value of liver parenchyma for control and NASH in SPIO (units are in milliseconds)
SPIO = super-paramagnetic iron oxide, Pre = Pre-enhancement, Control = Control with standard diet, NASH = Non-alchoholic steatohepatitis, 4W = 4 weeks with choline-deficient diet, 7W = 7 weeks with choline-deficient diet, 10W = 10 weeks with choline-deficient diet
T2* value of the liver parenchyma after Gd-EOB-DTPA injection for control and NASH groups
The T2* values of the control livers were significantly shorter at each time point after Gd-EOB-DTPA injections (Table 1) than the unenhanced T2* values of the control livers. In addition, a substantial plateau pattern was observed (Table 1) from 3 to 13 min. The T2* values of all NASH group livers were also slightly decreased after Gd-EOB-DTPA injection, but there was no significant difference between pre- and post-contrast injection. Reductions in the T2* value of the liver were not significant between the control and all NASH groups (Table 3). The T2* values of the NASH livers were significantly shorter than those of the control group before enhancement (P < 0.05), and the T2* values after Gd-EOB-DTPA injection were also shorter in all NASH groups than in the control group (Table 1).
Reduction rate of T2* value of the liver for control and NASH

Gd-EOB-DTPA = gadolinium ethoxybenzyl diethylenetriaminepentaacetic acid, SPIO = super-paramagnetic iron oxide, Control = Control with standard diet, NASH = Non-alchoholic steatohepatitis, 4W = 4 weeks with choline-deficient diet, 7W = 7 weeks with choline-deficient diet, 10W = 10 weeks with choline-deficient diet, NS = Not significant, S = Significant
T2* values after SPIO injection for control and NASH groups
After SPIO injection, the T2* values of the liver for all NASH groups decreased significantly; thereafter, a substantial plateau pattern was observed from 3 to 13 min (Table 2). The control group showed a stronger decrease in T2* values than the NASH groups, as well as a plateau pattern after SPIO injection (Table 2). In other words, the reduction rate was greater in the control group than in the NASH groups (P < 0.05, Table 3). The T2* value of the liver showed characteristic stronger shortening in the control than in the NASH groups at all time points after SPIO injection.
The relationship between histologic grade and the fat fraction ratio obtained by MR (FFR)
The FFRs for the control and NASH (4-weeks, 7-weeks, 10-weeks) groups were 0.9% ± 0.5% and 26.0% ± 12.0% (31.4% ± 4.3%, 25.1% ± 8.0%, 19.2% ± 10.4%), respectively. FFR was significantly different between all NASH groups and control (P < 0.05). A higher correlation between FFR and histologic grade (fat percentage by area
Discussion
In the present study, the evaluation of a representative liver T2* value was performed by fitting an appropriate model to the signal decay within the ROI. This was based on a technique described by Dahnke et al. (22), in which the B0-field was calculated from multi-echo FFE data, and the effect of signal loss from B0 changes in the Z-direction was estimated (TE-dependent signal attenuation in the shape of a sync function). This tool thus creates a better quantitative measure for T2*. Close agreement between FFR and the fat percentage on a pathological specimen was demonstrated for the quantitative assessment of liver steatosis.
It is important to understand how the choice of the analysis methodology may affect the accuracy of T2* measurements, because the resulting T2* value may depend on both ROI placement and choice of the signal decay model. In particular, the global T2* value of the liver was evaluated using a pixel-based technique and optimized signal decay model. Posinano et al. (9) stated that an ROI-based approach is acceptable for T2* analysis. In fact, the T2* value allows exploration of a multi-echo technique and enables faster data acquisition for use on the beating heart (8, 10). Therefore, we believe that the T2* value is a promising non-invasive diagnostic tool for the evaluation of liver disease.
MR spectroscopy (24) and T2* iterative decomposition of water and fat with echo asymmetry and least-squares estimation (IDEAL) (25) are currently in clinical use for noninvasive liver fat content measurement. MR spectroscopy cannot allow T2* mapping of the entire liver, because of volume of interest alone. IDEAL has possibilities for T2* evaluation, but we could not use IDEAL in this study. In the future, these methods should be compared to the present method for non-invasive fat measurement.
Elias et al. evaluated the correlation between MRI findings and Mayo End-Stage Liver Disease (MELD) score (26). Their report showed that there was no statistically significant correlation between the MRI findings and MELD score. Whereas, MRI findings of liver steatosis and fibrosis in NASH showed moderate correlations with histopathologic grades of steatosis and stages of fibrosis. Their method of MRI analysis which is based on dual phase T1-weighted images is different from ours; however, we should take notice of their result in patients of NASH.
Bydder et al. investigated R2* (1/T2*) value for the assessment of liver fat quantification (27). They showed that the over-estimation of fat fraction by monoexponential decay is weaker than that of biexponential decay. The fitting method in their report is almost the same as our method, because they analyzed fat fraction and T2* value by using 3 point fitting. Our methodology follows on from a previous report (28), we believe that accurate estimation of fat fraction accounting T2* decay is possible using our method.
Gd-EOB-DTPA is known as a contrast agent that is partially taken up by hepatocytes, yielding positive, sustained enhancement of the liver parenchyma on T1-weighted images. Tsuda et al. (18) reported that Gd-EOB-DTPA is a T1-shortening contrast agent that enables differentiation between NASH and fatty liver by evaluating the signal intensity time course (time of maximum relative enhancement and half-life of relative enhancement). Gd-EOB-DTPA also shortens the T2* values of enhanced tissue. From the results of Gd-EOB-DTPA-enhanced MRI, the T2* values of the liver for NASH showed no significant change before and after contrast enhancement. On the other hand, the T2* values of the liver for the control subjects before and after Gd-EOB-DTPA enhancement were significantly different at all time points after injection. This suggests that decreased hepatocyte function in NASH liver prevents uptake of Gd-EOB-DTPA, and therefore, only a small T2*-shortening effect was observed. This result may be enough to differentiate between controls and NASH; however, further research with larger numbers of animals is needed.
In our study, each T2* weighted image was obtained using a 2-min interval. For this time limit, the T2* sequence is better than the T2 spin echo sequence. A high signal-to-noise ratio can be obtained with 3-Tesla MRI, but our T2* analysis software can overcome the inhomogeneous magnetic field, resulting in an accurate T2* value. When fast spin echo is used, artifacts may occur due to the magnetization transfer contrast (MTC) effect. The breath-holding sequence is better for liver imaging, and the T2*-weighted sequence is better in this situation. Free breathing would likely be an issue in patients, although no apparent respiratory artifacts were encountered in our rat study.
SPIO accumulates in the liver parenchyma containing Kupffer cells, and fibrotic bands are seen as hyperintense foci. This technique is reported to improve sensitivity for detecting hepatic fibrosis (29). Therefore, it would be useful to compare the present T2* value analysis with fibrotic bands on SPIO-enhanced MRI.
In the pathogenesis of NASH in animal models, a concomitant decrease in the phagocytic activity of Kupffer cells appears to be important (30, 31). Recent data suggest that Kupffer cell dysfunction in the reticuloendothelial system contributes to the pathogenesis of NASH (32). Duman et al. stated that blood pool clearance time may be prolonged in 32% of patients with NASH because of reticuloendothelial system dysfunction (33). Colloid scintigraphy is a useful method for evaluating Kupffer cell activity, but the spatial resolution of scintigraphy is lower than that of SPIO-enhanced MRI. SPIO particles are phagocytosed by Kupffer cells in the liver, resulting in negative enhancement of the liver parenchyma on T2*-weighted images (34). The present data of the T2* values after SPIO injection suggest that Kupffer imaging by SPIO reflects the Kupffer cell dysfunction in NASH. Therefore, decreased phagocytic activity in the liver may be a sensitive marker of the progression to NASH. In previous reports, other liver damage was evaluated by SPIO-enhanced MR imaging in rats, specifically liver cirrhosis (35) and an ischemia-reperfusion model (16). Based on those results, future studies using SPIO should be performed to differentiate between NASH and fatty liver/liver cirrhosis.
FFR was also useful to differentiate NASH from controls in our rat study. However, the most important clinical demand is to differentiate NASH from NAFLD in patients. Therefore, further analysis in regard to lipid quantification between NASH and NAFLD should be performed in the future.
Our study had the following limitations. First, Kupffer cell staining was not assessed. On the basis of previous reports, we chose to evaluate the fibrotic rate; however, Tanimoto et al. (13) stated that decreased phagocytic activity in the cirrhotic liver is more likely due to Kupffer cell dysfunction than to Kupffer cell depletion. Second, regarding respiratory gating, our study may have limitations such as misregistration. Liver T2* mapping and fat fraction analysis were evaluated based on an organ with homogeneous MRI signal intensity. There was no heterogeneous distribution of fatty deposits and fibrosis in the NASH livers on pathology. Finally, Gd contrast agents not only have a T1-shortening effect but also a T2*-shortening effect, although their T2*-shortening effect is less than that of ferucarbotran. Gd-EOB-DTPA-induced signal intensity reduction of liver is caused by the T2*-shortening effects of Gd-chelate in Gd-EOB-DTPA because of highly specific uptake by hepatocytes (36). It is well-known that a high concentration of Gd can allow signal decay in T2*-weighted sequences based on increased T2* effects (37). On T2*-weighted images, increased signal intensity in the liver and hepatic vessels may be caused by rapid recovery from MT saturation in fast field echo sequences with multiple, rapidly repeated, refocusing pulses due to the T1 shortening effect of Gd-EOB-DTPA.
In conclusion, FFR, T2* value measurement and reduction of T2* values after SPIO injection can objectively quantify fat deposition in vivo and has the potential to serve as a non-invasive biomarker in the early detection and quantitative assessment of NASH.
Footnotes
Acknowledgement
Philips Electronics Medical Systems supplied the software for signal intensity analysis. Bayer Yakuhin, Ltd. supplied all contrast agents for our study. We thank Shigehiro Arita MD, Jun Ikemoto RT in Manryokai Imaging Clinic, Mitsuyo Matsumoto, Nozomu Koyama, Akihiro Kakimoto in Philips Electronics Medical Systems, Takashi Tsuji, Seiji Uyama in Bayer Yakuhin, Ltd., and Takayuki Nakatsuka RT in Kinki university hospital for supporting our study.