
Abstract
Background
Patients suffering from hereditary hyperlipidemia have a high risk for premature cardiovascular disease and death as a consequence of accelerated atherosclerosis.
Purpose
To prospectively and intra-individually compare image quality and detectability of stenoses in contrast enhanced whole-body MRA (WBMRA) at 1.5 and 3 Tesla (T) in patients with hereditary hyperlipidemia.
Material and Methods
Twenty-seven patients with hereditary hyperlipidemia received a 1.5 and 3 T gadopentetate dimeglumine contrast-enhanced WBMRA. Twenty-three defined arterial segments were analyzed regarding depiction of target vessels and image quality according to a 5-point-scale (‘not evaluable’ to ‘excellent’). Wilcoxon matched pair test was performed for comparison. Forty-three defined arterial segments were analyzed for the degree of stenosis (0%, 1–49%, 50–99% and 100%) as well as vessel alterations such as aneurysms. Chi-square test was performed for comparison.
Results
1.5 T and 3 T scans yielded WBMRA with diagnostic quality in all patients. In seven of 23 arterial segments (30.4%) image quality was rated significantly higher at 3 T, whereas there was no significant difference in the remaining 16 segments between WBMRA at 1.5 T and 3 T. All relevant stenoses (n = 5), occlusions (n = 6), and aneurysms (n = 3) were evaluated similarly at both field strengths.
Conclusion
WBMRA can be performed at 1.5 T and 3 T with diagnostic image quality. Image quality was significantly higher at 3 T than at 1.5 T in only 30.4% of the arterial segments. In order to effectively take advantage of the higher field strength, further optimization of sequence parameters and injection protocols for WBMRA at 3 T is necessary.
Inherited hyperlipidemia with an average global prevalence of one in 500 individuals, is one of the most frequent inherited metabolic disorders (1). Patients suffering from hereditary hyperlipidemia have a high risk for premature cardiovascular disease and death as a consequence of accelerated atherosclerosis (1, 2). Atherosclerosis is a systemic disease of the arterial vessel wall that predominantly affects the aorta, carotid, coronary, mesenteric, renal, or peripheral arteries and mainly occurs in the medium- and large-sized arteries. The subsequent thrombotic and thromboembolic complications are the main cause of mortality and morbidity in industrialized countries (2).
Therapeutic decision-making depends on the accurate classification of atherosclerotic disease with regard to the location, extent, and severity of arterial involvement. For this purpose, several imaging modalities, including conventional catheter angiography, duplex ultrasound, as well as CTA and MRA are in clinical use (3). Digital subtraction catheter angiography (DSA) is considered the diagnostic gold standard. However, DSA is an invasive method associated with different complications and risks, implies radiation exposure, and is generally focused on segmental parts rather than the entire vasculature. The lack of ionizing radiation in conjunction with high diagnostic accuracy has led to the acceptance of MRA as the modality of choice for assessing arterial disease (4).
Whole-body magnetic resonance angiography (WBMRA) is a contrast-enhanced method, which is a feasible and sensitive tool for screening for atherosclerotic lesions in large- and middle-sized arteries (5). Scanning the entire arterial tree, except the coronary arteries, is feasible in a single WBMRA examination without the risks involved in ionizing radiation or arterial cannulation (6, 7). In contrast to imaging strategies focused on the peripheral vasculature alone, the WBMRA approach documents additional clinically disease in so far unsuspected arterial territories (8).
Previous studies have proven the feasibility of contrast- enhanced WBMRA at 1.5 Tesla (T) (8, 9) and at 3 T (10, 11). The purpose of this study was to prospectively and intra-individually compare image quality and diagnostic value focused on atherosclerotic lesions of contrast- enhanced WBMRA at 1.5 and 3 T in patients with hereditary hyperlipidemia.
Material and Methods
Patients
The local ethics committee approved the study and written informed consent was obtained from all patients. MR exams were performed between July 2006 and April 2007. Patients had been evaluated for lipid disorders in the Department of Internal Medicine, Section for Metabolic and Hormone Disorders of our University hospital. Inclusion criteria for the patients participating in the study were type III hyperlipoproteinemia according to the Fredrickson classification (Apolipoprotein (Apo) E 2/2) or familial defective Apo B-100 Hyperlipidemia (Apo B 3500 mutation). Genotyping of Apo E and Apo B 3500 were done by standard methods. Exclusion criteria for the study were secondary hyperlipidemia, heart failure NYHA III or IV, unstable coronary heart disease, claustrophobia, metallic implants or implanted electronic devices and renal insufficiency, with an estimated glomerular filtration rate below 30 mL/min based on gender, age, race, and serum creatinine level.
MR imaging
In all cases, the time span was two weeks between MR scanning at 1.5 T and 3 T for the single patient. The 1.5 T scanner (Achieva, Philips Medical Systems, Best, The Netherlands) had a 33 mT/m maximum gradient amplitude and a maximum slew rate of 180 mT/m/s, whereas the 3 T scanner (Intera, Philips Medical Systems, Best, The Netherlands) had a 30 mT/m maximum gradient amplitude and a maximum slew rate of 150 mT/m/s. Multistation WBMRA was performed in supine position with mounted table extension to cover the entire lower extremities without the use of blood-pressure cuff venous compression at the lower legs. Imaging was performed at both field strengths with the integrated body-coil. The 3 Tesla Magnet has a more limited field of view in the feet–head direction. As a consequence, we used six stations to cover the whole body at 3 Tesla compared to four stations at 1.5 Tesla. WBMRA at 1.5 T was divided into the following four stations: (a) thoracic aorta, supra-aortic vessels; (b) abdominal aorta including renal and pelvic arteries; (c) thighs; and (d) the lower legs including the ankles. WBMRA at 3T was divided into six stations: (a) thoracic arch and supra-aortic vessels; (b) thoracic and abdominal aorta including the renal arteries; (c) lower abdominal and pelvic arteries; (d) proximal thighs; (e) distal thighs and proximal lower leg; and (f) distal lower leg to ankles. An overlap of several centimeters was applied between each station. All relevant sequence parameters are presented in Table 1.
Sequence parameters of WBMRA at 1.5 and 3 T
Pre-contrast images of each station were acquired for masks. In order to determine optimal contrast timing, a 2 mL test-bolus of gadopentetate dimeglumine (0.5 mmol/mL) (Magnevist®, Bayer Health Care, Leverkusen, Germany) was injected at a rate of 1.5 mL/s followed by 8 mL saline at a rate of 1.5 mL/s and 15 mL saline at a rate of 0.7 mL/s into a cubital vein using a dedicated power injector (Spectris Solaris EP, MEDRAD, Warrendale, PA, USA). A dynamic 2D scan covering the descending aorta was performed. From this data-set the time from injection of the contrast agent into the antecubital vein to its arrival in the proximal descending aorta was measured.
Contrast injections were performed in two steps applying a biphasic injection strategy (12): In the first step an intravenous bolus of gadopentetate dimeglumine (10 mL at rate of 1.5 mL/s, then 10 mL at a rate of 0.7 mL/s followed by 25 mL saline at a rate of 0.7 mL/s) covered the stations 2–4 at 1.5 T and 2–6 at 3 T, respectively. Scanning of the thoracic aorta was performed in breath hold following deep expiration to avoid breathing artifacts. In the second step, station 1 was scanned after a delay of at least 10 min to allow washout of the first contrast bolus. Patient repositioning was not necessary. The second bolus consisted of 15 mL gadopentetate dimeglumine injected at a rate of 2 mL/s and followed by 25 mL saline at a rate of 2 mL/s. Altogether, each patient received 37 mL of gadopentetate dimeglumine per WBMRA, which corresponds to 0.23 mmol/kg for an average patient of 80 kg.
Image postprocessing included creation of coronal subtracted source images and re-formatting into three-dimensional (3D) maximum intensity projection (MIP) images. Whole-body fusion images were constructed as well.
MR image evaluation
Anonymized images of the 1.5T and 3T WBMRA were presented to two experienced radiologists (17 years of cumulative experience) in random order for consensus reading.
For detailed evaluation of stenosis the arterial tree was divided in 43 segments as displayed in Table 2. The degree of stenosis of each of the 43 arterial segments was evaluated according to a 4-point-scale: normal (0 %), low-grade stenosis (1–49%), high-grade stenosis (50–99%) and occlusion (100%). Furthermore, incidental findings were documented.
Detailed listing of detected stenoses WBMRA at 1.5 and 3 T
R = right; L = left
For detailed evaluation of image quality the arterial tree was divided in 23 segments as displayed in Table 3. Of the primarily defined 43 arterial segments, all anatomically symmetric arterial segments were evaluated conjointly, giving 23 graded segments. The 23 segments were evaluated according to a 5-point scale regarding contrast, artifacts, depiction of all target vessels and venous overlay: 5 = excellent image quality; 4 = good diagnostic quality; 3 = moderate image quality, adequate for diagnosis; 2 = poor image quality, partially non-diagnostic; 1 = non- diagnostic.
Evaluation of segment-specific image quality of WBMRA at 1.5 and 3 T
*Statistically significant
Statistical analysis
Comparisons of image quality of the defined 23 arterial segments determined for image quality rating at 1.5 T and 3 T were performed using the Wilcoxon matched pair test.
The numbers of segments with normal vessel anatomy and vessels with different grades of stenosis were determined for the 43 defined vessel segments in each of the 27 patients at both field strengths. Chi-square test was performed to test for difference in the incidence of segments with (a) normal vessel anatomy (0%), (b) low-grade stenosis (1–49%) or (c) high-grade stenosis (50–99%) and (d) occlusion (100%) at 1.5 T and 3 T examinations. P values <0.05 were considered statistically significant. Statistical analysis was performed using commercially available software (MedCalc for Windows, Mariakerke, Belgium). Data are presented as mean ± standard deviation.
Results
Thirty patients were initially enrolled. WBMRA was successfully completed in 27 patients (90%) at both field strengths (18 men and nine women, median age 56 years, range 30–68 years). In two patients large abdominal aortic aneurysms with diameters of 57 mm and 62 mm, respectively, were discovered at the first WBMRA scan and immediate treatment with interventional catheter angiography and graft implantation was initiated. One patient refused to undergo a second scan due to claustrophobic discomfort.
Of the 27 presented patients, none reported discomfort during or after WBMRA. No allergic or adverse reactions were seen following administration of the MRI contrast agent. All patients suffered from hereditary hyperlipidemia, 14 patients suffered from type III hyperlipoproteinemia (Apolipoprotein (Apo) E 2/2,) and 13 from familial defective Apo B-100 Hyperlipidemia (Apo B 3500 mutation). Mean serum lipid values (mg/dl; ± standard deviation [SD]) in the Apo E 2/2 patients were: cholesterol: 441 ± 181 mg/dl, triglycerides: 547 ± 239 mg/dl. Mean serum lipid values (mg/dl; ± SD) in the Apo B 3500 patients were: cholesterol: 296 ± 49 mg/dl, triglycerides: 119 ± 55 mg/dl. Type II Diabetes was documented in one patient; the mean body mass index (BMI) was 27 ± 3.9 kg/m2. Arterial hypertension was present in seven patients and nicotine abuse in five patients.
Image quality
1.5 T and 3 T scans yielded WBMRA with diagnostic quality in all 27 patients. Comparison of the image quality scores for 1.5 T and 3 T revealed that the delineation of anatomical details of the pelvic, femoral and popliteal arteries was more defined at 3 T as demonstrated in Fig. 1. For these seven (30.4%) of the 23 defined arterial segments, image quality was rated significantly higher if WBMRA was performed at 3 T (Table 3, segments 24–37) (p = 0.002 to 0.035).

Example of WBMRA acquired at 1.5 T (A) and 3 T (B) of a 40-year-old male patient without any pathologic findings. Four sequential stations were used for WBMRA at 1.5 T and six sequential stations were used at 3 T. Locations of the stations are placed adjacent to the WBMRA images. Note venous overlay of the lower legs in both examinations and field inhomogeneity artifacts of the abdominal part at 3 T
No statistically significant difference was found for the evaluation of the 16 remaining arterial segments (Table 3, segments 1–23, 38–43) (p = 0.1–0.98).
Segment-based evaluation of image quality revealed venous overlay in the cervical region (segments 1–6, 13, 14) and lower leg (segments 28–43), resulting in a less pronounced difference of image quality between the two field strengths (nine cases [33%] at 3 T and three [11%] at 1.5 T) (Table 3, Fig. 1). No statistically significant difference of image quality of abdominal arterial segments (segments 18–23) was found (p = 0.24–0.68). This is explained by deteriorated image quality of the abdominal part due to field inhomogeneity artifacts that occurred in 16 (59%) 3 T WBMRA scans (Fig. 1). Particularly the renal arteries (segment 22, 23) and the superior and inferior mesenteric arteries (segment (20, 21) were affected (Table 3). This shading artifact was not observed at 1.5 T.
Depiction of vessel segments and grading of stenosis
A total of 1161 defined arterial segments in 27 patients were scanned with WBMRA. All 1161 arterial segments (100%) were detected at both field strengths. The majority of all segments was rated normal (1024 at 1.5 T [88.2%] and 997 at 3 T [85.9%]) (Table 2).
Most of the remaining segments were graded as affected by low-grade stenosis (1–49%). The comparison in detection of low-grade stenosis in all 1161 vessel segments revealed a higher incidence at 3 T (153 = 13.2%) compared to 1.5 T (126 = 10.9%). However, chi-square test revealed no statistical significance (p = 0.062).
Importantly, all segments with high-grade stenosis (n = 5) and all completely occluded segments (n = 6) were detected and rated concordantly at both field strengths. The lower leg popliteal arteries, anterior and posterior tibial arteries and fibular arteries (segments 36–43) were affected most often from high-grade stenosis (Table 2, Fig. 2). Overall, the degree of stenosis was rated concordantly at 1.5 T and 3 T in 85% of all patients (23 out of 27 patients).
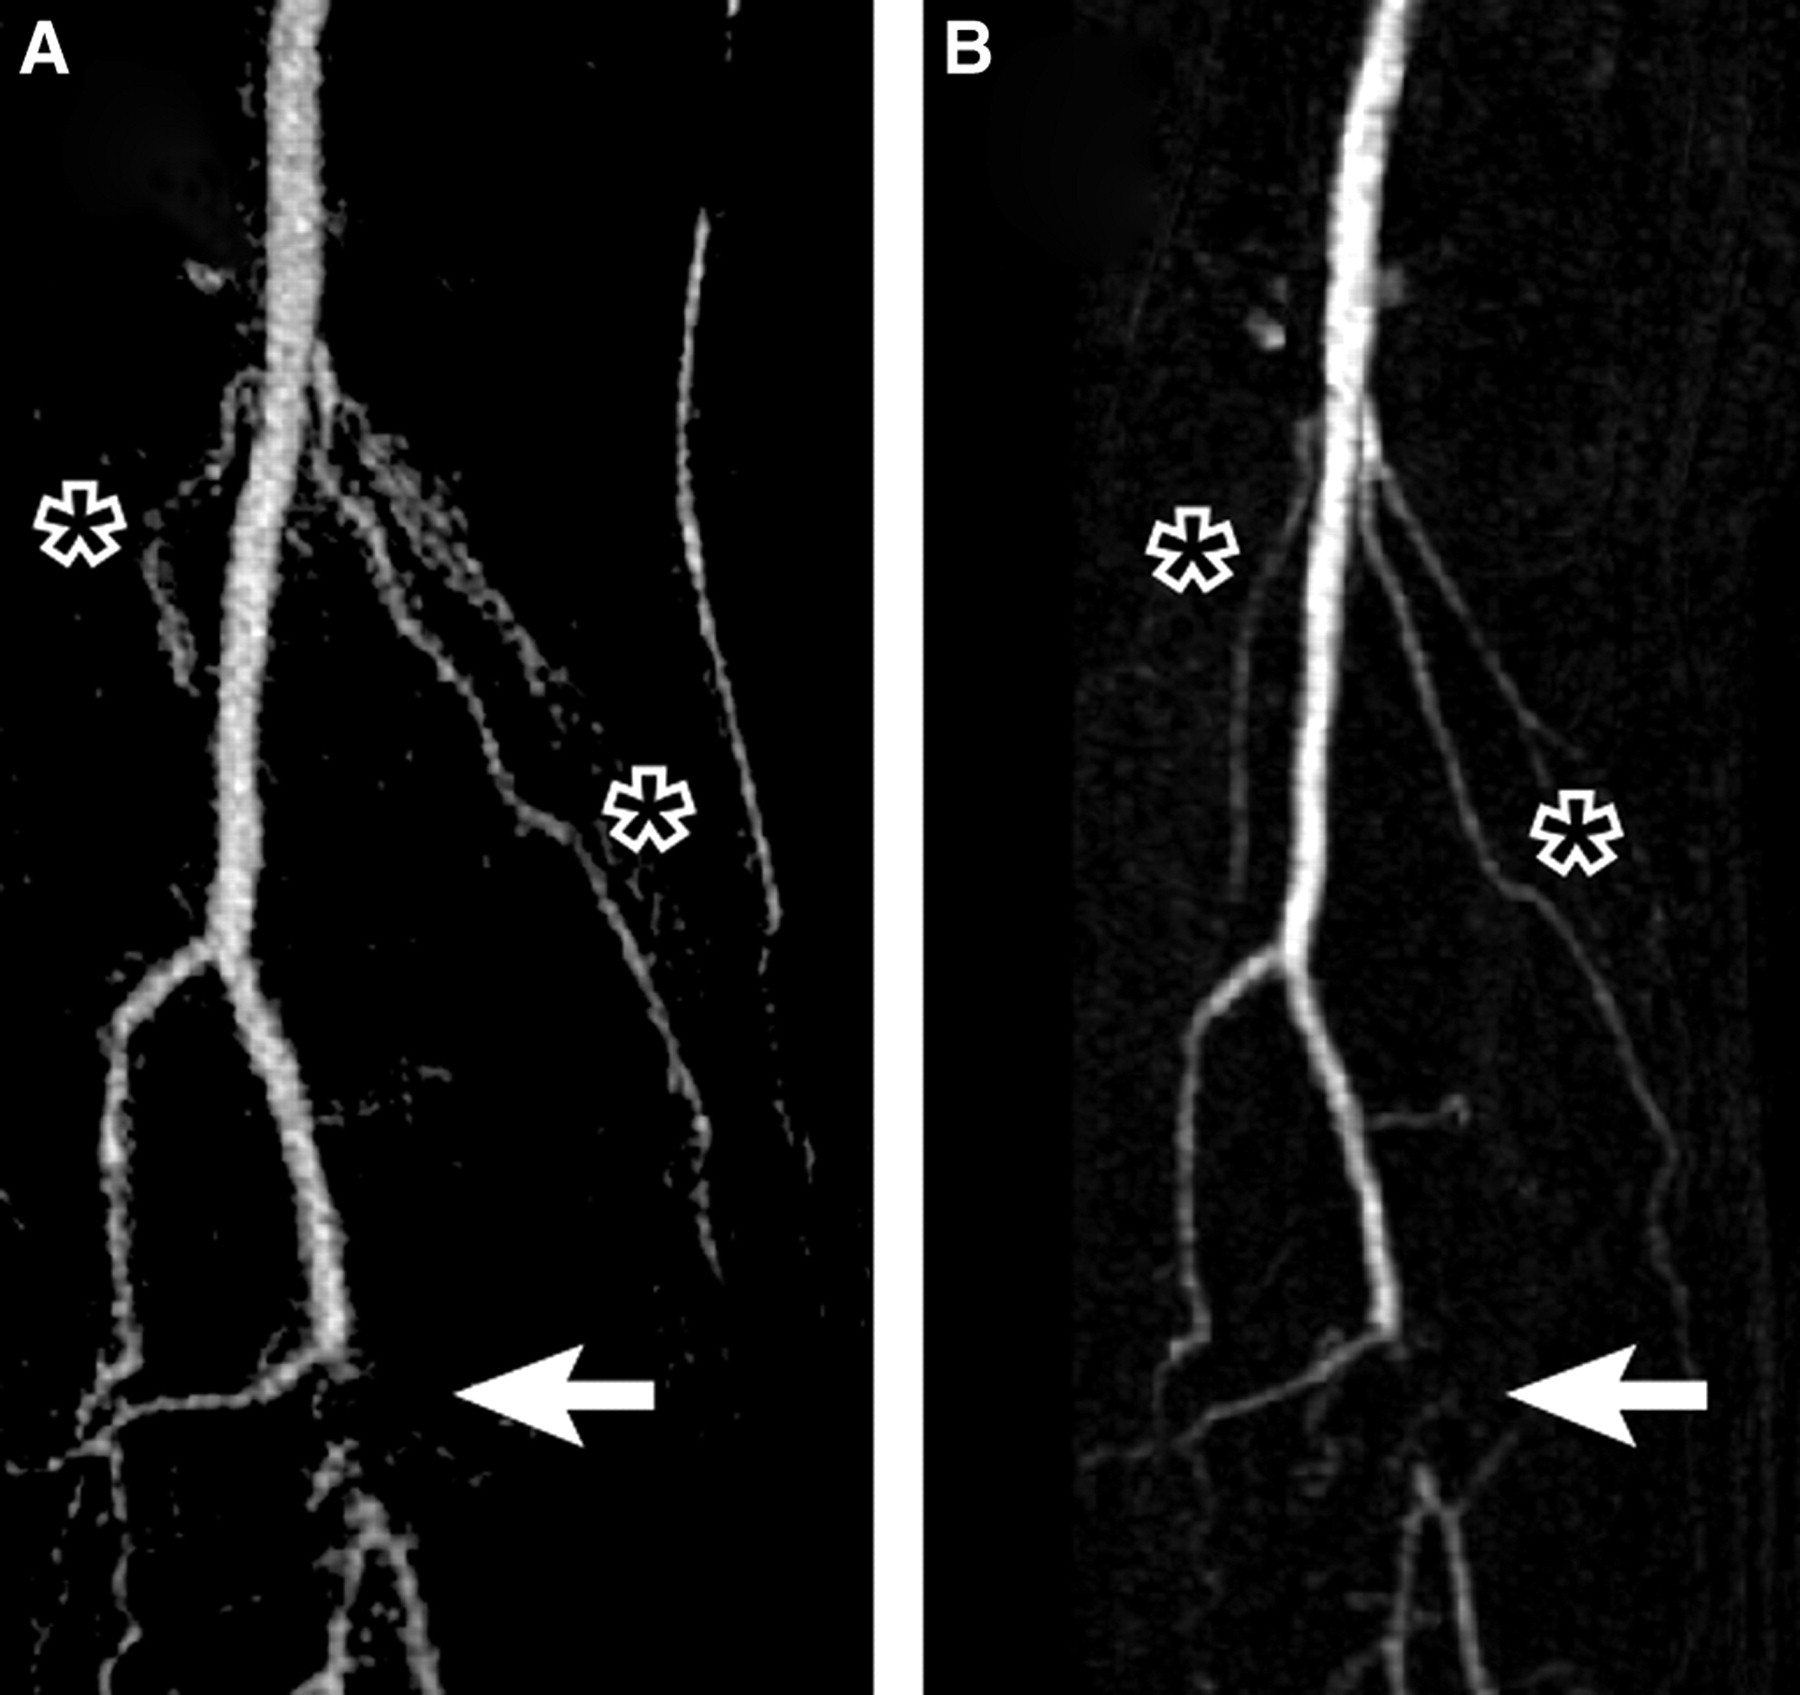
Enlarged view of right lower leg at 1.5 T (A) and 3 T (B) of a 53-year-old male patient. Thick-slice MIP of 1.5 and 3 T examinations reveal proximal branching of right anterior tibial artery as normal anatomic variation. Occlusion (arrow) of the proximal posterior tibial artery (tibioperoneal trunk) is comparably visible at both exams. Collaterals (asterisk) supply the distal posterior tibial artery and fibular artery to compensate for the occluded proximal posterior tibial artery
Pathological and incidental findings
Two patients revealed large aneurysms of the abdominal aorta in the first WBMRA and underwent interventional catheter angiography with bypass grafting and were excluded from further analysis in the study. In three patients MRA revealed moderate aneurysms of the abdominal aorta with diameters of 42 mm, 44 mm and 47 mm, respectively. These three patients were scheduled for a yearly follow-up by ultrasound. One patient had a lusoric artery and a common hepatomesenteric trunc. One patient had a doubled left subclavian artery, another one an accessory renal artery. No arterial dissections were detected in this study. All pathological and incidental finding were concordantly revealed at 1.5 and 3 T.
Discussion
WBMRA has evolved as a useful imaging tool for the evaluation of atherosclerosis of the entire arterial vasculature (7, 13). We intra-individually compared performance and image quality of WBMRA at 3 T with WBMRA at 1.5 T in patients with hereditary hyperlipidemia. In our study, image quality was significantly higher at 3 T than at 1.5 T in 30.4% of the defined arterial segments. Mainly due to technical drawbacks at 3 T, there was no significant difference in the remaining 69.6% of the segments.
Two technical problems were pertinent at 3 T: first, field inhomogeneity artifacts deteriorated image quality of the abdominal part in a substantial part of the examinations (59%), a phenomenon not observed at 1.5 T. These problems are well-known (14) and currently addressed by different techniques, e.g. by implementing parallel imaging (15) or elliptical RF transmission. Secondly, venous overly of the lower legs and carotids was observed more often at 3 T WBMRA (33%) than at 1.5 T (11%), which may have occurred due to the two additional scanning stations at 3 T, with delayed scanning of the ankles. This problem is also well-known at 1.5 T and has been recently in a dedicated study at 1.5 T, where a new scanning and bolus injection strategy was implemented successfully to overcome these problems (16).
Concerning the clinical relevance, our results confirm that evaluation of relevant stenosis, occlusions or aneurysms is possible at 1.5 T and 3 T without statistically significant difference. All high-grade stenosis and complete occlusions have been detected and graded identically at both field strengths in the six affected patients. This is in concordance with a recent study that prospectively determined the accuracy of 1.5 and 3 T MRA versus DSA in the depiction of infrageniculate arteries in patients with symptomatic peripheral arterial disease: Despite marked improvement of signal-to-noise ratio, 3 T MRA did not provide a significantly higher accuracy in diagnostic imaging of atherosclerotic lesions as compared with 1.5 T MRA (17). In our selected patient group suffering from hereditary hyperlipidemia, the lower leg popliteal arteries, anterior and posterior tibial arteries, and fibular arteries have been affected most often from high-grade stenosis or occlusion. However, the number of clinically relevant stenosis was low in our study population and raised the question, whether WBMRA is a cost-effective and useful method to screen patients with hereditary hyperlipidemia.
Our study had several limitations: The appropriate gold standard digital subtraction angiography (DSA) was not deemed necessary in the clinically asymptomatic patients of our study. Moreover, whole-body DSA for comparison is not feasible due to the hazards of ionizing radiation. Also, recent MRA studies at 1.5 T and 3 T have shown a high sensitivity (79–96%) and specificity (83–94%) for the pelvic and lower limb arteries in comparison to DSA, confirming MRA as an accurate method to depict significant stenosis and occlusions (17, 18). WBMRA has several general limitations: WBMRA is designed for large anatomical coverage. Chasing the bolus in the arteries limits the time span available for image acquisition. With longer scan times, the contrast bolus will have proceeded from the arteries to the veins, and venous enhancement becomes pronounced, which may obscure the arterial blood pool. Acquisition time has to be short, which virtually results in limited spatial resolution. Last but not least, the WBMRA approach has not been studied with regard to prediction of future cardiovascular events. The incremental value of WBMRA needs to be validated against future cardiovascular events in an epidemiological setting and as a complementary screening tool for assessing cardiovascular risk.
In conclusion the presented data indicate that improved anatomical depiction can be obtained with 3 Tesla WBMRA. However, due to technical drawbacks observed at 3 T, image quality was significantly higher at 3 T only in 30.4% of the defined arterial segments. In order to effectively take advantage of the higher field strength, further optimization of sequence parameters and injection protocols for WBMRA is warranted.
Footnotes
ACKNOWLEDGEMENTS
This study was supported by a grant (AD 125/4-1) from the Deutsche Forschungsgesellschaft (DFG) (to GA and CW).