
Abstract
Background
Chronic obstructive pulmonary disease (COPD) is often associated with changes of the structure and the function of the right ventricle (RV). Therefore, the assessment of right ventricular function and myocardial mass (MM) is clinically important for the evaluation of the severity of COPD, which may provide an objective basis for therapeutic strategy.
Purpose
To assess the right ventricular function and RV MM in patients with mild to severe COPD using magnetic resonance imaging (MRI).
Material and Methods
We prospectively studied 49 COPD patients determined by the pulmonary function test (PFT). Using the Global Initiative for COPD classification, the COPD patients were divided into three groups according to the severity of the disease: group I = mild (n = 18); group II = moderate (n = 16); and group III = severe (n = 15). The patient groups were compared to a control group consisting of 30 age-matched, healthy, non-smoking subjects. The RV function and RV MM were obtained by 1.5T cardiac MRI in all of the four groups. The results were compared among the four groups using the ANOVA. Pearson's correlation was used to evaluate the relationship between the right ventricular ejection fraction (RVEF) and MM with the PFT results in COPD patients.
Results
The RVEF was significantly lower in group III than in the other groups (P < 0.01). The RV MM differed significantly among all groups (P < 0.01) and gradually increased with the severity of COPD (P < 0.01). The correlation was significant between the MRI results and forced expiratory volume in 1 s (r = 0.860 for RVEF, r = –0.838 for RV MM) in COPD patients.
Conclusion
The RVEF and RV MM measured by MRI correlate significantly with the severity of disease as determined by PFT in patients with COPD.
Keywords
Chronic obstructive pulmonary disease (COPD) is a chronic respiratory disease that can further develop into cor pulmonale and eventually lead to death.
COPD is often associated with changes of the structure and the function of the right ventricle (RV). Therefore, the assessment of right ventricular function and myocardial mass (MM) is clinically important for the evaluation of the severity of COPD, which may provide an objective basis for therapeutic strategy. The proper treatment may retard the progress of the disease and improve the patient's quality of life and life expectancy (1). Pulmonary function test (PFT) is generally accepted as the gold standard for the diagnosis of COPD and the evaluation of the disease severity. However, the results of PFT cannot completely reflect the complicated pathogenetic condition, and other measures need to be developed and evaluated in clinical practice (2). It can be hypothesized that if the RV function correlates significantly with the disease severity of COPD as determined by PFT, the measurement of RV function can play a complementary role in evaluating the severity of COPD, which can guide clinical medication.
Magnetic resonance imaging (MRI) is identified by a large number of clinical research trials as the ‘gold standard’ for the measurement of cardiac function (3). MRI has already been used for accurate measurement of RV function and RV MM in COPD patients (4–7). To our knowledge, there has been no study regarding the relationship between the RV function and MM assessed by MRI with the PFT results in COPD patients.
Therefore, the purpose of this study was to assess the relationship between the measurements of the RV function and MM by MRI and the severity of disease in patients with COPD determined by PFT.
Material and Methods
Subject recruitment
For this prospective study, from October 2008 to May 2010, 49 patients (32 men and 17 women, mean age 61 ± 10 years, range 36–77 years) with COPD underwent the PFT and cardiac MRI examinations. The diagnosis of COPD was made by clinical examination, chest radiographs and lung function parameters based on the Global Initiative for Chronic Obstructive Lung Disease (GOLD) Workshop Report (2). The exclusion criteria of this study included primary heart disease, myocardial infarction, atrial fibrillation, heart failure, patients with any metal chips or implants inside the body (contraindication for MRI) and severe claustrophobia.
The COPD groups were compared to a control group consisting of 30 (20 men and 10 women, mean age 62 ± 10 years, range 36–76 years), age-matched, healthy non-smoking subjects without cardiopulmonary diseases by clinical and imaging examination.
The relevant Human Research Ethics Review Committees approved the study protocol, and the participants gave written informed consent after a complete description of the study.
Pulmonary function tests
The pulmonary function test was performed on COPD patients before the cardiac MRI examination. The interval between these two examinations was less than 3 days. PFT parameters (as measured using a spirometer [Vmax 229, Sensormedics, Yorba Linda, CA, USA]) included the forced vital capacity (FVC), forced expiratory volume in 1 s (FEV1), and the ratio of the forced expiratory volume in 1 s to the forced vital capacity (FEV1/FVC). According to the disease severity based on the GOLD classifications (2), patients were divided into three groups (Table 1).
All COPD patients were divided into three groups based on the GOLD classifications
X = FEV1/predicted FEV1; FVC = the forced vital capacity; FEV1 = the forced expiratory volume in the first second; FEV1/FVC = the ratio of the forced expiratory volume in first second to the forced vital capacity
Breath-hold cine MRI procedure and image analysis
MRI procedures
Cardiac magnetic resonance (CMR) examinations were performed using a 1.5 T MR scanner (Sonata, Siemens, Erlangen, Germany) on 49 patients with COPD. After prescription of standard localization images and long-axis cine images, contiguous 8-mm-thick short-axis cine slices were generated using a steady-state free precession pulse sequence with the following acquisition parameters: repetition time 2.2 ms, echo time 1.4 ms, flip angle 60°, slice thickness/spacing 8/0 mm, matrix 192 × 256, breath-hold duration 7–12 s. All cine MR acquisitions were performed with prospective ECG gating at end expiratory breath-hold. Twenty phases per cardiac cycle were acquired. The heart was covered by 8–12 slices. The patients' mean heart rate was 62 ± 9 bpm (51–76 bpm).
MRI RV functional analysis
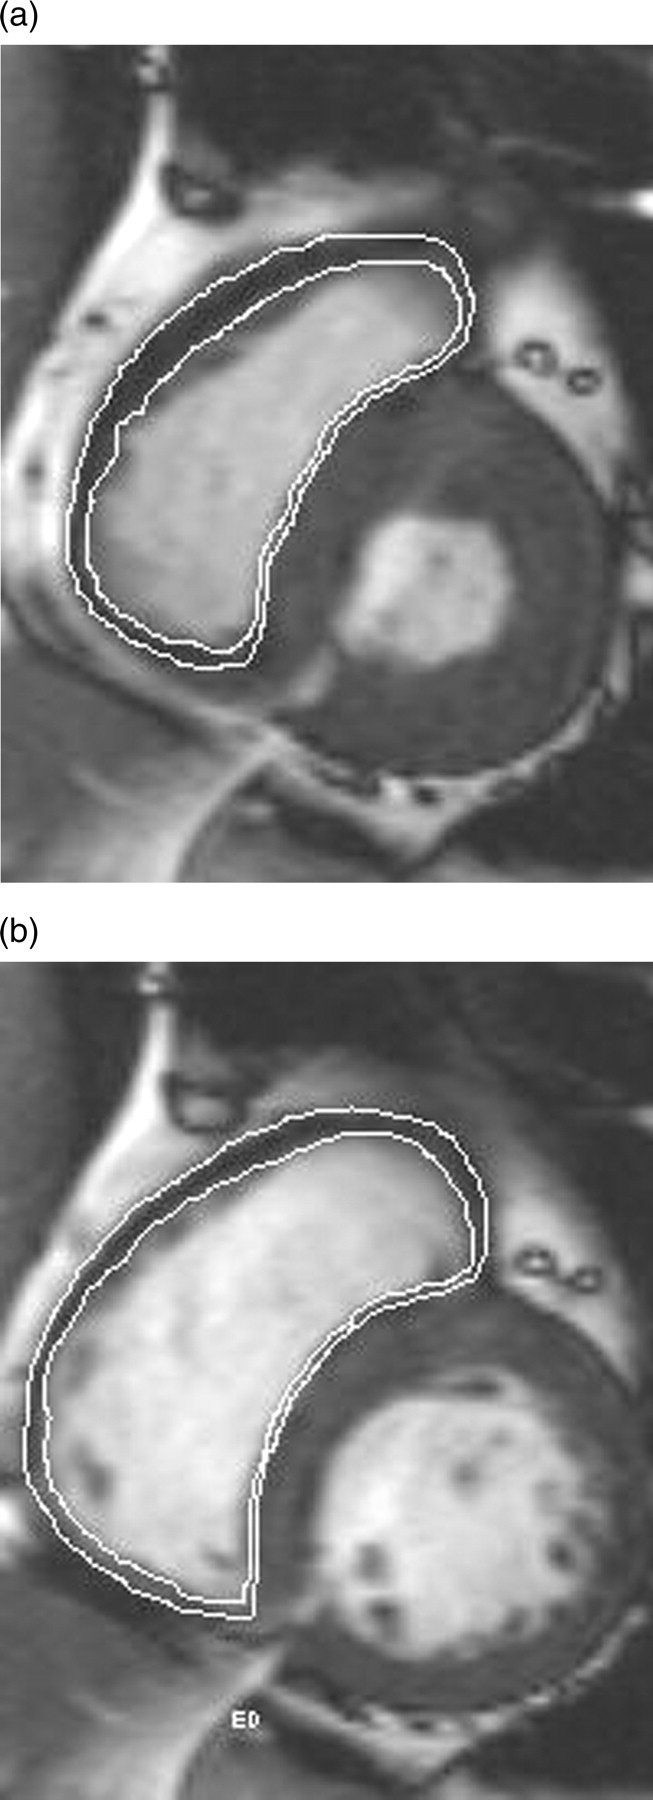
After scanning, all images were transferred to a workstation (Leonardo, Siemens, Erlangen, Germany). Two radiologists evaluated the end-systolic volume (ESV) and end-diastolic volume (EDV) of the right ventricle independently using a special cardiac MRI function analysis software (Argus, Siemens Medical Solutions, Erlangen, Germany). Minimal and maximal right ventricular volumes were detected automatically for RV ESV and RV EDV with visual adjustment. Images were enlarged 1.5 times and the width of window was adjusted to achieve a good blood pool contrast within the myocardium, equal signal intensity, and clear epicardial and endocardial borders. The epicardial and endocardial contours of RV (Fig. 1) of all the systolic and diastolic short-axis images (about 26 images) were manually traced on the screen. Both papillary muscles and trabeculations were considered as a part of the RV cavity. The ventricular septum was not considered as a part of the RV, and it was not included in the mass measurements (8). RV functional parameters such as EDV, ESV, stroke volume (SV), and ejection fraction (EF) were automatically calculated. The myocardial mass was assessed using the following equation
Measurement of the right ventricular volume and myocardial mass with a semi-automated software. Short-axis images in the end-systolic (a) and the end-diastolic phases (b) with markers indicate how the endocardial and the epicardial borders of these sections were traced
Time for defining the RV contours was approximately 8 min per patient (9, 10).
Statistic analysis
The right ventricular functional parameters obtained by the two radiologists were analyzed for inter-group consistency using the intraclass correlation coefficient (ICC) (11). All data were analyzed with the SPSS statistical software package (SPSS for Windows, version 13.0; SPSS, Chicago, IL, USA). The results were expressed as mean ± SD. One-way ANOVA with the Bonferroni method was used to compare RV EDV, RV ESV, RV SV, RVEF and RV MM among the different groups. Pearson's correlation was used to evaluate the relationship between the RVEF and RV MM with the PFT results in COPD patients. P values less than 0.05 were considered statistically significant.
Results
The short-axis reformations of cardiac MRI allowed clear delineation of the endocardial and epicardial contours of the RV in all the COPD patients. In some patients, the stair-step artifacts were visualized, which were more prominent in group III than in group I or group II. However, there were no obstacles in the RV volume and mass evaluation.
The results obtained by the two independent radiologists were not significantly different by ICC analysis (Table 2). The PFT results among the different groups are shown in Table 3, and right ventricular EDV, ESV, SV, EF, and MM measurements are shown in Table 4. The right ventricle function parameters were also normalized for body surface area (BSA). The Mosteller formula about BSA was applied (12).
The correlation of right ventricular function parameters obtained by two independent radiologists (ICC analysis)
RV = right ventricular; EDV = end-diastolic volume; ESV = end-systolic volume; EF = ejection fraction; MM = myocardial mass
The pulmonary function tests results in COPD patients and control group
Numbers are observed values in percentage of predicted values
Group I = COPD patients with FEV1/FVC <70% of predicted, FEV1/predicted FEV1 >0.8, Group II = COPD patients with FEV1/FVC <70% of predicted, 0.3 ≤ FEV1/predicted FEV1 <0.8, Group III = COPD patients FEV1/FVC <70% of predicted, FEV1/predicted FEV1 <0.3 or FEV1/predicted FEV1 <0.5 with respiratory failure or clinical signs of right heart failure
VC = the forced vital capacity; FEV1 = the forced expiratory volume in first second; FEV1/FVC = the ratio of the forced expiratory volume in first second to the forced vital capacity
The right ventricular function measurements obtained using MRI
*P < 0.01, vs control group
†Significant differences among the four groups
Group I = COPD patients with FEV1/FVC <70% of predicted, FEV1/predicted FEV1 >0.8; Group II = COPD patients with FEV1/FVC <70% of predicted, 0.3 ≤FEV1/predicted FEV1 <0.8; Group III = COPD patients FEV1/FVC <70% of predicted, FEV1/predicted FEV1 <0.3 or FEV1/predicted FEV1 <0.5 with respiratory failure or clinical signs of right heart failure
Data shown as mean values ± standard deviation (SD). One-way ANOVA with the Bonferroni correction was applied for multiple testing to evaluate the difference among the four groups, and the differences were considered significant at the P < 0.05 level
VC = the forced vital capacity; FEV1 = the forced expiratory volume in first second; FEV1/FVC = the ratio of the forced expiratory volume in first second to the forced vital capacity; EDV = end-diastolic volume; ESV = end-systolic volume; SV = stroke volume; EF = ejection fraction; MM = myocardial mass
The RV EDV, RV EDV/BSA, RVEF, RV SV and RV SV/BSA were significantly lower in the severe COPD group than in the controls, the mild and moderate COPD groups (P < 0.01). However, the RV ESV and RV ESV/BSA were not significantly different among all COPD groups and control group (P > 0.05). The RV MM and RV MM/BSA differed significantly among all groups (P < 0.01) and gradually increased with the severity of COPD (P < 0.01). There were no significant differences between mild COPD group and control group in the RV EDV, RV EDV/BSA, RV SV, RV SV/BSA and RVEF (P > 0.05). The RV EDV, RV EDV/BSA and RVEF in the moderate COPD group were significantly less than in the control group (P < 0.01), but RV EDV, RV EDV/BSA and RVEF were not different compared to the mild COPD group (P > 0.05).
RVEF and RV MM in patients with COPD measured by MRI, significantly correlated with FEV1 (rRVEF = 0.860, rMM = –0.838, P < 0.01) (Fig. 2) and FEV1/FVC (rRVEF = 0.832, rMM = –0.811, P < 0.01) (Fig. 3).
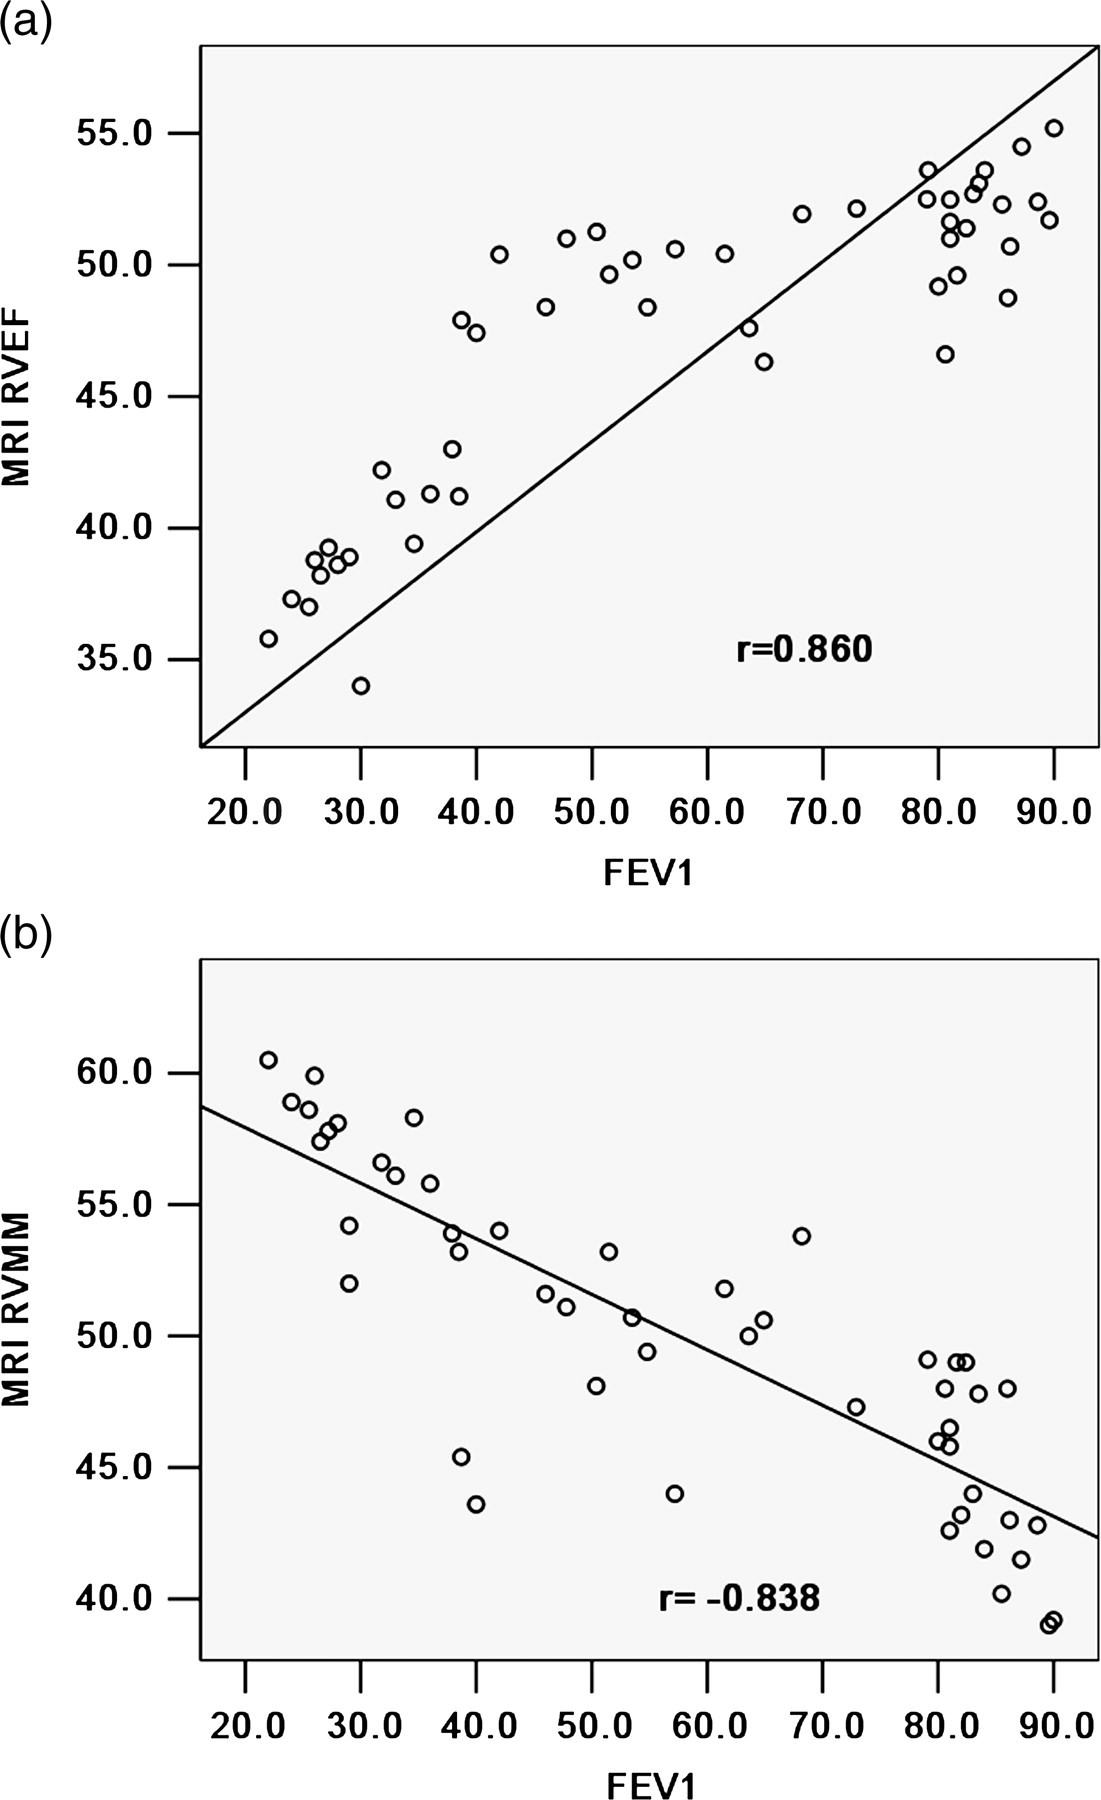
The relationship between the measurements of the RVEF and the mass by MRI, and the FEV1 in 49 patients with COPD. (a) The relationship between the measurements of the RVEF by MRI and FEV1, with the correlation coefficient of 0.860. (b) The relationship between the measurements of the RV mass by MRI and FEV1, with the correlation coefficient of –0.838
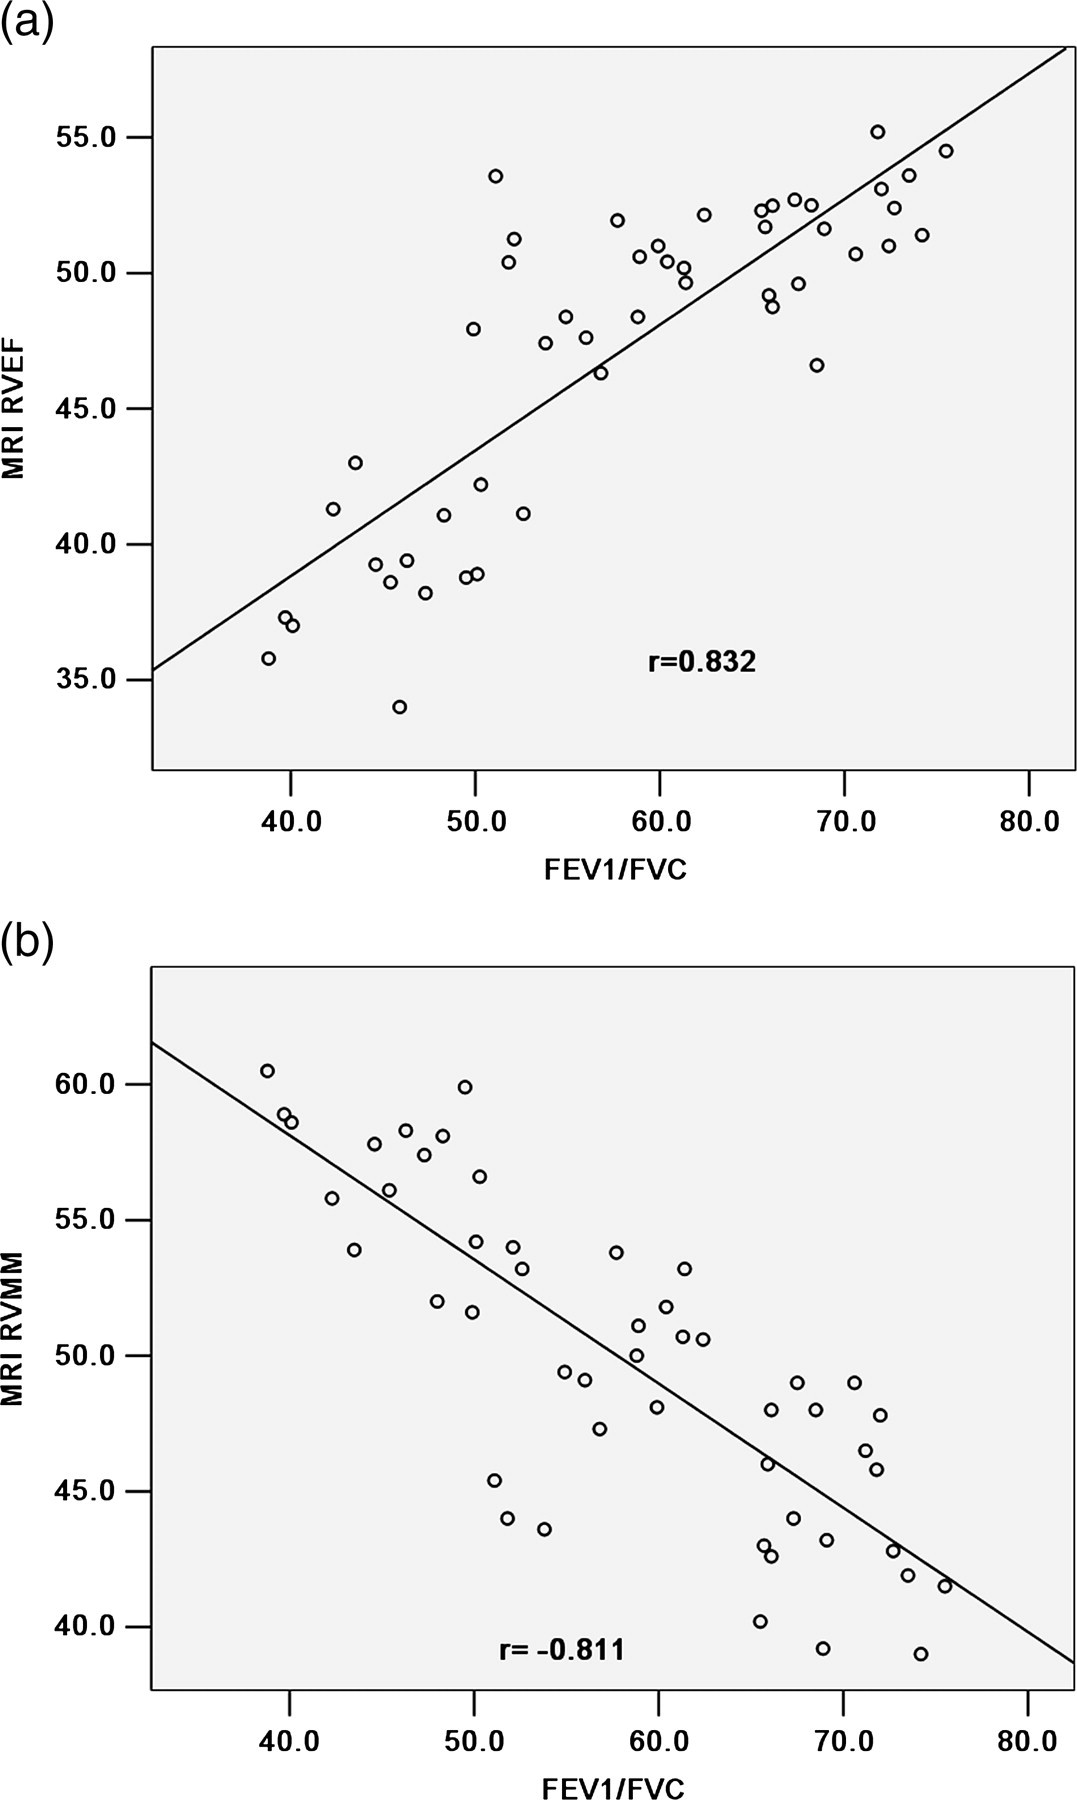
The relationship between the measurements of the RVEF and the mass by MRI, and the FEV1/FVC in 49 patients with COPD. (a) The relationship between the measurements of the RVEF by MRI and FEV1/FVC, with the correlation coefficient of 0.832. (b) The relationship between the measurements of the RV mass by MRI and FEV1/FVC, with the correlation coefficient of –0.811
Discussion
This study shows that the mean RV wall mass and RVEF, as measured by MRI, correlate with the COPD disease severity.
It is well-known that COPD patients usually experience hypoxemia and hypercapnia, which may result in hypoxic pulmonary vasoconstriction with re-modelling of the pulmonary vascular system followed by pulmonary hypertension. As a result, the right ventricular afterload is increased (10), which may cause right ventricular hypertrophy that further develops into cor pulmonale (13). Vonk-Noordegraaf et al. (8) have described that RV hypertrophy is the earliest sign of the RV pressure overload in COPD patients with mild hypoxemia. In our study, RV MM in the COPD groups was significantly different from the control group and increased with the severity of the disease. In mild to moderate COPD, right ventricular hypertrophy compensates for decreasing right ventricular function and maintains a normal range of EF. However, in severe COPD, RVEF is significantly decreased although the RV MM is increased. This suggests that right ventricular hypertrophy can no longer compensate for decreased cardiac function, suggesting a possible etiology for cor pulmonale (14). This finding is in agreement with those of earlier studies on RVEF (4, 15, 16) that showed that RVEF is usually in the normal range in most stable COPD patients and the RVEF level do not decrease until the late stage of COPD.
Our results show that in patients with COPD RVEF and RV MM, measured by MRI, significantly correlated with the disease severity as determined by FEV1 and FEV1/ FVC. These results predict that the measurement of RV EF and RV MM may play a complementary role in evaluating the severity of COPD.
FEV1 and FEV1/FVC value can not completely reflect the complexity and gravity of patient's illness. The assessment of right ventricular EF is clinically important for evaluation of RV systolic dysfunction, which may provide an objective basis for therapeutic strategy. Continuous low-concentration oxygen therapy, improvement of respiratory function and the control of respiratory tract infection are beneficial to COPD patients with preserved RV EF or with mild RV EF decrease. The symptoms disappear. If the COPD patients have marked decrease of RV EF, then they are considered as severe COPD patients, diuretics and vasodilators should be used in addition to the aforementioned therapy, to reduce the preload and afterload of RV, increase cardiac output and reduce pulmonary vascular resistance.
Our study had several limitations. Firstly, the study population was too small to generalize the results. Further work will be needed to study a broader range of patients looking at the relationship between RV EF, RV MM and the severity of COPD as determined by the PFT. Secondly, in COPD patients, dyspnea often makes it difficult to perform breath-holding more than 10 s long, and the stair step artifact can affect evaluation of the ventricular function. It is hoped that with technological developments, the image quality will further improve and the imaging time will be shortened.
In conclusion, the RVEF and RV MM measured by MRI correlated significantly with the disease severity as determined by PFT in patients with COPD. The assessment of right ventricular function is clinically important for evaluation of the severity of COPD, which may provide an objective basis for therapeutic strategy.