
Abstract
Background
Stress-rest perfusion magnetic resonance imaging (MRI) has become one of the major indications for cardiovascular MRI. Standard multibreath hold short-axis image acquisition is the gold standard for LV function assessment and part of a comprehensive stress-rest perfusion MRI study, but takes up to 10 min. The total scan time could significantly be shortened when cine imaging would be performed between stress and rest perfusion.
Purpose
To systematically study whether adenosine, albeit its short half-life time, influences LV function measurements in this setting.
Material and Methods
Thirty-nine patients with suspected and/or known coronary artery disease underwent 3-Tesla adenosine (140 µg/min/kg) stress-rest perfusion MRI. A stack of short-axis slices covering the entire ventricles was acquired before and ≥3 min after adenosine infusion using standard multibreath-hold 2D steady-state free precession imaging. LV volumes (EDV, ESV), EF, and mass were calculated by the slice summation method, and wall motion was assessed using a 4-point scoring scale. Reproducibility was assessed by Bland-Altman statistics.
Results
EDV, ESV, EF, and mass were not significantly different between the two imaging time points (before versus after adenosine administration) in all patients (P ≥ 0.346) and patients with impaired LV function (P ≥ 0.718). Wall motion scores did not differ either (P ≥ 0.124). Inter-observer variability before (P ≥ 0.468) and after (P ≥ 0.451) adenosine infusion was low.
Conclusion
Short-axis cine imaging for LV function assessment can accurately be performed between stress and rest imaging. These data demonstrate that potential effects of adenosine on LV function are of short duration, and propose a new time-saving imaging protocol without compromising accuracy.
Keywords
Stress-rest perfusion cardiovascular magnetic resonance imaging (MRI) has emerged as a sensitive and specific diagnostic test to detect myocardial ischemia (1–7) and has become one of the major indications for cardiovascular MRI. Several single and multicenter studies have yielded excellent results for coronary artery disease detection as defined by conventional coronary angiography (1–7). Short-axis cine imaging has become the gold standard for accurate determination of ventricular volumes, ejection fractions, and mass (8–16). Currently, a multibreath hold two-dimensional steady state free precession gradient echo pulse sequence (standard 2D SSFP) is used to acquire multiple short-axis slices to cover the entire ventricles from base to apex (17, 18). However, one major limitation of cardiac MRI in clinical routine is its prolonged examination time.
An integral part of the comprehensive stress-rest perfusion MRI study is the assessment of ventricular function and myocardial viability. The entire examination takes about 40 min. Usually, cine imaging for ventricular function assessment is performed first, followed by perfusion and viability assessment (17). However, standard multibreath hold short-axis image acquisition is time-consuming and significantly prolongs the total scan time. This particularly affects patients with severe illnesses where examination time is limited.
Due to gadolinium contrast injection for myocardial stress perfusion imaging, the rest perfusion study is performed after a waiting time of 10–15 min to give the contrast enough time to wash out (17). This waiting time may be used to perform additional scans such as flow imaging or for ventricular function assessment. The total scan time could be significantly reduced if standard short-axis cine imaging, usually performed prior to the stress perfusion study (17), would be performed in the waiting time between stress and rest perfusion imaging. This would be more convenient for both patient and operator. However, to our best knowledge, it has never been studied whether ventricular function measurements after adenosine administration for stress perfusion MRI differ from those obtained before stress perfusion imaging.
Thus, the purpose of the present study was to evaluate the differences between left ventricular volume, ejection fraction and mass measurements as well as wall motion scores calculated form short-axis cine images acquired prior to the stress perfusion study and those acquired during the 10–15 min waiting time between stress and rest perfusion imaging in patients with suspected and known coronary artery disease. We further aimed to investigate the reproducibility of left ventricular function measurements and differences in signal intensity between short-axis cine images before and after contrast injection.
Material and Methods
Patients
Twelve subjects (nine men, mean age 47 ± 15 years, range 19–67 years) with atypical chest pain were recruited to rule out coronary artery disease. In addition, 27 patients (13 men, mean age 60 ± 11 years, range 37–78 years) with known coronary artery disease were included in the study (14/27 with reduced left ventricular function [EF <50%] determined by echocardiography and 13/27 with normal left ventricular function [EF ≥50%], among those three with left ventricular hypertrophy). Subjects with contraindications to stress-rest perfusion MRI were not enrolled (17). Informed consent was obtained before the MRI examination in all cases. The study was conducted according to the principles of the Declaration of Helsinki and was approved by the institutional ethics committee.
Image acquisition
MRI was performed with a 3.0 Tesla magnet (Signa HDxt 3.0T, GE Healthcare, Waukesha, WI, USA) using a dedicated, phased array, cardiac coil (HD Cardiac Array, 8 channells, 8 elements, GE Healthcare, Waukesha, WI, USA) and retrospective electrocardiographic triggering.
Real-time scout images in axial, sagittal, and coronal planes were used to localize the cardiac position within the thorax and to plot double oblique, orthogonal, short- and long-axis imaging planes of the left ventricle.
First, a multibreath hold two-dimensional imaging sequence with steady-state free precession (standard 2D-SSFP) (17), constant radiofrequency pulsing and with parallel imaging (19) (acceleration factor 2) was used. The breath hold duration for each slice was 6–10 sec, depending on the heart rate. On the basis of horizontal and vertical long-axis images, a stack of short-axis images were planned perpendicular to the interventricular septum. To cover the entire left ventricle, multiple short-axis images were acquired from the base of the heart (atrioventricular ring) to the apex with 8-mm slice thickness and 2-mm gap during breath holding. Images were reviewed by two experienced physicians (BS and SS) at the time of the examination to insure that all left ventricular myocardium (from the base through the apex) was included in the scan.
Stress and rest perfusion imaging as well as late contrast enhancement imaging (viability assessment) was performed using a standard protocol (Fig. 1, contrast dosage: 0.075 mmol/kg gadolineum-DTPA, Magnevist®; Bayer-Schering AG, Berlin, Germany, infusion rate, 3.5 mL/s for stress and rest perfusion imaging; adenosine (Adenoscan; Sanofi-Aventis Deutschland GmbH, Frankfurt am Main, Hessen, Germany): 3 min infusion of 140 µg/kg body weight/min) (5, 17).
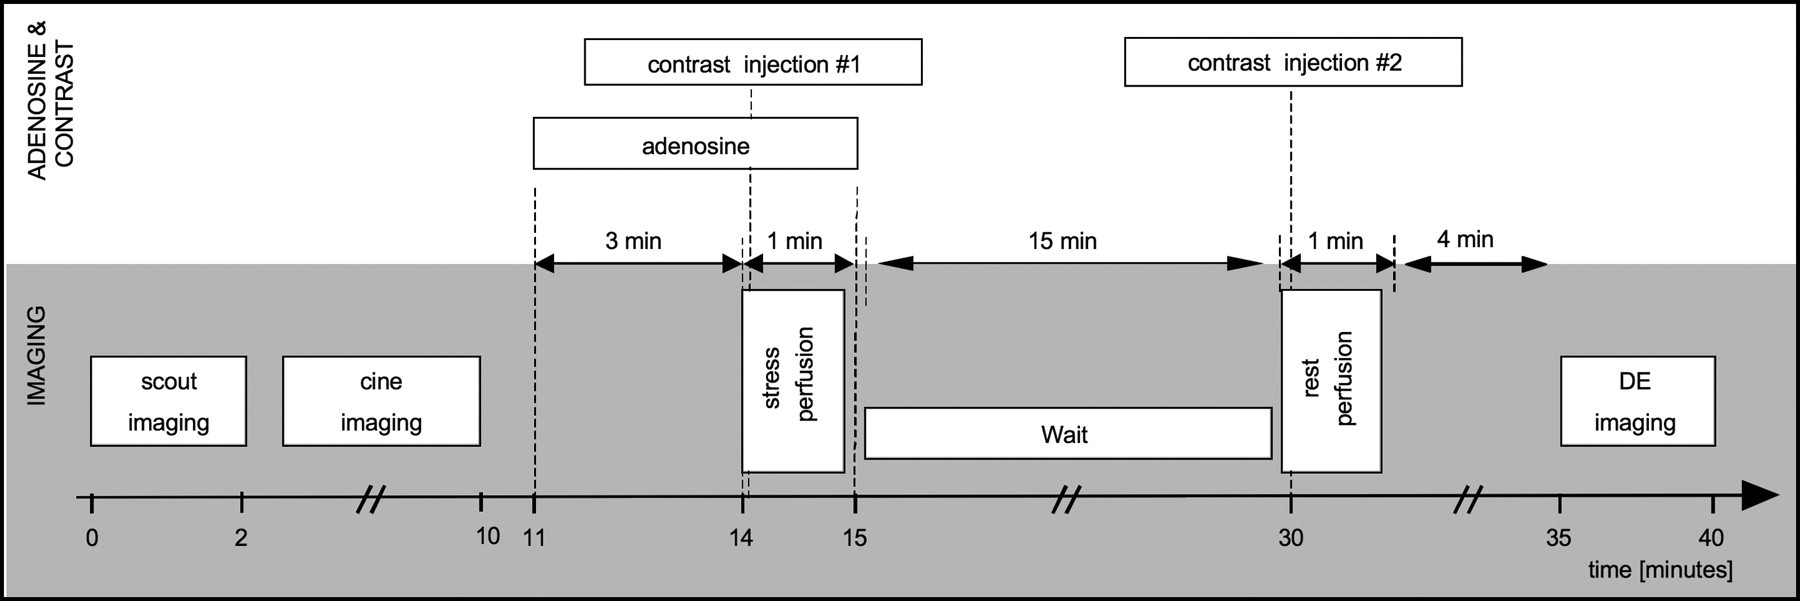
Timing schematics of the standard imaging protocol for stress-rest perfusion MRI. Note that cine imaging (four-chamber view, two-chamber view and a stack of short-axis images that covers the entire left ventricle) is performed prior to the adenosine stress perfusion study. The total imaging time is approximately 40 min
Multislice short-axis imaging was repeated using identical slice positioning and slice offset ≥3 min after the adenosine stress perfusion study during the 10–15 min waiting time prior to the rest perfusion study (Fig. 2). The time of the second short-axis image acquisition ≥3 min after the adenosine stress perfusion study was arbitrarily chosen. However, 3 min were found to be enough time to ensure that ventricular function measurements were not influenced by adenosine even in patients with ischemia in whom the adenosine effect might be prolonged.

Imaging protocol for stress-rest perfusion MRI used in the present study. Cine imaging is performed before (prior to the stress perfusion study, cine imaging I) and ≥3 min after adenosine administration (cine imaging II)
The parameters for standard 2D-SSFP were the following: slice thickness 8 mm, interslice gap 2 mm, repetition time 3.8 msec, echo time 1.5 msec, flip angle 45 degrees, bandwidth 125 Hz/pixel, pixels 224 × 224, field of view 380 mm, temporal resolution 46 msec, in-plane spatial resolution 1.7 × 1.7 mm. Representative short-axis cine image examples before and after adenosine and contrast administration are given in Fig. 3.
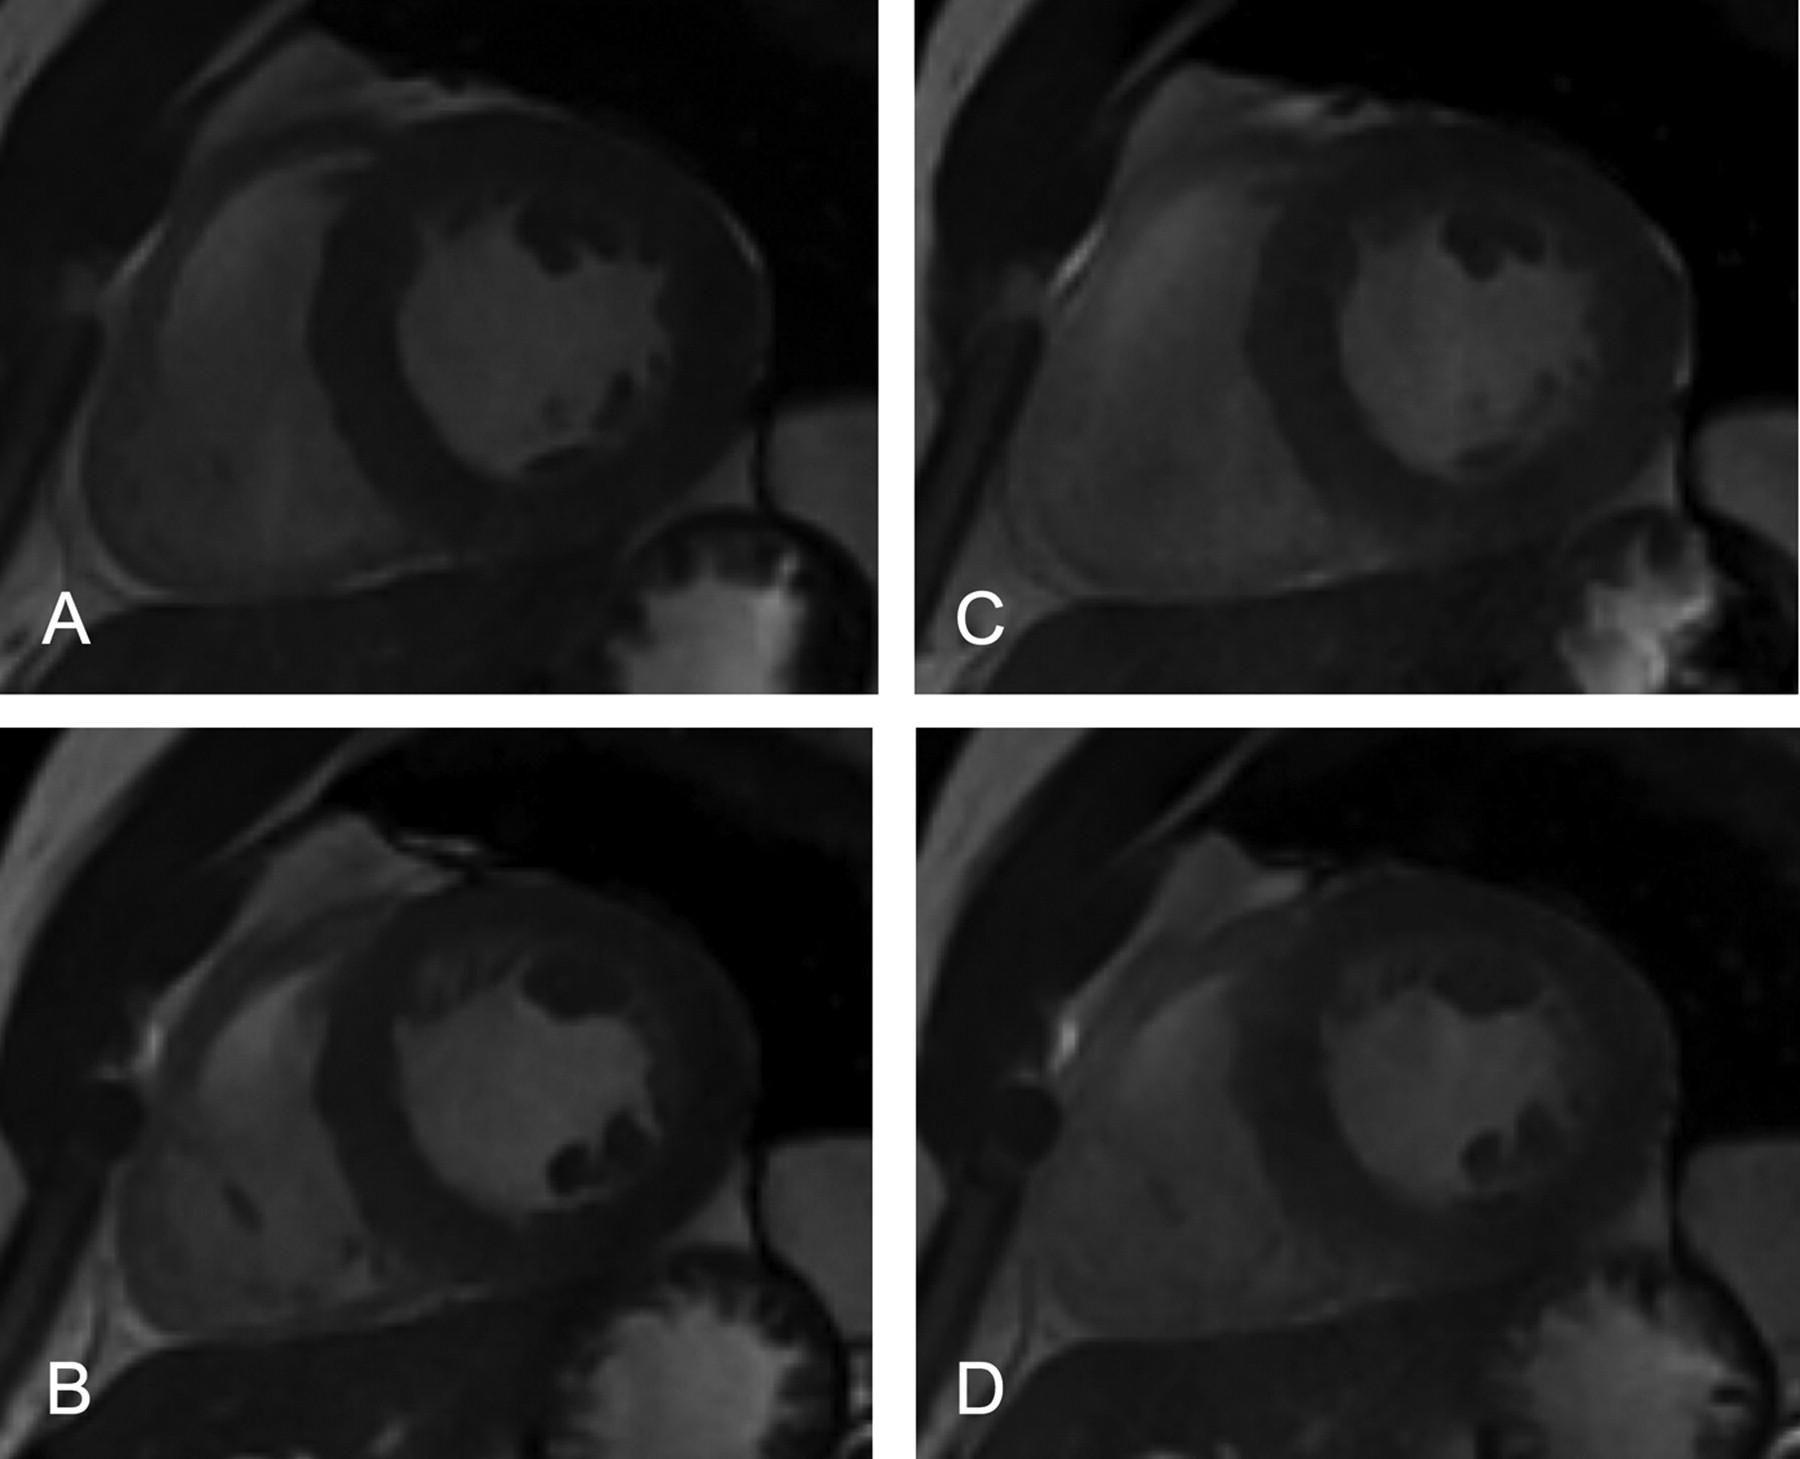
Standard 2D-SSFP short axis images at the mid-ventricular level before (A + B) and after (C + D) adenosine administration (A + C: end diastole, B + D: end systole). Note the higher signal intensity of the myocardium after adenosine administration due to contrast injection during stress perfusion (signal intensity 232.3 ± 5.9 versus 275.8 ± 9.6). However, endocardial and epicardial borders as well as papillary muscles and trabeculations are still distinct after contrast administration
Analysis
All images were evaluated with a commercially available computer software program (ReportCard 4.0, RC 4.3.1_FW0309; GE Healthcare, Waukesha, WI, USA) as previously described (20, 21). Quantitative measurements of cavity volume, ejection fraction, and left ventricular myocardial mass were performed using short-axis images.
Analysis for both short-axis stacks before and after adenosine administration was performed by consensus of two experienced physicians (PS, BS) that were blinded to patient clinical history and diagnostic findings.
Contour tracing was aided by reviewing the multiple-phase scans in the cine mode. For left ventricular volume assessment, end-diastole was defined visually as the phase with the largest volume, and end-systole as the phase with the smallest volume. At the base of the heart, slices were considered to be in the left ventricle if the blood was at least half surrounded by ventricular myocardium. For the basal slice the contours were traced up to the junction of the atrium and the ventricle as previously described (14, 21). Blood volume up to the aortic valve was included in the left ventricular volume. The epicardium and endocardium of the left ventricle were traced with a cursor in each end-diastolic and end-systolic slice and the sum of the marked areas used to calculate the total volume. Tracings were performed with papillary muscles and trabeculations excluded from left ventricular cavity and volumes (Fig. 4). Trabeculae were defined as myocardium protruding >1.5 mm from the circumferential contour of the left ventricular cavity as previously described (21). Volume analyses were performed for both imaging techniques.
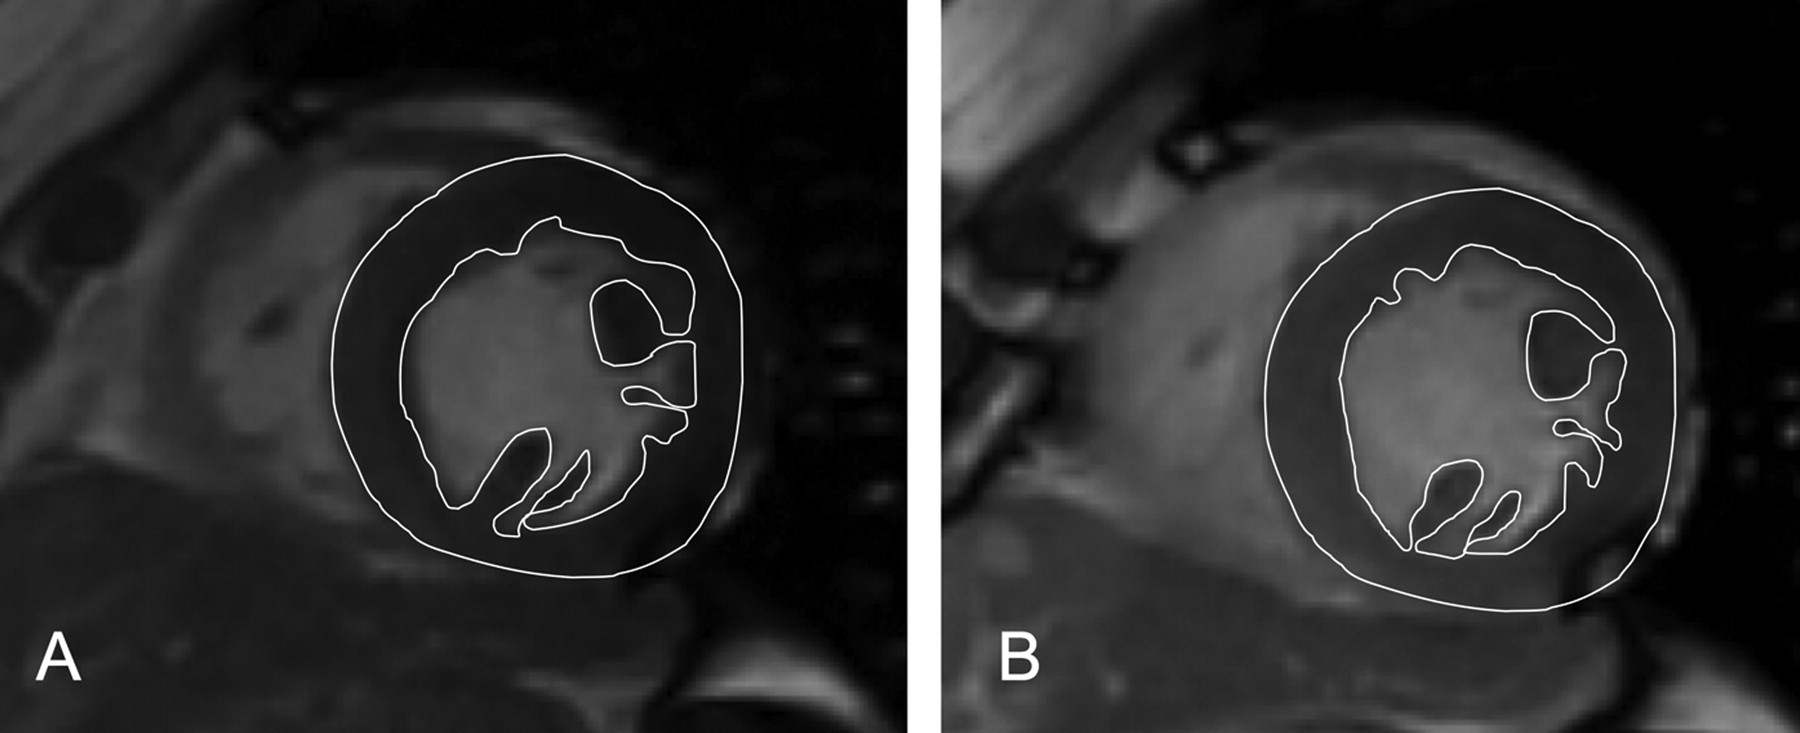
Standard 2D-SSFP short-axis image before (A) and after (B) adenosine administration at the mid-ventricular level at end systole. Endocardial and epicardial borders as well as papillary muscles and trabeculations are clear even after contrast administration (b) and contours are accurate
Left ventricular end-diastolic volume (EDV) and end-systolic volume (ESV) were calculated from the sums of the outlined areas using slice summation method. Left ventricular ejection fractions (EF) were calculated from the formula EDV-ESV/EDV × 100. Left ventricular mass was calculated on the basis of EDV and the epicardial end-diastolic volume measurement, and determined as a product of myocardial volume and specific gravity: (Epicardial end diastolic volume – EDV) * 1.05.
For the analysis of the short-axis stack that was acquired after adenosine and contrast administration it was taken care that end-diastolic and end-systolic images as well as left ventricular basal and apical images were defined the same way as described above. This was important to ensure that differences in measured volumes and mass would only be due to the adenosine effect and differences in signal intensities of the myocardium and the cavity after contrast injection during the stress study.
Wall motion scoring
Wall motion abnormalities were scored visually by consensus of two experienced physicians (PS, BS) at both imaging time points using the standard 17 segment model (22) and a 4-point scoring scale: 1-normal, 2-hypokinetic, 3-akinetic, 4-dyskinetic.
Evaluation of myocardial ischemia and viability
Evaluation of stress and rest perfusion images, and late contrast enhancement images (viability study) were performed visually by consensus reading (BS, PS) as previously described (5).
Visual image quality scoring
Consensus reading was performed on all cine imaging datasets in a blinded and random order by two observers (BS, PS). Image quality was assessed by using a 3-point scoring scale: 1 = poor (left ventricular borders, papillary muscles and trabeculations can hardly be defined, myocardium only slightly darker/greyer than the cavity/blood pool); 2 = good (left ventricular borders, papillary muscles and trabeculations can reasonable be defined, myocardium moderately darker/greyer than the cavity/blood pool); 3 = very good (left ventricular borders, papillary muscles and trabeculations can sharply be defined, myocardium significantly darker than the cavity/blood pool).
Reproducibility
The entire data-set of all subjects was re-analyzed by a second experienced observer to assess inter-observer variability for volume, EF and mass measurements. The observer (LJ) was blinded to the previous results. The second analysis was performed at least 7 days after the first analysis.
Image intensity analysis
Quantitative analysis was performed to evaluate potential mechanisms for differences in the results between short-axis left ventricular function measurements before and after adenosine administration. A single mid-ventricular short-axis image was selected for each subject. Regions-of-interest (ROI) were placed within the myocardium and left ventricular cavity. It was taken care that ROI were not placed in areas with artifacts and at corresponding positions on each short-axis slice for either pulse sequence. Signal intensity (SI) ratios between cavity and myocardium were calculated: Ratiocavityt/rmyocardium= mean SI of cavity / mean SI of myocardium. Additionally, an ROI was placed outside the body to measure the standard deviation (SD) of background noise, and to generate signal-to-noise ratios (SNR) as follows: SNRmyocardium= mean SI of myocardium / (1.43 × SD of background). The correction factor of 1.43 accounts for the under-estimation of noise that occurs when noise is measured from magnitude images (23) after adjustment for an 8-element coil array (24). This method of measuring noise might have limitations in the setting of parallel imaging. On accelerated images such as 2D SSFP, the noise background varies with spatial position caused by the spatial dependence of noise amplification characterized by coil geometry (25). However, SNR values should be considered only an approximation.
Statistical analysis
Continuous data are expressed as mean ± SD, except where noted. Comparisons between analysis methods were made using the Wilcoxon matched-pairs signed-ranks test. All statistical tests were 2-tailed; P < 0.05 was considered significant. Inter-observer reproducibility were assessed using the method of Bland and Altman (26). A mixed linear modell with random effect and bootstrapping was used to compare left ventricular function parameters before and after adenosine administration. Statistical analysis was performed with Stata 10.1 (Intercooled Stata 10.1 for Windows).
Results
MRI examination could be performed in all subjects. All images were used for analysis. All subjects had regular sinus rhythm. The mean heart rate was not different between short-axis imaging before and ≥3 min after adenosine and contrast administration (67.3 ± 8.5 bpm versus 68.5 ± 9.3 bpm, P = 0.75). During adenosine infusion the mean heart rate increased in all patients (88.3 ± 11.5 bpm). Image acquisition time for standard 2D SSFP was 194 ± 10 s before and 197 ± 11 s after adenosine administration. Acquisition of the second set of short-axis images were started 200 ± 18 s after the adenosine administration was stopped.
Left ventricular function before and after adenosine administration
Left ventricular end-diastolic (EDV), end-systolic volumes (ESV), ejection fractions (EF) and mass before and after adenosine administration, and the differences in volumes, EF and mass between both points in time (before versus after stress perfusion) are displayed in Table 1. There were no significant differences in volumes, EF, and mass between the two cine imaging time points (before compared to after adenosine administration, P ≥ 0.346, Table 2). Left ventricular EDV, ESV, EF, and mass before compared to after adenosine administration were not significantly different in patients with impaired left ventricular function either (P ≥ 0.718).
Volumes (EDV, ESV), ejection fraction (EF), and left ventricular mass before (pre) and after (post) adenosine administration, and differences between the results
Volumes (EDV, ESV), ejection fraction (EF), and left ventricular mass before (pre) and after (post) adenosine administration in patients with preserved (EF ≥ 50%) and impaired (EF < 50%) left ventricular function
Wall motion scoring
Wall motion abnormalities were present in 11 patients before and after adenosine administration (same patients). Of the 11 patients with wall motion abnormalities, seven had myocardial ischemia and myocardial scaring. Anterior wall motion abnormalities were present in seven patients. Of those, two had lateral, six inferior and four septal wall motion abnormalities. Five patients had >1 wall motion abnormality. Hypokinesia was present in eight patients, akinesia in two, and dyskinesia in one patient. Twenty-eight patients had no wall motion abnormalities at all. Wall motion scores between the two imaging time points (cine imaging I versus cine imaging II, Fig. 2) were not significantly different (P ≥ 0.124).
Presence of myocardial ischemia and infarction
Myocardial ischemia was present in 12 patients (eight subendocardial, four endocardial) with perfusion defects in the septal (n = 3), anterior (n = 3), lateral (n = 2), and inferior wall (n = 4). Seven patients had both myocardial ischemia and myocardial infarction as indicated by late gadolineum enhancement (five non-transmural, two transmural).
Visual image quality scoring
Cine images after adenosine and contrast administration (during the waiting time between stress and rest perfusion) showed reduced image contrast. The myocardium and the blood pool of the images acquired after adenosine and contrast administration (cine imaging II, Fig. 2) were generally lighter/greyer than those acquired prior to the stress test (cine imaging I, Fig. 2, standard approach). This may be the main reason why the image quality was scored lower for the new approach (2.76 ± 0.4 versus 2.92 ± 0.3, P = 0.061). However, it did not reach the level of significance, and papillary muscles and trabeculations were still distinct (Fig. 3).
Reproducibility
Inter-observer variabilities for short-axis left ventricular function measurements before and after adenosine and contrast administration are displayed by Bland-Altman plots (Fig. 5). There were no significant differences in inter-observer variabilities for volumes, EF, and mass before (P ≥ 0.468) and after (P ≥ 0.451) adenosine administration in patients with normal and impaired left ventricular function.
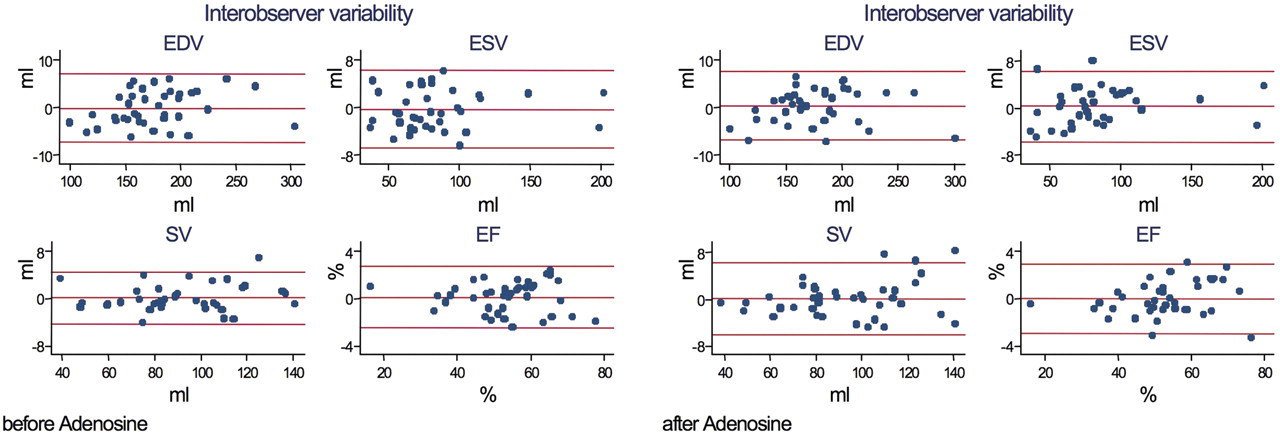
Bland Altman plots of the inter-observer variability for volume and EF measurements before and after adenosine administration
Image intensity analysis
Quantitative analysis of 2D SSFP images before versus after adenosine administration demonstrated significantly higher signal intensities for both left ventricular myocardium (219.4 ± 48.3 versus 282.2 ± 69.0, P ≤ 0.001) and left ventricular cavity (350.5 ± 58.8 versus 357.5 ± 60.0, P ≤ 0.001). Signal-to-noise ratio (SNR) as well as cavity-to-myocardium signal intensity ratio was significantly higher after compared to before adenosine administration for both myocardium and cavity (P ≤ 0.001 for each test, Table 3).
Image intensity analysis
Discussion
We studied whether adenosine, albeit its short half-life time influences left ventricular function measurements in patients with suspected and/or known coronary artery disease and preserved as well as impaired left ventricular function, and compared left ventricular function measurements before and ≥3 min after adenosine administration using the standard short-axis method and 2D steady state free precession 3-Tesla imaging (Fig. 2). To our knowledge this is the first study that systematically evaluated the influence of adenosine on ventricular function and mass measurements at two different time points during a stress-rest perfusion 3-Tesla MRI study using short-axis imaging, and in addition accounted for papillary muscles and trabeculations (20, 21) for most accurate ventricular function measurements.
It is of note that we did not aim to evaluate differences in ventricular function measurements and wall motion related to adenosine during adenosine administration. The fact that adenosine can cause wall motion abnormalities that may affect ventricular function measurements in patients with ischemic heart disease is known and has been previously described (27–29).
We found no significant differences in volumes, ejection fractions, left ventricular mass, and wall motion scores between both imaging time points in either patients with preserved and impaired left ventricular function. Differences in volumes, EF, and mass were very small and may not be of clinical relevance. In addition, left ventricular function and mass measurements were highly reproducible before and after adenosine administration.
For stress perfusion imaging, adenosine is continuously infused for 3 min at a rate of 140 µg/kg/min prior to image acquisition to achieve maximal vasodilatation and terminated immediately after the image acquisition has been completed (Fig. 1) (17). Intravenously administered adenosine is rapidly cleared from the circulation via cellular uptake, primarily by erythrocytes and vascular endothelial cells. Intracellular adenosine is rapidly metabolized either via phosphorylation to adenosine monophosphate by adenosine kinase, or via deamination to inosine by adenosine deaminase in the cytosol. The fast clearance of adenosine results in a very short half-life (<10 seconds) (28, 30, 31).
Adenosine causes a nearly maximal myocardial blood flow response that is blunted in stenosed coronary arteries compared with normal or less severely diseased segments. In addition to the perfusion defect the coronary steal effect may result in a detectable wall motion abnormality (27, 29). Post ischemic stunning has been observed in one-third of patients with severe reversible perfusion defects (32).
The fact that we did not find significant differences in volumes, EF, and mass between short-axis imaging before and ≥3 min after adenosine administration, and did not observe any changes in wall motion scores related to adenosine either might be due to the following two reasons: (a) lack of a significant adenosine effect ≥3 min after the infusion was stopped; (b) small sample size (only four patients had endocardial ischemia, eight patients had subendocardial ischemia). Reason (a) may be supported by the fact that the mean heart rate was back to baseline at the time when the second stack of short-axis images was acquired. It has been reported that adenosine induces wall motion abnormalities, predominately in patients with high-grade stenosis (29). However, these wall motion abnormalities occur during adenosine infusion and maximum vasodilatation, and may not last ≥3 min after the infusion has been terminated. It has also been reported that the adenosine effect may last as long as 7 min and might cause prolonged myocardial wall motion abnormalities in a small percentage of patients with myocardial ischemia (27, 28). However, in our study, the sample size might have been too small to observe any significant differences (12 patients had ischemia).
Due to the contrast bolus injection during adenosine stress perfusion imaging (Fig. 1) short-axis cine images appeared greyer when acquired during the waiting time between the stress and rest perfusion study. However, endocardial and epicardial borders as well as papillary muscles and trabeculations were still distinct (Figs. 3 and 4). Nevertheless, the lower image contrast between the left ventricular myocardium and the blood pool after adenosine administration and contrast injection (lower signal intensity ratio, Table 3) as well as the slightly lower image quality might have contributed to the small differences in the results.
In conclusion, standard multibreath hold short-axis imaging for left ventricular function and mass assessment may be performed during the waiting period after adenosine administration and stress perfusion imaging prior to the rest perfusion study without compromising accuracy. This significantly reduces the total scan time by several minutes, resulting in more convenience for patients and operator, and may enhance patients’ through put. Our data demonstrate that potential effects of adenosine on left ventricular function are of short duration, and propose a new time saving imaging protocol without compromising accuracy.