
Abstract
Background
Diffusion-weighted imaging (DWI) and diffusion-tensor imaging (DTI) can be used to evaluate changes that accompany skeletal muscle contraction.
Purpose
To investigate whether jaw opening or closure affect the diffusion parameters of the masseter muscles (MMs).
Material and Methods
Eleven healthy volunteers were evaluated. Diffusion-tensor images were acquired to obtain the primary (λ1), secondary (λ2), and tertiary eigenvalues (λ3). We estimated these parameters at three different locations: at the level of the mandibular notch for the superior site, the level of the mandibular foramen for the middle site, and the root apex of the mandibular molars for the inferior site.
Results
Both λ2 and λ3 during jaw opening were significantly lower than that at rest at the superior (P = 0.006, P < 0.0001, respectively) and middle site (P = 0.004, P = 0.0001, respectively); however, the change in λ1 was not significant. At the lower site, no parameter was significantly different at rest and during jaw opening. There was no significant difference in T2 between at rest (40.3 ± 4.4 ms) and during jaw opening (39.2 ± 2.7 ms; P = 0.12). The changes induced by jaw closure were marked at the inferior site. In the middle and inferior sites, the three eigenvalues were increased by jaw closure, and the changes in λ1 (P = 0.0145, P = 0.0107, respectively) and λ2 (P = 0.0003, P = 0.0001) were significant (especially λ2).
Conclusion
The eigenvalues for diffusion of the MM were sensitive to jaw position. The recruitment of muscle fibers, specific to jaw position, reflects the differences in changes in muscle diffusion parameters.
Diffusion-weighted imaging (DWI) and diffusion-tensor imaging (DTI) of human skeletal muscles of the extremities have been used for many purposes such as evaluating skeletal muscle damage (1–3) and changes that accompany contraction (4–9). Skeletal muscle consists of highly ordered elongated muscle fibers; thus, it is an ideal target for DTI study. An extensive study on relaxing myocardial fibers has demonstrated that the eigenvectors (λ1, λ2, λ3) of the diffusion tensor are related to fiber architecture (10). It has been demonstrated that the first eigenvalue represents diffusion along the main direction of the muscle fiber. Also, it has been suggested that the second and third eigenvalues represent diffusion of water within the endomysium and throughout the fiber radius, respectively (10, 11).
A DW image and its coefficient reflect both the diffusion of intra- and extracellular water (Brownian motion) and microcirculation of blood in the capillary network (perfusion) in each imaging voxel. Estimating either the apparent diffusion coefficient (ADC) or fractional anisotropy (FA) estimation is expected to provide more detailed pathophysiological information on muscle than does conventional T2-estimation (8) and could be a new technique to study impairment of muscle contraction in the extremities. We considered that information provided by the DW and DT images has the potential to aid in the diagnosis of temporomandibular disorder (type I), hyperplasia of the tendon, and aponeuroses of the masticatory muscles, for which the diagnostic criteria have not been established yet. However, the movement of masticator muscles is complex, as is their anatomy, with many layers of diversely oriented fascicles with different fiber and macromere lengths (12–15). Thus, it is important first to understand changes in the diffusion coefficient caused by different jaw positions in healthy volunteers (16–18).
The aim of the present study was to assess whether water diffusion changes could be detected by DT MRI performed at rest and during jaw opening and closure in normal volunteers.
Material and Methods
Subjects
The Ethics Committee of Fukuoka Dental College approved this study. Informed consent was obtained from all participants. Eleven healthy volunteers (8 men, 3 women) participated (mean age 40.2 ± 9.5 years). The selection criteria were no more than one missing tooth in the right or left dental arch, no cuspal interference and resultant functional shift, and no symptoms of temporomandibular joint or jaw-muscle disorders.
MRI examinations
All examinations were performed on a 1.5-T scanner (Intera Achieva; Philips Medical Systems, Best, The Netherlands), with a SENSE-flex-M Coil. To obtain DT images, a single shot, spin-echo, echo-planar sequence (SS SE-EP) was used with TR/TE of 3500/60 ms and spectral attenuation with inversion recovery (SPAIR) for fat suppression: reduction factor of SENSE = 2; matrix size (acquisition) = 96 × 96, matrix size (reconstruction) = 160 × 160, number of excitations (NEX) = 5, bandwidth = 2.34 Hz/pixel, and total imaging time = 4 min 47 s. Motion-probing gradients were applied along 15 different directions, with b-values of 0 and 600 s/mm2. Twenty contiguous images with a slice thickness of 5 mm were taken.
Little information is available about optimal ranges of b-values for musculoskeletal investigations. In general, higher b-values reduce the effect of perfusion; however, a short T2 value in skeletal muscle makes it difficult to set higher b-values (>1000 s/mm2) due to a poor signal-to-noise ratio. Recently, it was demonstrated that the optimal b-value of human skeletal muscle in the calf at 1.5 T MRI was 625 s/mm2 using a subjective evaluation of image quality in the tractography and an estimate of the fiber density index. Therefore, we chose 600 s/mm2 as b-value. We selected 15 directions because the DTI acquisition time was <5 minutes in consideration of the volunteers (19).
A turbo spin-echo sequence was used to obtain a T2 map: turbo factor = 8, matrix size (acquisition) = 96 × 94, matrix size (reconstruction) = 160 × 160, NEX = 1, and total imaging time = 3 min 10 s. The repetition time (TR) was 2000 ms. Echo time (TE) was increased from 10 to 80 ms in 10-ms intervals, and all eight images were used to calculate T2. Single transverse images with a slice thickness of 15 mm were taken to obtain an accurate T2 map to reduce the magnetization transfer effect.
3D-T1-high-resolution isotropic volume examination (THRIVE) with spectral presaturation and inversion recovery (for fat suppression) was used to obtain high-resolution anatomical images. Representative parameters were as follows: SENSE reduction factor = 2.0, matrix size (acquisition) = 220 × 220, matrix size (reconstruction) = 448 × 448, NEX = 4, number of lines of k space (TFE factor) = 20, flip angle = 10°, TR = 7.7 ms, TE = 3.8 ms, and total imaging time = 3 min 13 s.
Protocol for the MRI study
Initially, the volunteers underwent single-shot, spin-echo, echo planar imaging (SS SE-EPI), fast spin-echo (FSE), and THRIVE sequences at rest. Then, they opened their mouths by holding three sheets of sponge between the incisors of the maxilla and those of the mandible. The three sheets of sponge measured 20 × 12 × 20 mm. Finally, 5 min after the sponges were removed, they were instructed to be in centric occlusion and bite slightly, which caused isometric contraction of the masseter muscles (MMs). They underwent the SS SE-EPI sequence and THRIVE sequence and were instructed to keep the same bite force during MR image acquisition. The FSE sequence was not performed in centric occlusion so as to decrease examination time.
Image analysis of DTI
Diffusion parameters were calculated using an image analysis program (Diffusion TENSOR Visualizer, second release; dTV-II) implemented in the VOLUME-ONE software package (free software by Masutani; see
We set the region of interest (ROI) by tracing the bilateral MMs manually at three different positions: at the level of the mandibular notch for the superior site; the level of the mandibular foramen for the middle site; and the root apex of the mandibular molars for the inferior site. We had to set ROIs on b0 images using the dTV-II software; thus, we confirmed the level of ROI by superimposing the anatomical images (THRIVE images) on the DT images (Fig. 1). The VOLUME-ONE software reconstructed the isotropic volume data (1.375 × 1.375 × 1.375 mm) using an interpolation algorithm, and the five contiguous slices at each site were traced manually; the ROIs had a thickness of 6.88 mm.
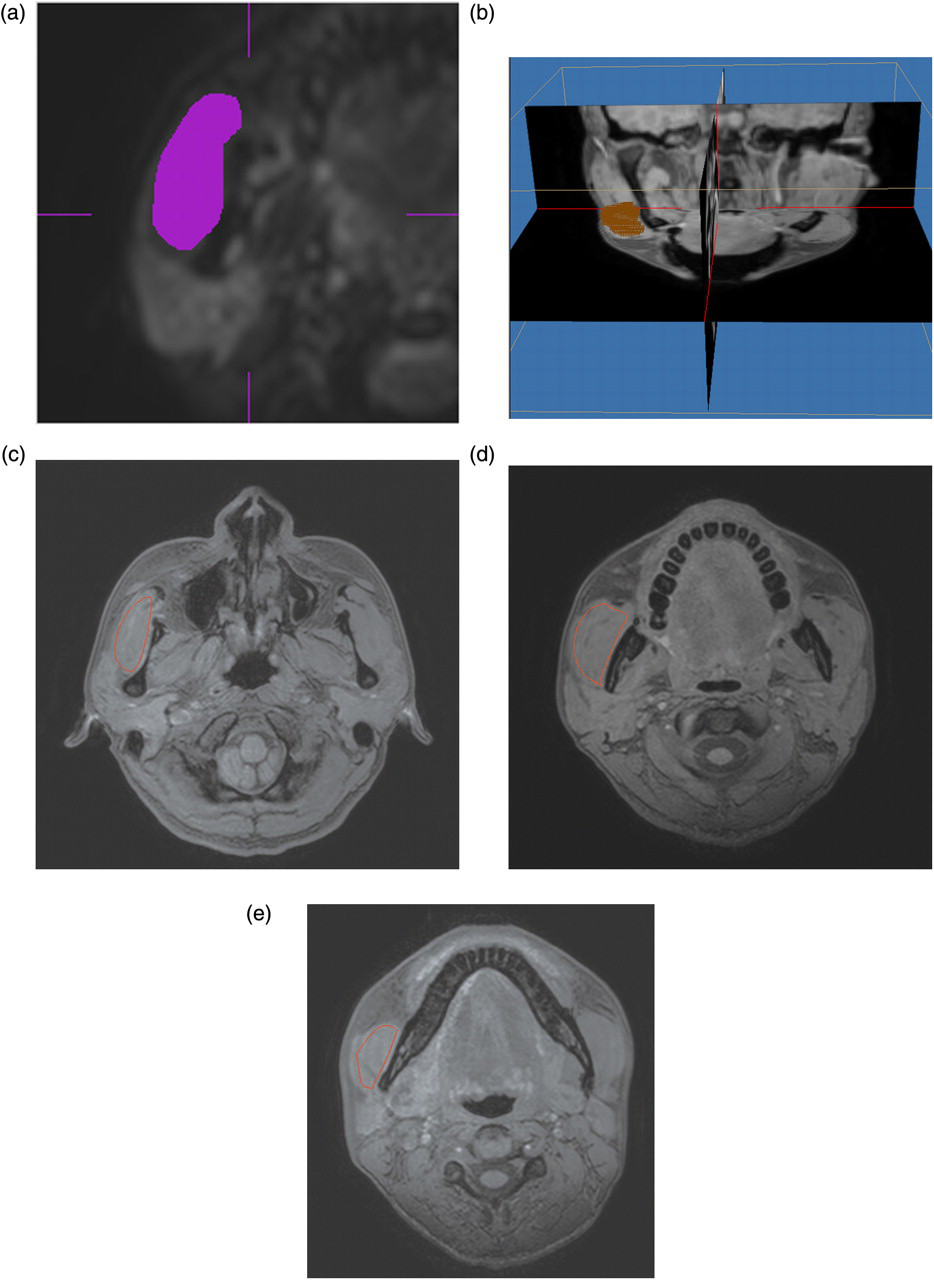
The method for setting the region of interest (ROI). We traced the masseter muscles (MMs) and set the ROI on the b0 image using dTV-II software (a). We confirmed the location of the ROI by synchronizing the b0 image with the anatomical images (THRIVE images) (b); ROI was set at three different positions: at the level of the mandibular notch for the superior site (c); the level of the mandibular foramen for the middle site (d); and the root apex of the molars for the inferior site (e). The red line shows the each ROI in right masseter muscle
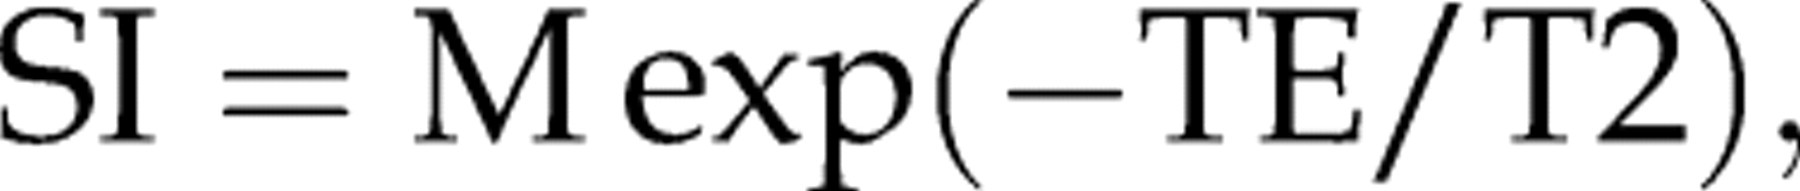
Image analysis for T2 map
To obtain the T2 map, the DICOM data obtained by a turbo spin-echo sequence were imported into a personal computer. Two-parameter curve-fitting was performed to obtain the T2 map:
Statistical analyses
One author estimated the diffusion parameters three times. The average of the three measurements was used for further analyses. We calculated the coefficient of variation of the three measurements and the percentage difference of parameters between the right and left MM. Average bilateral MMs were used for the analysis because the muscle activity is almost completely symmetric (20, 21). Repeated ANOVA was used to evaluate whether the location of the ROI (superior, middle, inferior) had an effect on the parameters; this was followed by post hoc comparisons for any pairs of three locations of the ROIs. The effects of jaw opening and jaw closure on these parameters were also evaluated. Repeated ANOVA was used to evaluate whether these tasks had an effect on the parameters, and this was followed by post hoc comparisons. The paired t-test was used to evaluate whether jaw opening had an effect on T2. All data were analyzed using Stat View J ver. 5 (SAS Institute, Cary, NC, USA).
Results
The coefficients of variation of ADC and λ1, λ2, and λ3 were <3.5 % except λ3 during jaw opening and jaw closure. Both ADCs, λ1, λ2, and λ3, had high symmetry between the right and left side, and the percentage of difference was <4%. This result was in agreement with our previous reports (16, 17). Therefore, average bilateral MMs were used for further analyses.
Relationship between diffusion parameters and location of ROIs at rest
ADC at the superior site (level of the mandibular notch) was significantly lower than that at the inferior site (level of root apex of mandibular molars; P = 0.0012).
Thus, MMs near the origin had a lower ADC than those near the insertion. λ1, λ2, and λ3 were also significantly different between the superior and inferior sites (P = 0.001, 0.014, and 0.0002, respectively). In contrast, the superior location resulted in higher FA.
Changes in diffusion parameters and T2 value by jaw opening
At the superior and middle sites, jaw opening caused a significant decrease in ADC and a significant increase in FA. It also caused a significant decrease in λ2 and λ3; however, the change in λ1 was not significant (Table 1). There was no significant difference in T2 between at rest (40.3 ± 4.4 ms) and during jaw opening (39.2 ± 2.7 ms; P = 0.12).
Comparison of parameters at rest, during jaw opening, and during clenching. Values of ADC (×10−3 mm2/s), FA and the three eigenvalues (×10−3 mm2/s)
S = significantly difference (P < 0.05)
Changes in diffusion parameters by jaw closure
At the inferior and middle sites, jaw closure caused a significant increase in ADC. The three eigenvalues were increased by jaw closure, and the changes in λ1 and λ2 were significant. At the superior site, a significant difference was only found for λ2 (Table 1).
Discussion
DWI and DTI of human skeletal muscle have been used for various purposes such as the evaluation of skeletal muscle injuries, the effect of blood flow obstruction, and changes after exercise. A few recent studies have evaluated the changes in diffusion parameters of MM after jaw clenching. However, these reports evaluated the maximum area of masseter muscle, despite the complexity of its anatomy (16, 17). Delineation of the specific layers (superior, intermediate, and profound) would have been appropriate; however, the program (dTV-II software) only allowed drawing of the ROI on the B0 image from DTI. Therefore, we evaluated the diffusion parameters at three different levels instead. Moreover, we also evaluated the changes in these parameters induced by jaw closure and opening.
In our study, the ADC of the higher site (close to origin) was significantly smaller than that of the lower site (close to insertion) at rest. Brunel et al. (15) documented identification of the various tendinous sheets by anatomical studies of cadavers, and they correspond to those identified by MRI. The ROI at the superior site had a large area of tendon, which was obvious in the Thrive images, which depicted the intra-masseteric aponeuroses (12–14) (Fig. 2). In the present study, we traced the contours of the masseter muscle on B0 images; therefore, we could not separate the tendon from the muscle. The heterogeneity of fiber and sarcomere length between the superficial and deep layers and the ratio of the tendon within the ROI reflect the differences in the parameters between the three different locations.
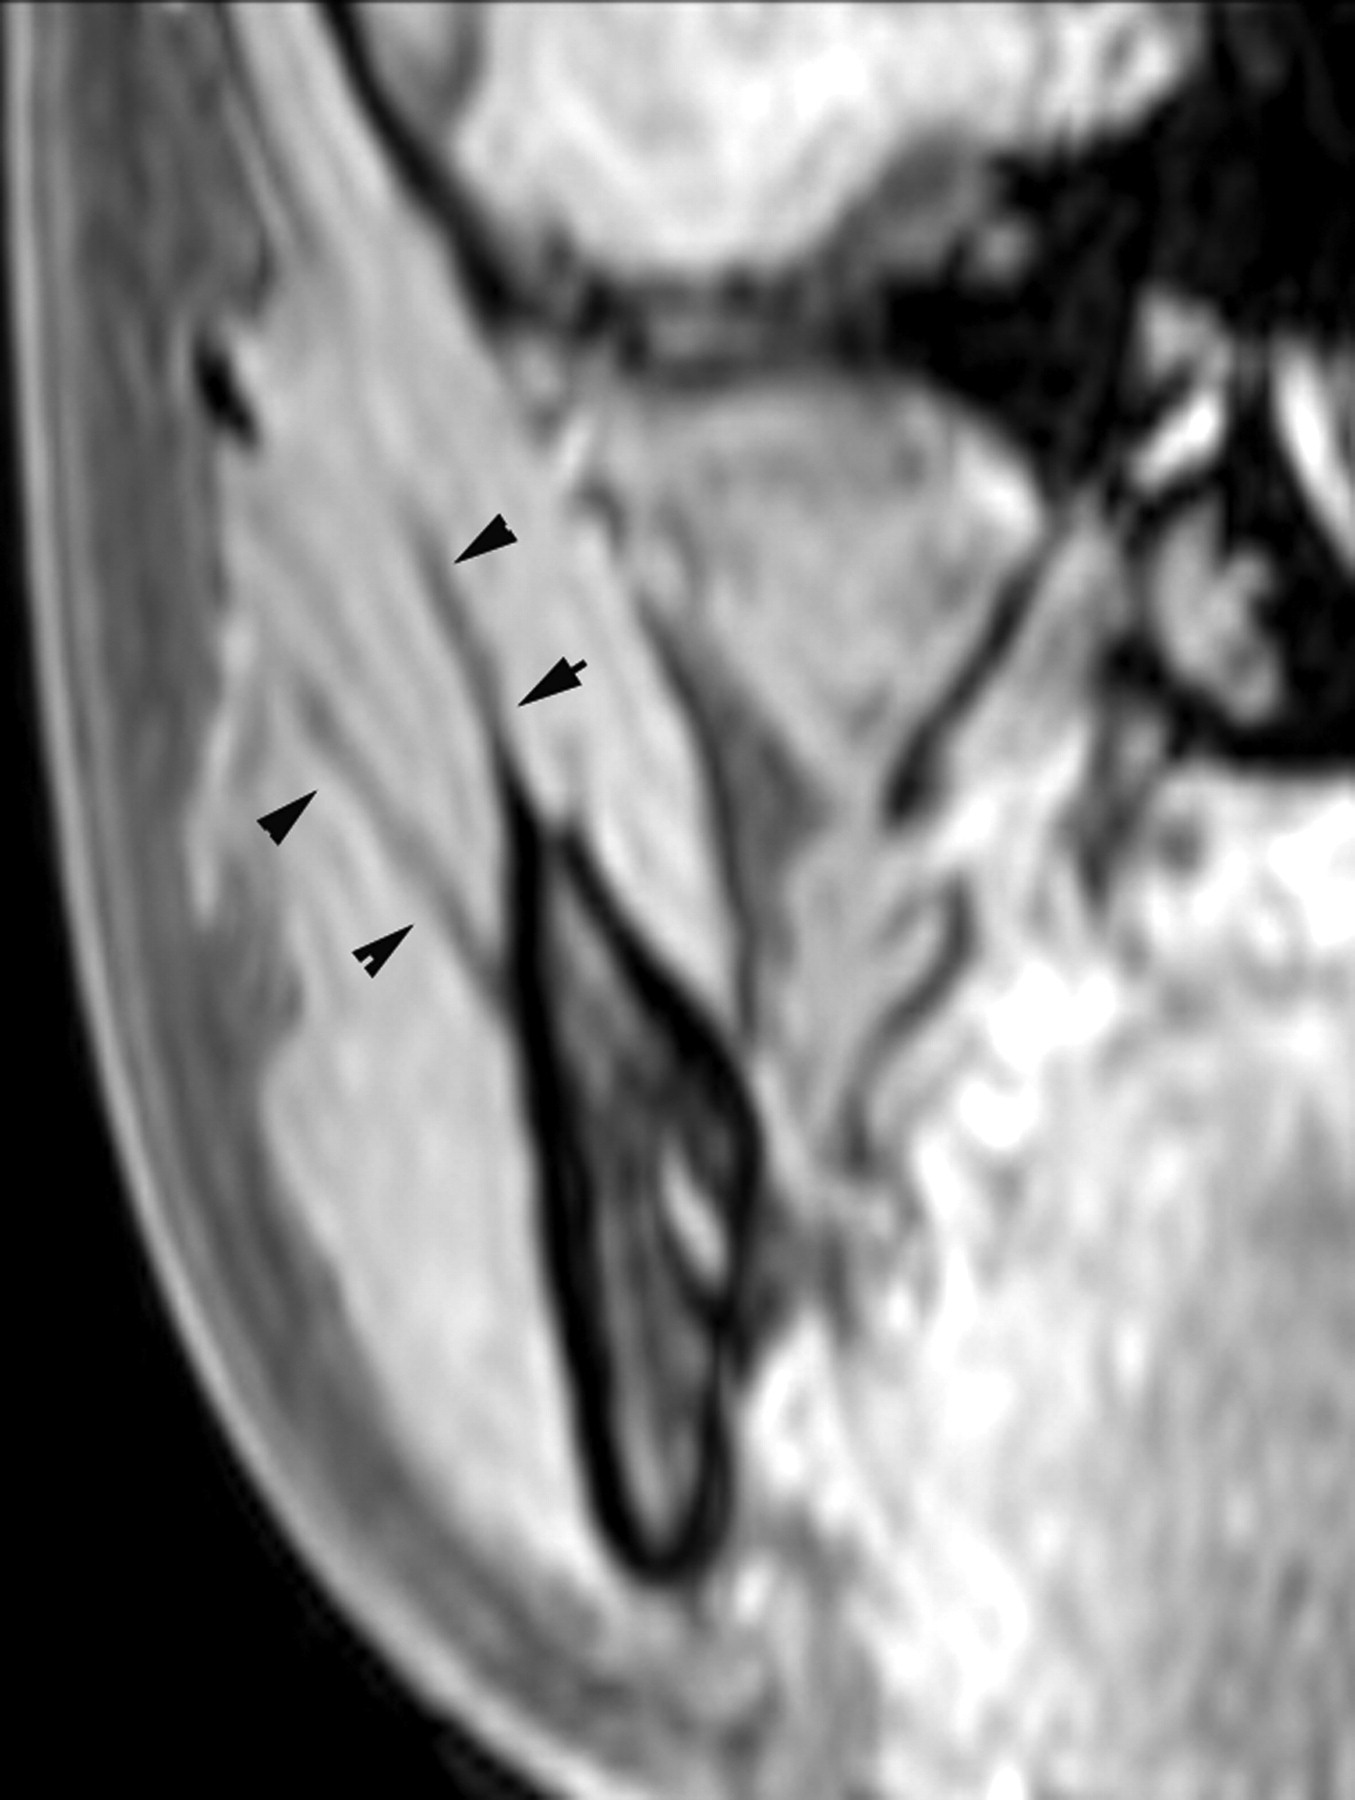
Representative reformatted THRIVE images of the masseter muscles (MMs). Tendinous sheets were identifiable in a hypointense signal (arrowheads). The tendinous sheets are marked in the superior site
It has been verified that the λ1 eigenvector is parallel to the long axis of the muscle fiber (10, 11). The λ2 eigenvector primarily reflects diffusion within the endomysium, perpendicular to the long axes of the muscle fibers. Also, it was assumed that the λ3 eigenvector mainly reflected diffusion within the individual fiber (10).
We suggest that passive elongation of muscle fibers by jaw opening results in a decrease in both λ2 and λ3, which reflects a decrease in myofibril size and accompanying shrinkage of the endomysium. In the present study, jaw-opening decreased λ2 and λ3 at the superior and middle sites, but it was not obvious at the inferior site.
The lengths of the fiber component before and after jaw opening varied with each muscle part. Previous studies have demonstrated that the fibers in the deep MM are subjected to the greatest stretch by jaw opening, whereas those in the posterior superficial MM undergo the least stretch. The postulated change in the length of the sarcomere is similar to that of the fiber (22, 23). We consider that this is the reason that the changes in the upper-site parameters (ADC, λ2, and λ3) caused by jaw opening were larger than those in the lower site.
λ1 and λ2 increased significantly with jaw closure, except for λ1 at the superior site. Among the three eigenvalues, the change in λ2 was greatest. We considered that the isometric contraction by clenching caused a structural change within the endomysium that resulted in an increase in λ2.
The first limitation of this study was the small number of volunteers. The second was the analysis method. If we had delineated the ROI, which included only the specific layer, and had performed more sophisticated tractography such as probabilistic tractography, the tract-based spatial statistics could have resulted in more accurate information about the specific layer. However, such analyses were impossible due to image distortion, particularly near the maxillary sinus, difficulties in setting ROIs in the specific layer, and uncertain tractography for skeletal muscle. Therefore, further studies are needed to confirm the results of our preliminary study. The third limitation was the effect of the motion artifact, particularly during jaw closure. Although SS SE-EPI was relatively insensitive to influences from macroscopic patient motion because of the very fast readout, multiple averaging and the various MPG directions increased acquisition time, which are uncertainties for quantitative analyses. The motion artifact caused a decrease in the contrast-to-noise ratio, an increase in ADC scattering, and decrease in FA, particularly during jaw closure. To overcome these problems, segmented acquisition techniques, in which the k-space is covered by several rotated rectangular strips, each consisting of a fast-spin echo train such as MultiVane (Philips Medical Systems, Best, The Netherlands) or BLADE (Siemens Healthcare, Erlangen, Germany) will be needed.
In conclusion, the diffusion parameters differed at different levels of MM, which may reflect the complex anatomy of the muscle. Moreover, recruitment of muscle fibers specific to jaw position was reflected in differing changes in muscle diffusion parameters. Differences between rest and closure at the inferior and middle sites of the muscle approached significance; however, those between rest and opening were limited in the superior and middle site of the muscle, indicating the task-dependent differential activation of superficial and deep masseter fibers.