




Abstract
Background
Chondromyxoid fibroma is a rare benign primary bone tumor of cartilage. Despite a characteristic radiographic appearance, chondromyxoid fibroma with atypical radiographic findings may mimic more common tumors.
Purpose
To describe the MR findings of chondromyxoid fibroma.
Material and Methods
MR images of 19 histopathologically confirmed chondromyxoid fibromas were retrospectively analyzed for signal intensity, periosteal reaction, adjacent abnormal bone marrow and soft tissue signal, and patterns of contrast enhancement.
Results
All cases of chondromyxoid fibroma showed hypointense to intermediate signal intensity and internal hyperintense foci were observed in seven (37%) cases on T1-weighted images. On T2-weighted images, all lesions were hyperintense: peripheral intermediate signal band with central hyperintense signal in 11 (58%) of 19 lesions, whereas diffusely hyperintense with heterogeneous pattern in eight (42%). Periosteal reaction was observed in 11 (58%) of 19 cases. Adjacent abnormal bone marrow or soft tissue signal was observed in 12 (63%) or 14 (74%) of 19 cases, respectively. On contrast-enhanced T1-weighted images, peripheral nodular enhancement was observed in 69% (11/16) and diffuse contrast enhancement was observed in 31% (5/16) with homogeneous (n = 3) or heterogeneous (n = 2) patterns. Among the cases with peripheral nodular enhancement, the peripheral nodular enhancing portion generally corresponded to the peripheral intermediate signal band on T2-weighted images, although the peripheral enhancement was not as wide as a band of intermediate signal intensity. On the other hand, the central non-enhancing portion generally corresponded to the central hyperintense signal intensity on T2-weighted images.
Conclusion
The helpful features of chondromyxoid fibroma are the peripheral intermediate signal band and central hyperintense signal on T2-weighted images, generally corresponding to the peripheral nodular enhancement and central non-enhancing portion on contrast-enhanced T1-weighted images, respectively.
Chondromyxoid fibroma (CMF) is a relatively rare benign primary bone tumor of cartilage and contains varying amounts of chondroid, fibrous, and myxoid tissue (1–4). Despite a characteristic radiographic appearance, CMF with atypical radiographic findings may mimic more common tumors (5). Also, it is sometimes difficult to identify CMF histopathologically because it may be confused with more aggressive tumors (4, 6, 7). Intralesional curettage alone increases local tumor recurrence in CMF, although it is a usual treatment option in other benign cartilaginous tumors (8, 9). The preferred treatment of CMF tends to be curettage and packing with bone chips or polymethylmethacrylate, or complete local excision with tumor-free margin (8–10).
To our best knowledge, the MR findings of CMF have not been fully described yet. Therefore, the purpose of this study is to describe the MR findings of CMF.
Material and Methods
Patients
This study was approved by the institutional review board and complied with HIPAA guidelines. The requirement for informed consent was waived for this retrospective study. From October 1995 through February 2006, 19 patients were retrospectively identified who have a histopathologic diagnosis of CMF and had MR imaging of the lesion. There were nine men and 10 women, aged 8–65 years of age (mean 29 years) without any significant differences associated with these factors. All patients with CMF underwent curettage except for one patient who had marginal excision with juxtacortical lesion. Histological diagnosis of the CMF was based on commonly accepted histological criteria.
MR imaging
MR imaging was performed with various 1.5-T systems (Signa Advantage, GE Healthcare, Milwaukee, WI; Magnetom, SP 4000, Siemens Medical Systems, Iselin, NJ, USA; Intera Achieva, Philips Medical Systems, Best, The Netherlands; Twin Speed, GE Healthcare, Milwaukee, WI, USA). Appropriate coil and field of view were selected for the expected area of involvement. Imaging parameters and planes varied since MR imaging was obtained at several institutions. T1-weighted (TR/TE 450–1002/10–21 ms) images and fast spin-echo T2-weighted images (TR/TE 3000–4900/63–112 ms) were obtained in the axial plane except for one patient. Fat-suppressed fast spin-echo T2-weighted images (TR/TE 3000–5900/63–112 ms) were obtained for one orthogonal plane in all patients. In 16 patients, T1-weighted images were obtained again after intravenous administration of 0.1 mmol per kg of body weight of gadopentetate dimeglumine (Magnevist; Bayer Healthcare Pharmaceuticals, Wayne, NJ, USA). After contrast enhancement, T1-weighted images were obtained with fat suppression in 14 patients. MR imaging parameters included the following: field of view 10–28 cm, either one signal or two signals acquired, matrix size 256 × 192–256, section thickness 3–5 mm, intersection gap 1.5–2 mm; and echo-train length 8–16 for T2-weighted images.
Evaluation of MR images
MR images of histopathologically proven CMF were retrospectively analyzed for signal intensity, internal hypointense band, fluid levels, periosteal reaction, adjacent abnormal bone marrow and soft tissue signal, cortical erosion, and patterns of contrast enhancement. On T1-weighted images the reference was to normal adjacent muscle with resulting hypointense (less than that of muscle), intermediate (similar to muscle) and hyperintense (greater than muscle) categories. On T2-weighted images tumor was compared to normal fat with three categories of hypointense, intermediate, and hyperintense. The MR images were reviewed independently by two musculoskeletal radiologists and any disagreements were discussed until a consensus was reached. Two reviewers knew beforehand that all patients had histopathologically confirmed CMF. In one patient who had marginal excision with juxtacortial CMF, gross specimen was available and correlation with MR findings was made.
Results
CMF were located in the distal femur (n = 4), proximal tibia (n = 3), distal tibia (n = 3), metatarsal bone (n = 3), ilium (n = 3), proximal femur (n = 1), pubic bone (n = 1), and temporal bone (n = 1). Among 11 patients involving long tubular bones, lesions involved the metaphysis (n = 5); metaphysis extending to epiphysis (n = 3); metaphysis extending to epiphysis and diaphysis (n = 1); and metaphysis extending to diaphysis (n = 2). Among 11 patients involving long tubular bones, the position with regard to the longitudinal axis was eccentric (n = 8), cortical (n = 2), and juxtacortical (n = 1), while all lesions were in the central position in three patients involving short tubular bones. Multiple lesions were not observed in any case, however there was no systematic search for multiple lesions in the study population.
T1-weighted images showed hypointense to intermediate signal intensity throughout the lesions. Internal hyperintense foci were observed in seven (37%) of 19 cases on T1-weighted MR images. On T2-weighted images, all lesions were hyperintense: peripheral intermediate signal band with central hyperintense signal in 11 (58%) of 19 lesions (Figs. 1 and 2), whereas diffusely hyperintense with heterogeneous pattern in eight (42%) (Fig. 3). Internal low signal bands were observed in all cases. There was one case with fluid level (Fig. 1). Periosteal reaction was observed in 11 (58%) of 19 cases, whereas periosteal reaction was present in all 14 cases involving tubular bones. Adjacent abnormal bone marrow signal was observed in 12 (63%) of 19 cases and adjacent abnormal soft tissue signal was observed in 14 cases (74%). Adjacent abnormal bone marrow and soft tissue signals were observed in all three central lesions involving short tubular bones. Among 11 cases involving long tubular bones, adjacent abnormal bone marrow and soft tissue signals were observed in one juxtacortical lesion, and one of two cortical lesions, while among eight cases with eccentric involvement of long tubular bones, four cases showed adjacent abnormal bone marrow signal and five cases showed adjacent abnormal soft tissue signal. Ten (53%) of 19 lesions showed cortical erosions. On contrast-enhanced images, peripheral nodular enhancement was observed in 69% (11/16) (Figs. 1, 2 and 4) and diffuse contrast enhancement was observed in 31% (5/16) with homogeneous (n = 3) (Fig. 3) or heterogeneous (n = 2) patterns. Among the cases with peripheral nodular enhancement, the peripheral nodular enhancing portion generally corresponded to the peripheral intermediate signal band on T2-weighted images, although the peripheral enhancement was not as wide as a band of intermediate signal intensity. On the other hand, the central non-enhancing portion generally corresponded to the central hyperintense signal intensity on T2-weighted images.

Chondromyxoid fibroma of distal femur in a 25-year-old man. (a) Radiograph shows an intracortical osteolytic lesion (arrows) in the distal metaphysis of the femur. Periosteal reaction (arrowheads) is present. (b) Axial T1-weighted image reveals a hypointense mass (arrows). (c) Fluid level (arrowheads) is present within the mass on sagittal T2-weighted image. (d) Axial T2-weighted image demonstrates peripheral intermediate signal band (arrowheads) with central hyperintense signal intensity (*). (e) Axial fat-suppressed contrast-enhanced T1-weighted image shows peripheral nodular enhancement (arrowheads). Peripheral enhancing portion generally corresponds to peripheral intermediate signal band on T2-weighted image, although the peripheral enhancement was not as wide a band of intermediate signal intensity. On the other hand, the central non-enhancing portion generally corresponded to the central hyperintense signal intensity on T2-weighted images. Adjacent abnormal bone and soft tissue enhancement is present

Juxtacortical chondromyxoid fibroma of distal femur in a 53-year-old woman. (a) Radiograph shows an eccentric osteolytic lesion and cortical expansion with cortical shell (arrows) in the anterior portion of the distal metaphysis of femur. (b) Axial T1-weighted image shows a juxtacortical, hypointense mass (arrows). The marrow canal is not involved. (c) Axial T2-weighted image reveals a peripheral intermediate signal band (arrowheads) with central hyperintense signal intensity. Internal septations are present. (d) Axial fat-suppressed contrast-enhanced T1-weighted image demonstrates peripheral nodular enhancement (arrowheads) and central non-enhancing portion. Internal septations show contrast enhancement. Peripheral nodular enhancing portion generally corresponds to the peripheral intermediate signal band on T2-weighted image, although the peripheral enhancement was not as wide a band of intermediate signal intensity. On the other hand, the central non-enhancing portion generally corresponded to the central hyperintense signal intensity on T2-weighted images. Adjacent abnormal soft tissue enhancement (arrows) is present. (e) On gross specimen, peripheral fibrous tissue (arrowheads) generally corresponds to the peripheral intermediate signal band on T2-weighted image and peripheral nodular enhancing portion on contrast-enhanced T1-weighted image. Whereas, internal myxoid area (*) generally corresponds to the central hyperintense area on T2-weighted image and central non-enhancing area on contrast-enhanced T1-weighted image
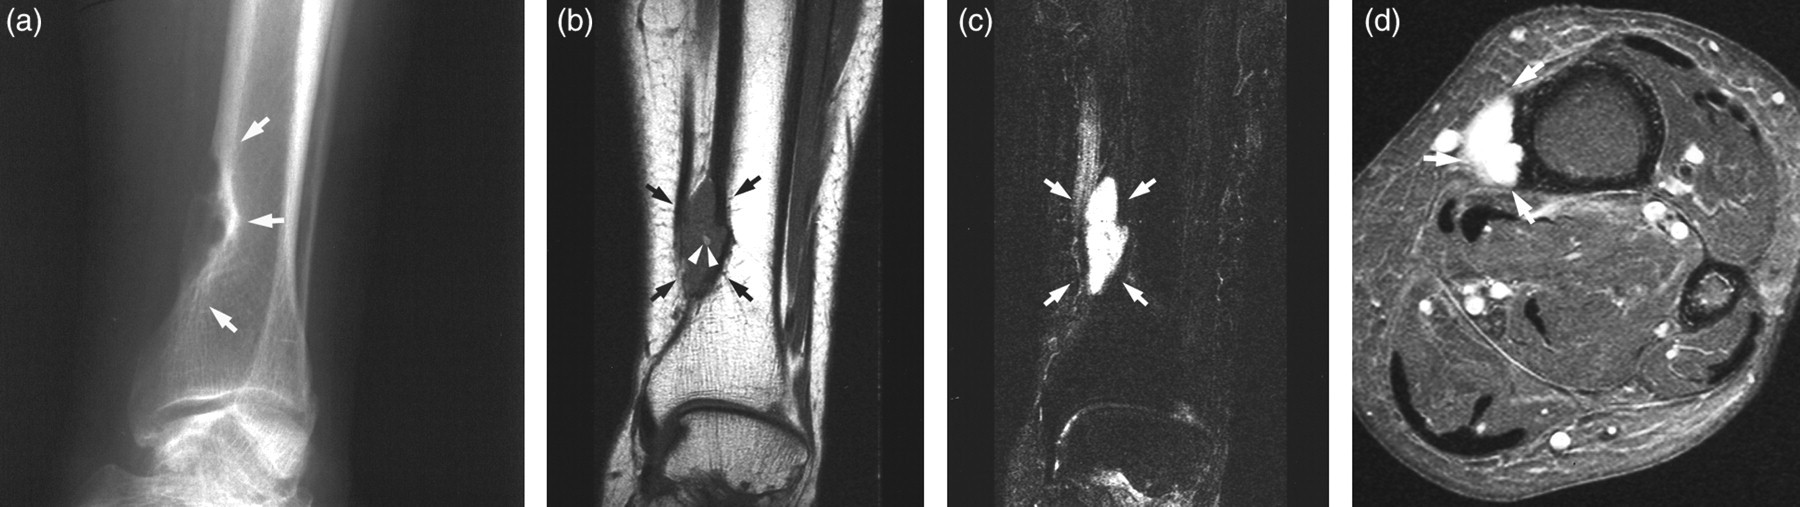
Chondromyxoid fibroma of the distal tibia in 65-year-old woman. (a) Radiograph shows a well-defined, cortical osteolytic lesion (arrows) in the distal metaphysis of tibia. (b) Coronal T1-weighted image reveals a hypointense mass (arrows) with internal hyperintense focus (arrowheads). (c) On coronal fat-suppressed T2-weighted image the lesion is heterogeneously hyperintense (arrows). (d) Axial fat-suppressed contrast-enhanced T1-weighted image demonstrates a diffuse enhancement of the mass (arrows)
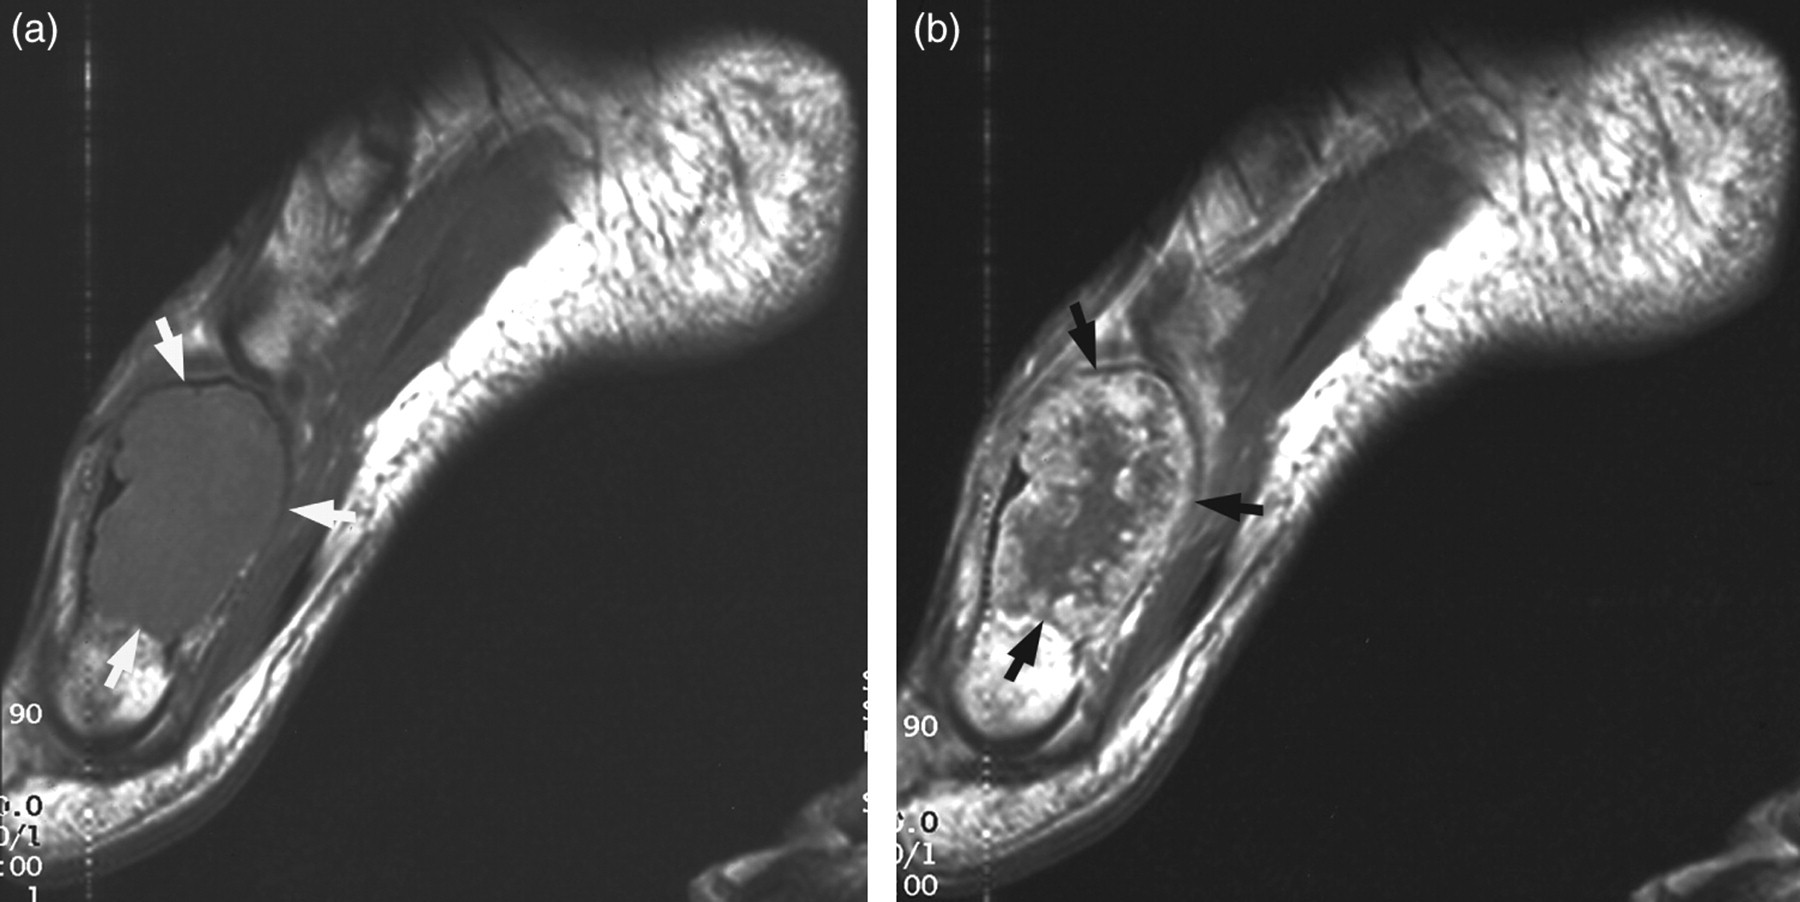
Chondromyxoid fibroma of the metatarsal bone in 14-year-old boy. (a) Sagittal T1-weighted image reveals a hypointense mass (arrows) in the right first metatarsal bone. (b) Sagittal contrast enhanced T1-weighted image demonstrates peripheral nodular enhancement (arrows) and central non-enhancing portion
On the gross specimen in the patient with marginal excision, peripheral fibrous tissue generally corresponded to peripheral intermediate signal band on T2-weighted images and peripheral nodular enhancing portion on contrast-enhanced T1-weighted images, although the peripheral enhancement was not as wide as a band of intermediate signal intensity. The internal myxoid area generally corresponded to the central hyperintense area on T2-weighted images and central non-enhancing area on contrast-enhanced T1-weighted images.
Discussion
In 69% of our patients peripheral nodular enhancement was observed, generally corresponding to the peripheral intermediate signal band on T2-weighted images, whereas central non-enhancing portion generally corresponded to central hyperintense signal on T2-weighted images. In gross specimen of juxtacortical CMF, the peripheral fibrous tissue generally corresponded to peripheral intermediate signal band on T2-weighted images and peripheral nodular enhancing portion on contrast-enhanced T1-weighted images. Based on the gross specimen from one patient, the internal myxoid area generally corresponded to the central hyperintense area on T2-weighted images and central non-enhancing area on contrast-enhanced T1-weighted images. We assume that these MR findings might be also related to the peripheral condensation in the histology of CMF (2, 6, 11, 12). According to the previous case report (8), CMF showed peripheral nodular enhancement and central non-enhancing portion generally corresponding to hyperintense portion on T2-weighted images, similar to our MR findings. Even in the macroscopic aspect of the resected specimen a centrally located myxoid portion and peripheral, more cellular, connective tissue was observed in the report (8), consistent with the MR findings. Similarly, it was described that CMF showed chondromyxoid matrix with peripheral fibrosis at histology (11). In the remaining 31% of our cases there was diffuse contrast enhancement, consistent with the MR findings described in the previous case reports (12 − 15).
Epiphyseal extension was seen in four (36%) of 11 patients involving long bones in this study, similar to the previous reports (5, 6). At MRI internal low signal bands of septation were seen in all patients, whereas septations were seen in 66% of 38 cases on radiographs in a previous report (5). In our study, there was one case with fluid level indicating hemorrhage due to secondary aneurysmal bone cyst changes, a non-specific finding occurring in bone tumors and tumor-like lesions such as aneurysmal bone cyst, teleangiectatic osteosarcoma, chondroblastoma, giant cell tumor, fibrous dysplasia, and simple bone cyst (16). Cortical erosions were observed in 53% in our patients. It is more than previously reported (32%), but this finding was based on radiography (5). In the current study, also periosteal reaction was more frequent (58% vs 40%). In particular, except five cases involving flat bones, periosteal reaction was observed in all 14 cases involving tubular bones. These differences are probably related to the higher sensitivity of MRI. According to the previous report (6), at histology soft tissue extension was unexpectedly observed in 30% of CMF. Adjacent abnormal soft tissue signal was observed in 74% of patients in this study, probably secondary to the edema. Adjacent abnormal bone marrow and soft tissue signals were observed in all of three central lesions involving short tubular bones and one juxtacortical lesion involving long tubular bones, whereas observed in about half of the eccentric and cortical lesions involving long tubular bones.
In CMF, aneurysmal bone cyst, non-ossifying fibroma, giant cell tumor, and chondrosarcoma can be included in the differential diagnosis in addition to enchondroma in short bones. In addition to the radiographic findings, some reported MR findings are helpful for the differential diagnosis. Aneurysmal bone cysts reveal cystic lesions with fluid levels. Nonossifying fibroma shows diffuse, hypointense signal in about 80% (15/19) on T2-weighted images (17). Giant cell tumors commonly have low signal portions on T2-weighted images (18, 19). In enchondroma and chondrosarcoma, areas of low signal intensity probably due to matrix mineralization can be observed in addition to very high signal intensity with T2-weighted sequences (20). Most chondrosarcomas show ring-and-arc pattern enhancement and tend to enhance diffusely in high grade (21). Adjacent abnormal bone marrow or soft tissue signal is uncommon in enchondroma unless pathologic fracture is associated.
This study is limited by the retrospective nature of the study and bias in that the MR reviewers knew beforehand that all patients had histopathologically confirmed CMF. This may have increased the detection of each MRI feature examined in this study. Another limitation is the small number of CMF cases due to rarity in the patient population. MR imaging was performed at several institutions, therefore imaging parameters and planes varied. The range of TE (63–112 m/s) gives different tissue contrast. Since SNR is decreased as effective TE is increased, the differences in T2-weighted images have been maybe the most marked (22). Correlation with MR and gross findings was made in one patient who had marginal excision.
In conclusion, the helpful features of CMF is the peripheral intermediate signal band and central hyperintense signal on T2-weighted images, generally corresponding to the peripheral nodular enhancement and central non-enhancing portion on contrast-enhanced T1-weighted images, respectively. MR imaging increases the diagnostic confidence in differentiating CMF from other cortical and corticomedullary lesions in addition to plain radiographs.