
Abstract
Background
Subtype differentiation of small renal cell carcinomas (RCCs) can provide more information to surgeons and patients and get more useful information about imaging features of small renal tumors.
Purpose
To evaluate the usefulness of the measurement of degree and heterogeneity of enhancement in subtype differentiation of small renal cell carcinomas (RCCs) by three-phase multidetector-row CT (MDCT).
Material and Methods
We reviewed 149 pathologically confirmed small (<4cm) RCCs in 143 patients: 114 (clear cell), 17 (chromophobe), and 18 papillary (8 papillary type 1 and 10 papillary type 2). Scans in pre-contrast, corticomedullary, and nephrographic phases were obtained. We assessed the mean and standard deviation of the Hounsfield units (HU) in a region of interest (ROI) for the degree of enhancement and the heterogeneity of enhancement, respectively. We compared the attenuation values, and the degree and heterogeneity of enhancement among the subtypes.
Results
The clear cell type showed the highest enhancement and heterogeneity of enhancement followed by chromophobe and papillary types. There was a significant difference in enhancement between the clear cell and papillary types in the corticomedullary phase (P < 0.01), and between clear and non-clear cell types in the nephrographic phase (P < 0.05). Heterogeneity of enhancement showed a significant difference between clear cell and non-clear cell types in the corticomedullary phase (P < 0.05).
Conclusion
The measurement of degree and heterogeneity of enhancement on contrast-enhanced MDCT may be a simple and useful method to differentiate between the different types of small RCCs.
A renal cell carcinoma (RCC) is the most common of all kidney tumors: RCCs account for 80–90% of all renal neoplasms (1–3). RCCs are classically classified into subtypes based on histopathological appearance and the presence of genetic abnormalities. Clear cell, papillary, chromophobe, and collecting duct RCCs are representative subtypes. Classification has become an important theme due to a different prognosis and tumor behavior for each subtype (3, 4). The clear cell type, which accounts for approximately 70% of RCCs, has a poorer prognosis than the papillary or chromophobe type (2, 3, 5–10). It has also been reported that papillary type 1 has a better prognosis than papillary type 2 (5, 8, 11).
The incidence of small renal tumors has increased due to public awareness of health-related issues and the continued development of computed tomography (CT) modalities. Particularly, fast acquisition times and good spatial/temporal resolution associated with the use of multidetector-row computed tomography (MDCT) has resulted in highly sensitive radiological detection of small renal tumors (12–14). Therefore, the differential diagnosis of small RCCs from benign tumors has become very important. However, the differential diagnosis of a small renal mass, especially between benign and malignant tumors, is not easy due to similar imaging findings of each tumor, and the different features of small renal tumors compared with the usual features of large tumors. Subtype differentiation of small RCCs as one part of the differential diagnosis among small renal tumors is not easy because there have been very limited studies on subtype differentiation of small RCCs (15, 16).
It is known that a small RCC has a better prognosis and has less aggressive clinicopathological features (12, 13, 17). Most small RCCs can be treated with nephron-sparing surgery and the prognosis of small RCCs may not be different according to the subtype. Thus, subtype differentiation of small RCCs may be considered insignificant from a clinical point of view. However, subtype differentiation of small RCCs can provide more information to surgeons and patients, because the different prognoses are presented depending on the subtype of RCC (18). Furthermore, through this trial of subtype differentiation, we can get more useful information about imaging features of small renal tumors in the differentiation of RCCs from benign tumors or non-surgical malignancies, which is clinically very important.
The most commonly used imaging modality for a renal mass is CT. Although the resolution of an MDCT image is very high, and MDCT has multiplanar capability, the subjective assessment of imaging features may have a limited role in the differentiation of small renal masses. We need an objective standard for subtype differentiation of small RCCs on MDCT images. There have been several reports of histogram analysis of attenuation on a pre-contrast scan for differentiation of small renal tumors (19, 20).
There have been several reports about subtype differentiation of RCCs (3, 5, 8, 21, 22). It is known that the clear cell type usually shows bright heterogeneous enhancement on CT compared with other subtypes (3, 22). However, these studies included large masses and measurement of degree of enhancement only. Thus, we need an objective study that measures degree and heterogeneity of enhancement for subtype differentiation of small RCCs. We assumed the average and standard deviation of pixel attenuation in a mass on a contrast-enhanced image might represent the degree and heterogeneity of the enhancement. The purpose of this study was to evaluate the usefulness of the measurement of degree and heterogeneity of enhancement in the subtype differentiation of small RCCs on MDCT.
Material and Methods
The institutional review board approved this retrospective study and the requirement for patient informed consent was waived. From July 2001 to March 2009, 852 RCCs were diagnosed after radical or partial nephrectomies. Among 852 patients, we selected 143 according to the following inclusion criteria: (a) longest diameter of the tumor less than 4 cm; (b) patients underwent preoperative biphasic three-phase MDCT examinations; and (c) the RCC was not a rare subtype such as colleting duct carcinoma, unclassified RCC, or another very rare subtype.
There were 101 male and 42 female patients with a mean age of 57 years (age range 20–82 years). Average body weight and height were 66.6 ± 12.3 kg and 163.8 ± 10.3 cm, respectively. Four patients had two small RCCs. We reviewed 149 RCCs including 114 clear cell type, 17 chromophobe type, eight papillary type 1, and 10 papillary type 2 RCCs (Table 1).
Characteristics of patients and renal lesions
*Data are numbers of lesions (n = 149) and data in parentheses are percentages
CT exams were performed using MDCT scanners (LightSpeed Ultra, GE Healthcare, Milwaukee, WI, USA; Sensation 16; Siemens Medical Solutions, Malvern, PA, USA; Brilliance 64, Philips Medical Systems, Cleveland, OH, USA). A total of 2 mL/kg of body weight of non-ionic contrast material (nonionic Iopromide; Ultravist 370, Bayer Schering Pharma AG, Berlin, Germany) was administered by the use of a power injector (Envision CT; Medrad, Indianola, PA, USA) at a rate of 3 mL/s with a maximum volume of 100 mL. Scanning parameters were different according to the actual scanner that was utilized. However, each CT scanner used constant scanning parameters. The parameters were in the following ranges: 0.891–1.6 for pitch value, 0.5–0.75 s for rotation time, 5 mm for slice thickness and interval, 1.25–5 mm for reconstruction interval, X-ray tube voltage of 120 kVp, and an effective tube current of 150–250 mAs.
All patients underwent three-phase MDCT scans that consisted of pre-contrast, corticomedullary, and nephrographic phases. The pre-contrast scan was performed before the administration of contrast material. The scan delay times were 30–40 s for the corticomedullary phase and 150–180 s for the nephrographic phase. CT scans started 5 s after the attenuation value reached 100 Hounsfield units (HU) in the thoracic aorta by use of the bolus-tracking technique.
We evaluated the CT features based on the consensus of two experienced genitourinary radiologists by the use of a picture archiving and communications (PACS) workstation (Marotech, Seoul, Korea). We compared the age, sex, and weight of patients, attenuation values, degree and heterogeneity of enhancement among the four RCC subtypes. Finally, heterogeneity of enhancement among the CT scanners in each one of the RCC subtypes were compared.
To evaluate the attenuation values and degree of enhancement, the mean number of HU in a region of interest (ROI) circle was measured. The standard deviation of HUs in an ROI circle was considered as the heterogeneity of enhancement. To measure the maximum degree of enhancement, the ROI circle was located in an enhancing solid portion, avoiding cystic and necrotic areas. The ROI circle covered the maximal area of the enhancing solid portion and had a consistent location regardless of each scanning phase. In contrast, for the heterogeneity of enhancement, we measured the standard deviation of the HUs in a ROI circle as large as possible including cystic and necrotic areas. The attenuation values, degree, and heterogeneity of enhancement were analyzed using the Kruskal-Wallis test and Dunn's multiple comparison test. To evaluate the diagnostic validity of the attenuation values and degree of enhancement, we analyzed receiver-operating characteristic (ROC) curves and the cut-off values for differentiation of the subtypes with the highest accuracy.
Results
There were no significant differences in the age, sex, and weight distribution of the four subtypes (P > 0.05). There were no significant differences in the heterogeneity of enhancement among CT scanners (P > 0.05). The attenuation values and degree of enhancement of the four RCC subtypes are summarized in Table 2. The attenuation values among the subtypes did not show a significant difference as determined on pre-contrast scans (P > 0.05). The pattern and heterogeneity of enhancement with image features according to the subtypes are presented in Figs. 1–4.
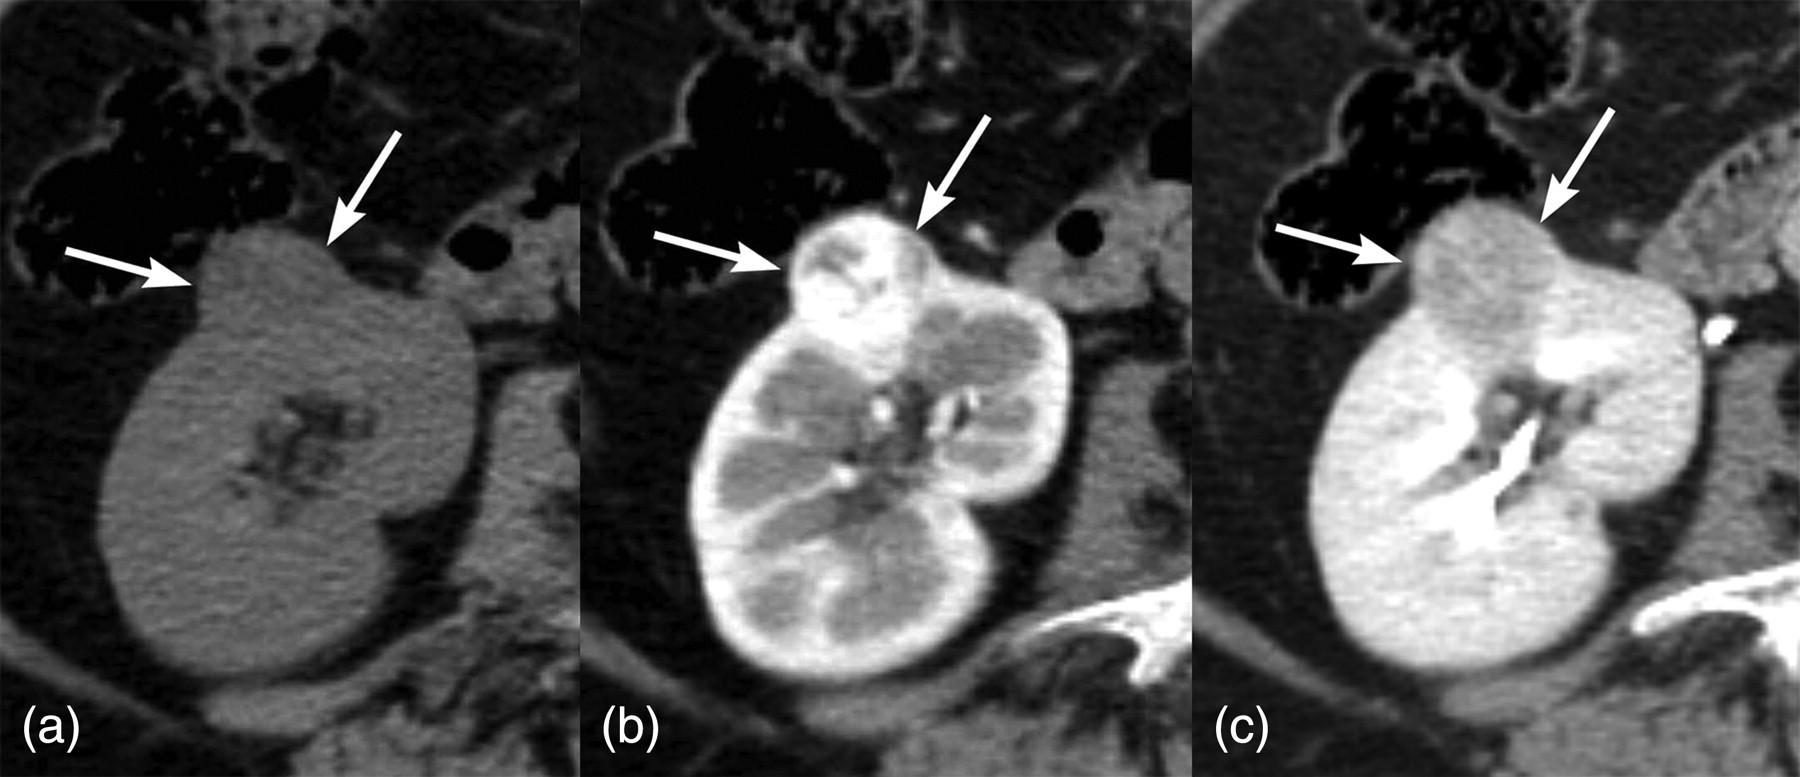
A 57-year-old woman with clear cell renal cell carcinoma. (a) A pre-contrast CT scan shows the presence of a well-defined extracapsular round mass (arrows) in the mid to lower pole of the right kidney with a size of 2 cm and attenuation value of 25 HU; (b) The attenuation value was measured as 188 HU with 46.67 HU of heterogeneity on a corticomedullary scan. This mass shows heterogeneous enhancement; (c) The attenuation value was 124 HU with 17.57 HU of heterogeneity as determined on a nephrographic scan

A 41-year-old woman with chromophobe type renal cell carcinoma. (a) A pre-contrast CT scan shows the presence of a well-defined intracapsular round mass (arrows) in the lower pole of the right kidney with a size of 2.2 cm and an attenuation value of 41 HU; (b) The attenuation value was measured as 106 HU with 17.6 HU of heterogeneity on a corticomedullary scan. This mass shows relatively homogeneous enhancement; (c) The attenuation value was 76 HU with 10.9 HU of heterogeneity as determined on a nephrographic scan
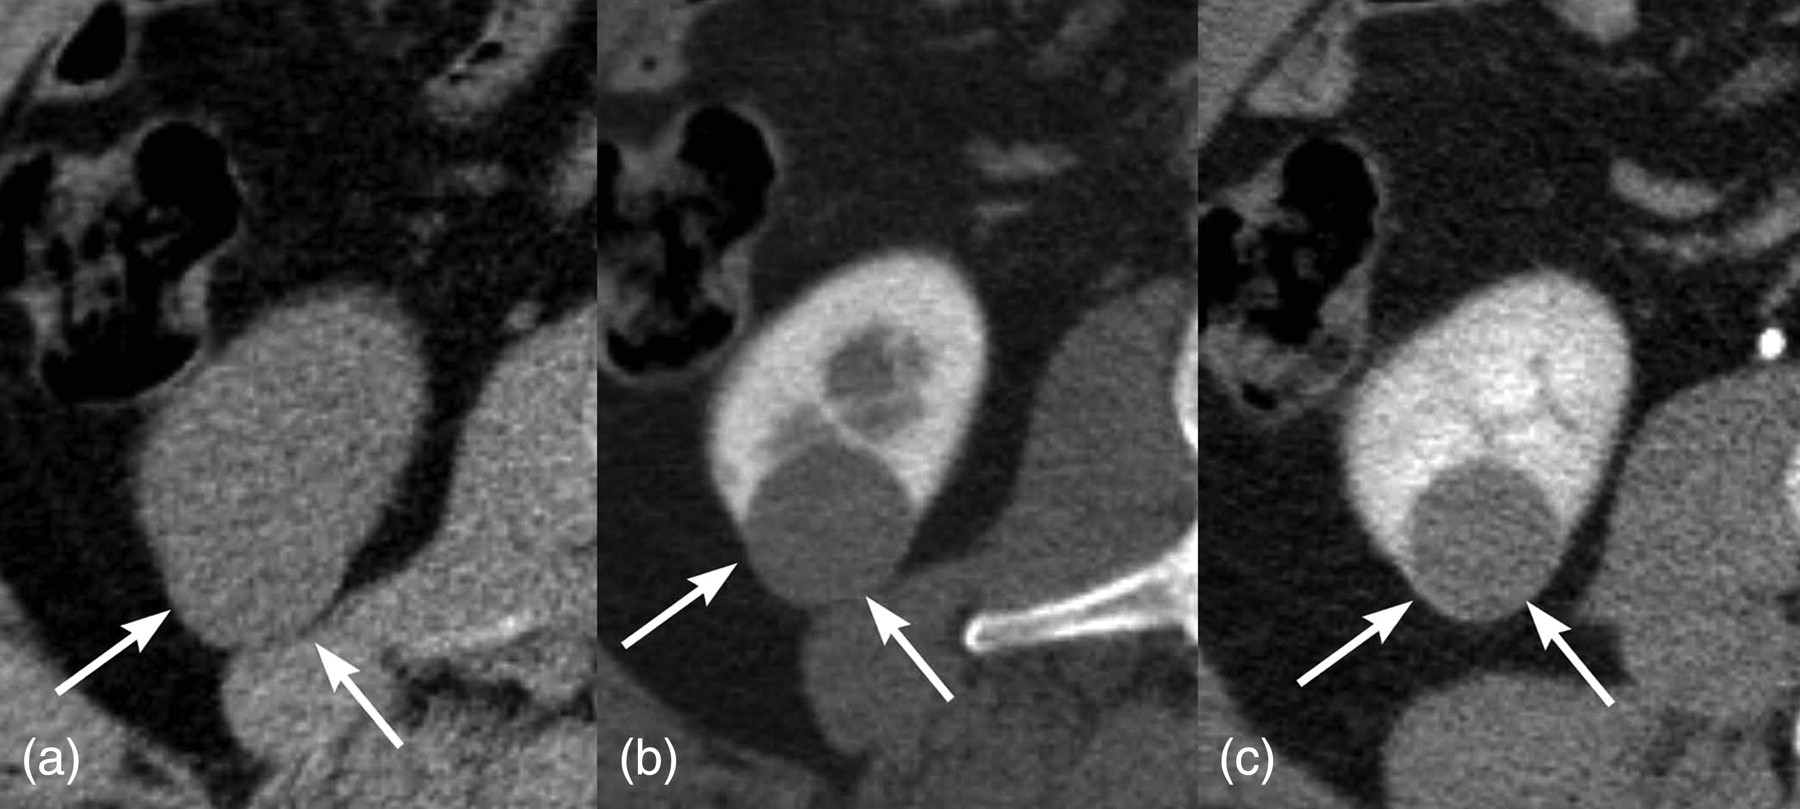
A 47-year-old man with papillary type 1 renal cell carcinoma. (a) A pre-contrast CT scan shows a well-defined extracapsular round mass (arrows) in the lower pole of the right kidney with a size of 2.7 cm and an attenuation value of 38 HU; (b) The attenuation value was measured as 77 HU with 19.49 HU of heterogeneity on a corticomedullary scan. This mass shows homogeneous enhancement; (c) The attenuation value was 74 HU with 24.09 HU of heterogeneity as determined on a nephrographic scan

A 61-year-old man with papillary type 2 renal cell carcinoma. (a) A pre-contrast CT scan shows a well-defined extracapsular round mass (arrows) in the mid pole of the right kidney with a size of 2.1 cm and an attenuation value of 15 HU; (b) The attenuation value was measured as 38 HU with 13.5 HU of the heterogeneity on a corticomedullary scan. This mass shows homogeneous enhancement; (c) The attenuation value was 41 HU with 18.15 HU of the heterogeneity as determined on a nephrographic scan
Attenuation values and degree of enhancement according to the four subtypes
*Difference of the attenuation values between corticomedullary phase and pre-contrast phase
†Difference of the attenuation values between excretory phase and pre-contrast phase
All data are means ± standard deviation in Hounsfield units (HU)
Clear cell type showed the highest enhancement followed by chromophobe and papillary types. There was a significant difference of enhancement between clear cell and papillary types on the corticomedullary phase scans (P < 0.01). The difference between clear cell and chromophobe types was not significant in the corticomedullary phase scans. On the nephrographic phase scans, there was a significant difference of enhancement between clear and non-clear cell types (P < 0.05). However, there were no significant difference of enhancement between papillary type 1 and type 2 on both phases.
Clear cell type showed the highest heterogeneity of enhancement followed by chromophobe and papillary types. Heterogeneity of enhancement showed a significant difference between clear cell and non-clear cell types on the corticomedullary phase (P < 0.05). There was no significant difference of heterogeneity of enhancement between chromophobe and both papillary types (Table 3).
The heterogeneity according to the four subtypes
All data are means ± standard deviation in Hounsfield units (HU)
The ROC curves about the degree of tumor enhancement to differentiate the clear cell type from non-clear cell type and papillary type from non-papillary type RCCs are illustrated in Figs. 5 and 6. The area under the curve and the cut-off values are presented in the ROC curve analysis (Table 4). The ROC curves about the heterogeneity were analyzed to differentiate a clear cell type from non-clear cell type of tumor are shown on corticomedullary phase (Table 5, Fig. 7).
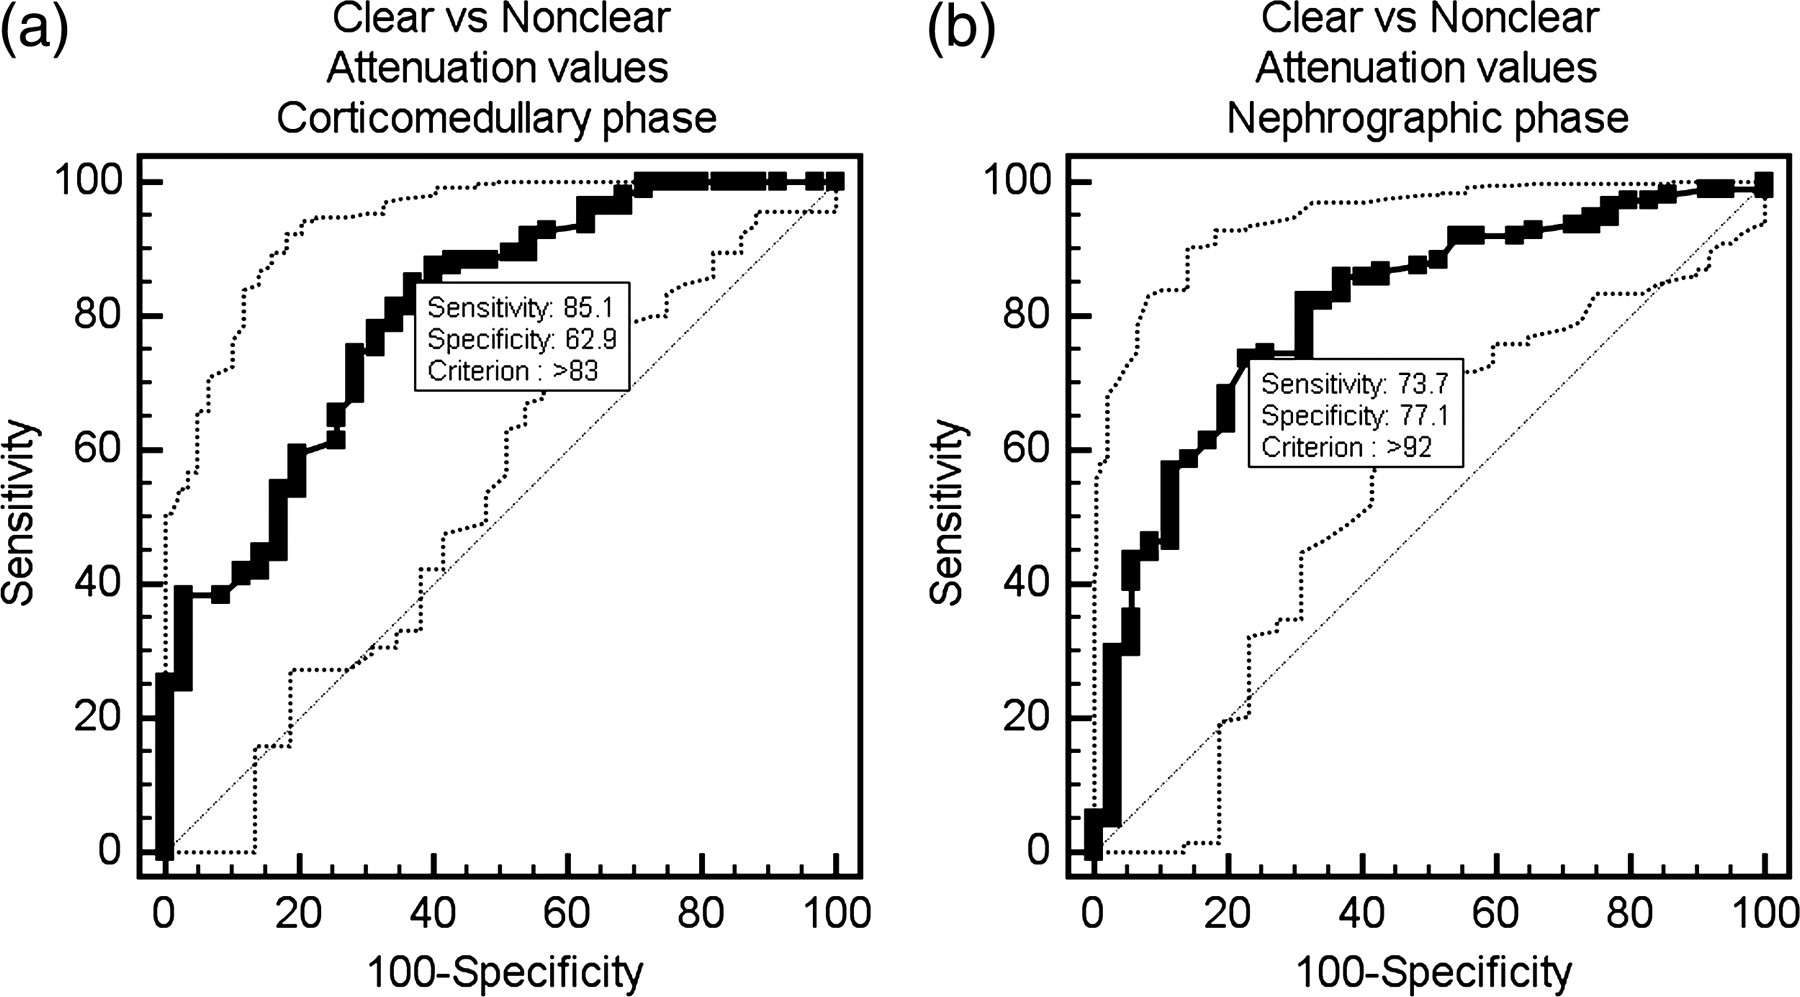
Receiver-operating characteristic curves for the attenuation values to differentiate the clear cell type from non-clear cell type of tumor are shown. (a) Corticomedullary phase; (b) Nephrographic phase
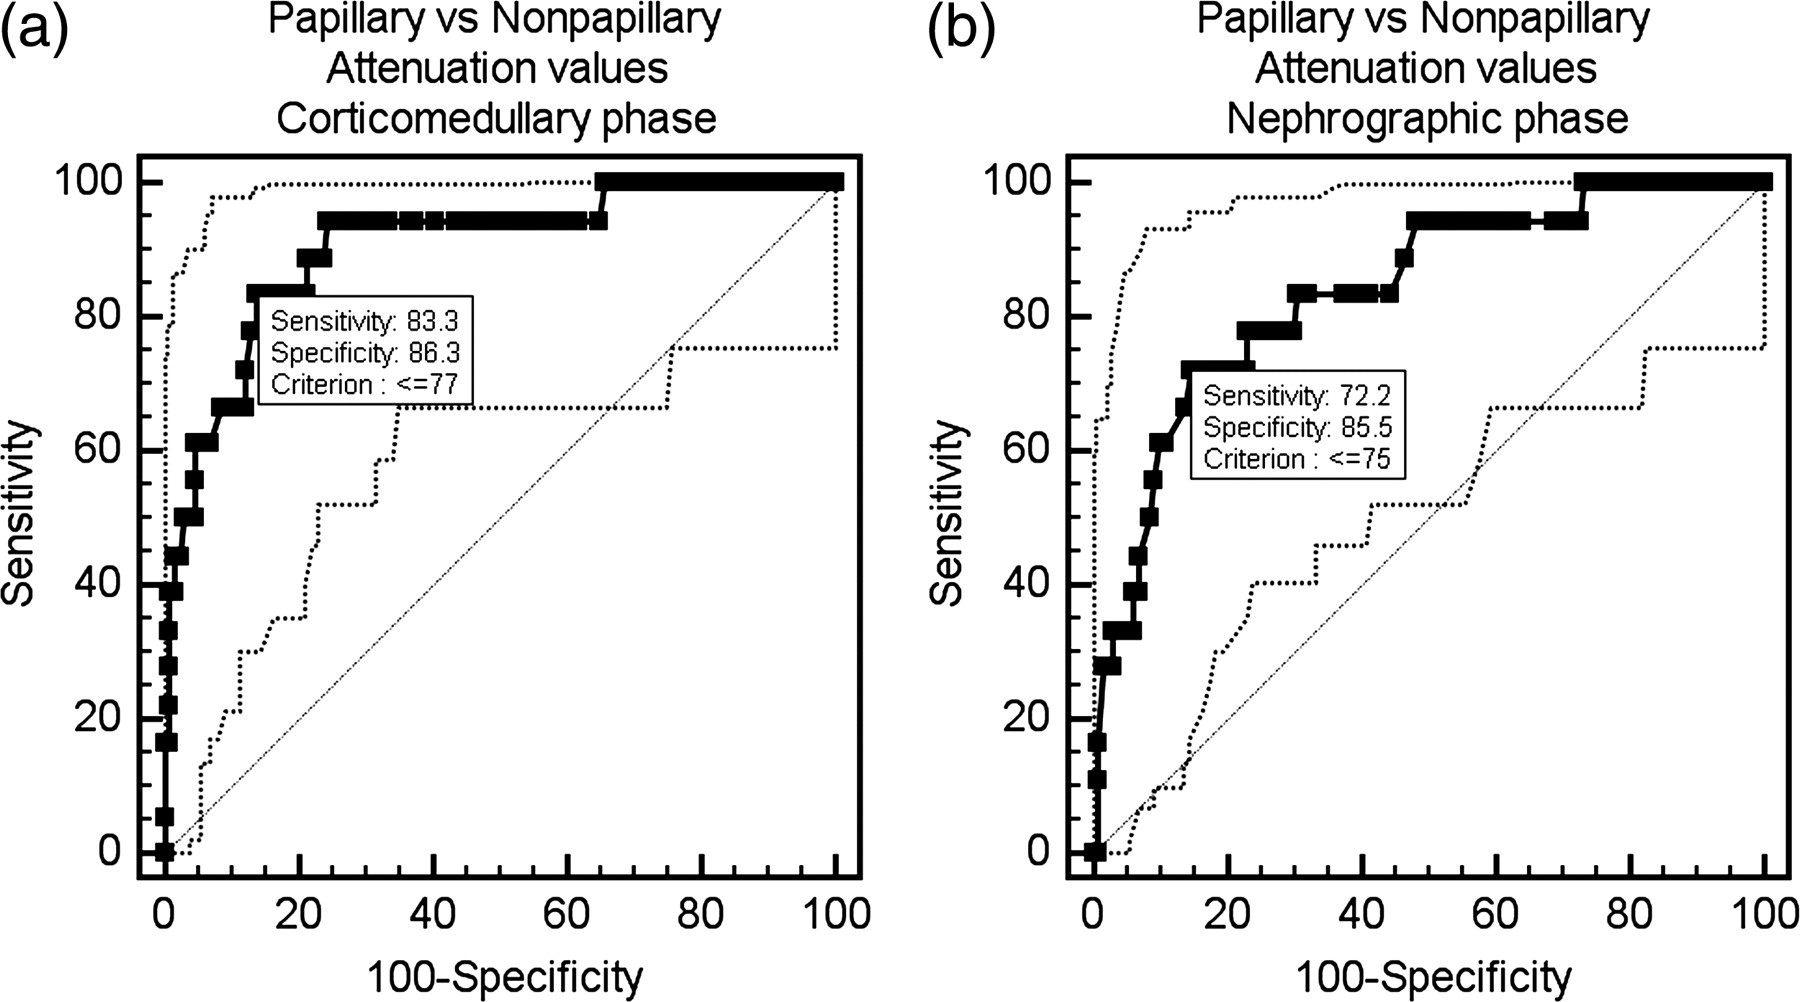
Receiver-operating characteristic curves for the attenuation values to differentiate a papillary cell type from non-papillary cell type of tumor are shown. (a) Corticomedullary phase; (b) Nephrographic phase
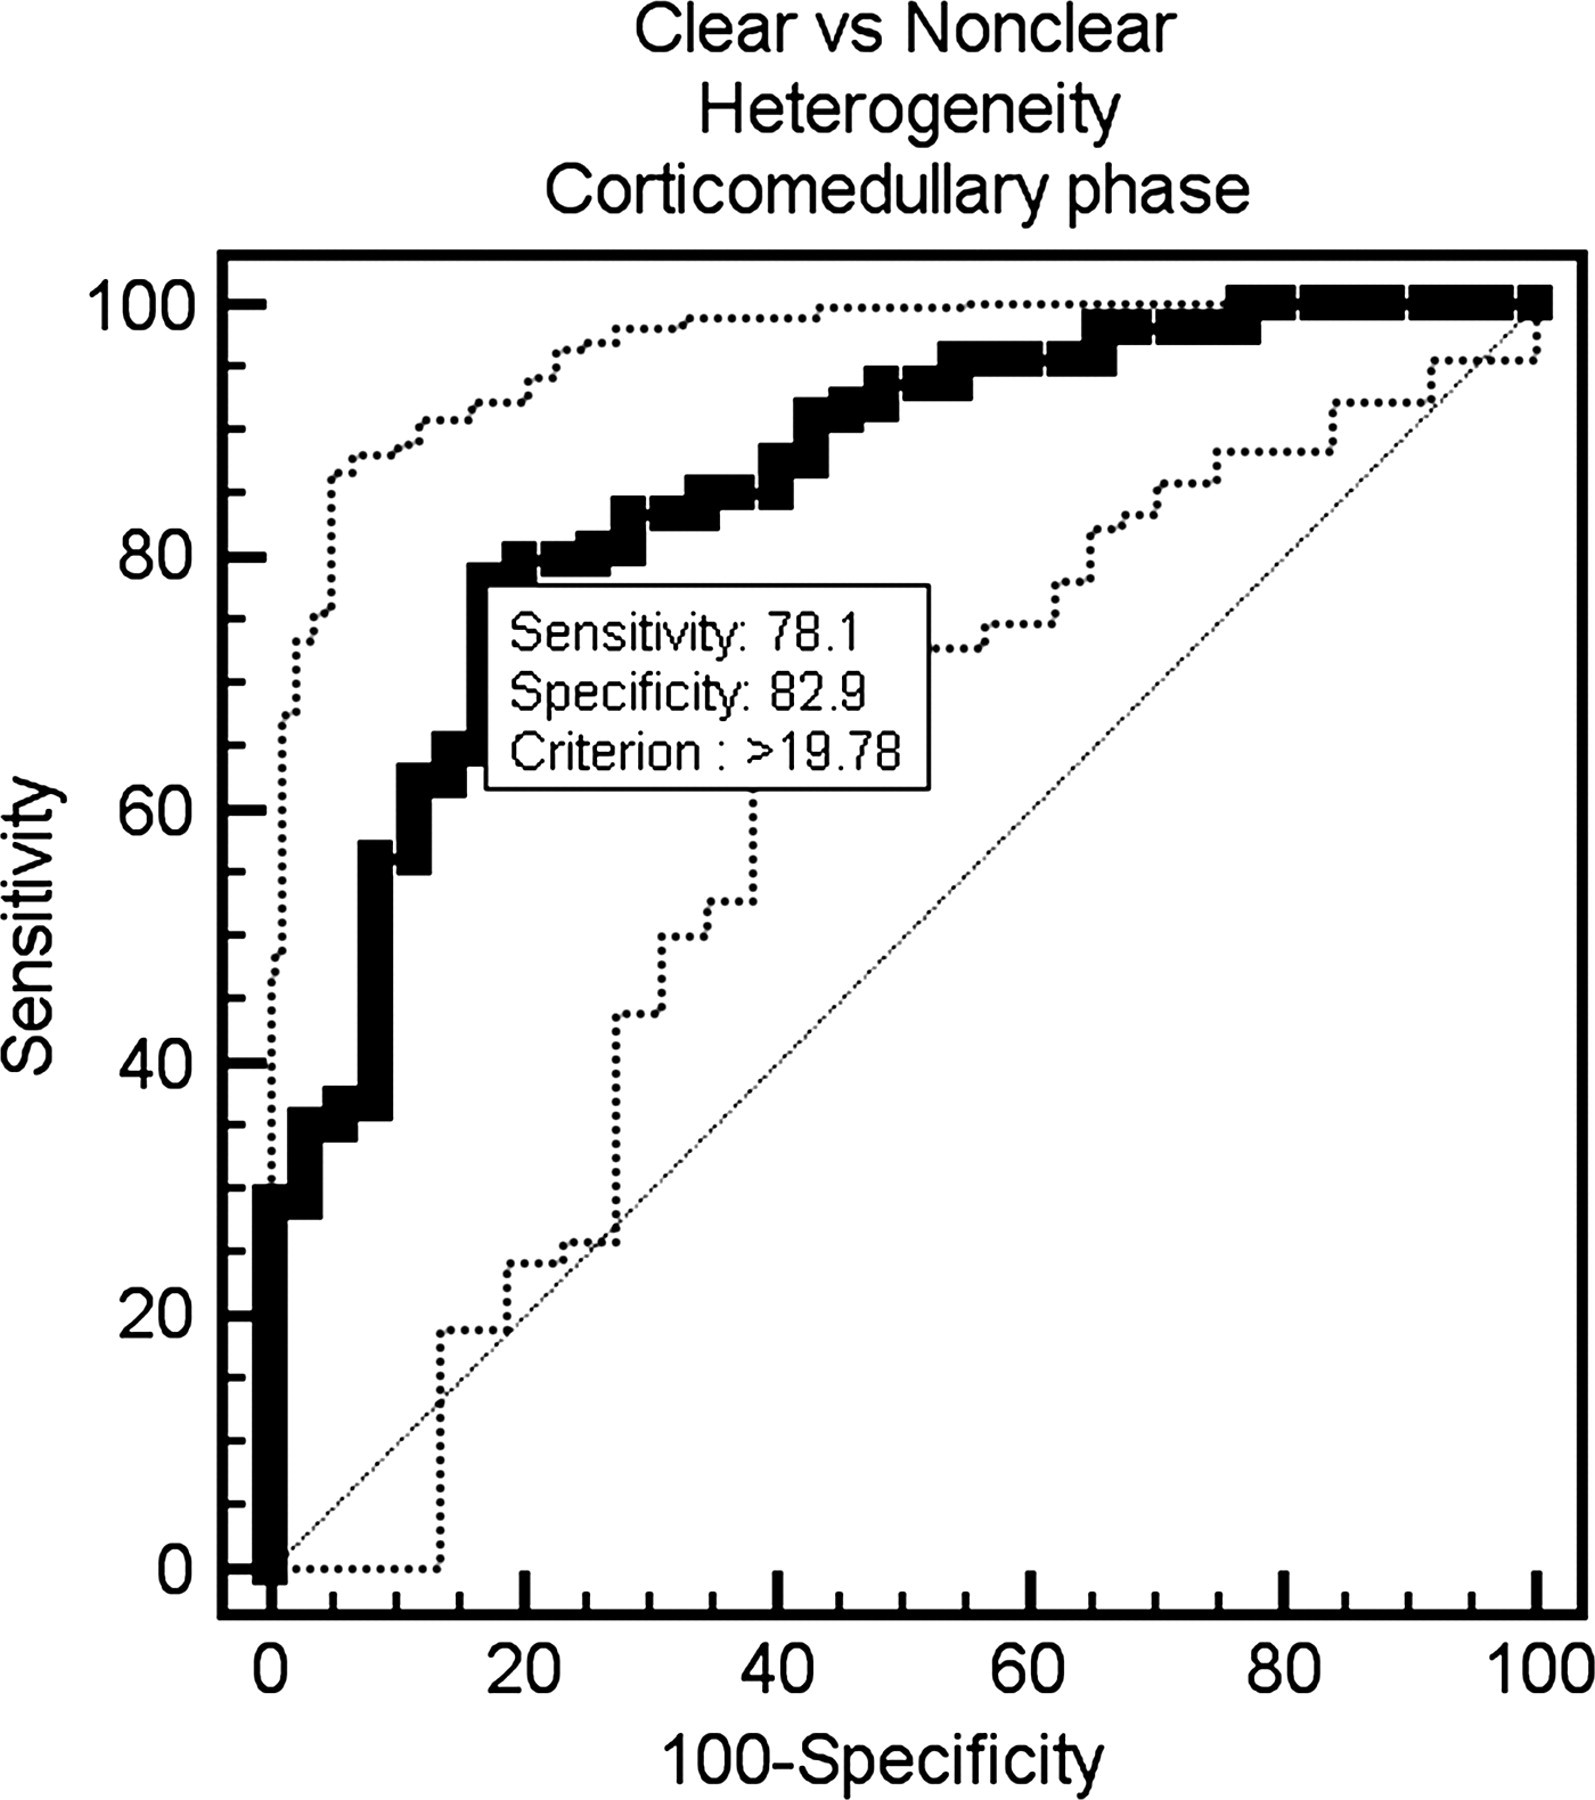
Receiver-operating characteristic curves for the heterogeneity to differentiate a clear cell type from non-clear cell type of tumor are shown in the corticomedullary phase
Target subtype versus others according to the cut-off values of attenuation values
*The units of cut-off values are Hounsfield units (HU)
†All values in parentheses indicate 95% confidence interval
Target subtype versus others according to the cut-off values of heterogeneity
*The units of cut-off values are Hounsfield units (HU)
†All values in parentheses indicate 95% confidence interval
Discussion
There have been several trials of subtype differentiation for small RCCs based on the degree of contrast enhancement. Fujimoto et al. proposed that the clear cell type has stronger enhancement than the other types of RCCs less than or equal to 5 cm, based on the use of dynamic CT scans (16). Masahiro et al. suggested that a cut-off value of 100 HU was useful to differentiate the clear cell type from non-clear cell type in small renal tumors less than 3.5 cm (15). Clear cell RCCs in this study also showed the highest enhancement, followed by chromophobe type and papillary type. Strong enhancement of a clear cell RCC has been thought to be caused by abundant vascularity and alveolar architecture as seen on histological analysis (4, 16).
Several studies have reported that the chromophobe type shows less enhancement than the papillary cell type regardless of tumor size (3, 22, 23) unlike our study. However, Jinzaki et al. compared the enhancement of small renal tumors less than 3.5 cm and reported the same result as in our study (15); Tsuda et al. reported similar results (24).
It is known that papillary type 2 is associated with a worse prognosis than papillary type 1 because it has a greater stage, grade, and microvascular invasion on pathological analysis since Delahunt and Eble described the two subtypes of papillary RCC (5, 11, 25). Mydlo et al. (8) reported a difference of enhancement between two types of papillary RCCs as depicted on CT scans. These investigators concluded that papillary type 2 had a higher degree of enhancement than papillary type 1. However, in the present study there was no difference of enhancement between the two types of small papillary RCCs, and a similarity of enhancement that was probably due to the small size of the tumors. Our study suggests that papillary RCCs have no different imaging features between the two subtypes when the tumors are small, but different features develop with tumor growth.
Evaluation of heterogeneity has been reported using various methods such as image interpretation or calculation of the difference between the highest and lowest attenuation values (15, 21, 22). Similar to our study, the difference between the highest and lowest attenuation values might be a useful method for the evaluation of the heterogeneity. However, if two different masses share the same highest and lowest attenuation values, the difference between the highest and lowest attenuation values will show the same value regardless of the area of each attenuation value in a mass. However, the standard deviation might differentiate between the masses because the standard deviation can reflect the area of each attenuation value in a mass. And the measurement of heterogeneity using the standard deviation of pixel attenuation values in an ROI circle is a very simple and easily applicable method. Although the standard deviation cannot exactly represent the heterogeneity of the pixel attenuation values, it may indirectly represent the heterogeneity because it may tell us how different from the mean the data points tend to be. It is known that a clear cell RCC is the most common tumor type seen with heterogeneous enhancement (22, 23). This feature was quantitatively measured and confirmed in the present study.
The attenuation values and the heterogeneity might be changed according to CT protocols such as scan times, injection rates, iodine concentrations of contrast media. In this view, our results can be applied to cases with similar CT protocols. However, the pattern of the enhancement and the heterogeneity are helpful to differentiate the subtypes of RCCs. Considering the scan time of our nephrographic phase, the attenuation values might be decreased in other nephrographic phases with further delayed scan times. However, the attenuation values might show no significant difference according to different iodine concentrations and injection rates with constant total iodine load (26, 27).
Some investigators have reported that hemorrhage and necrosis are significantly associated with the clear cell type tumor, which has poor prognosis (1, 22). In this study, however, intratumoral hemorrhage was more common in the chromophobe type and papillary type 2 than in the clear cell type (P < 0.05). In a study by Kim et al., calcification was more common in the papillary and chromophobe types than in the other types (22). However, we could not detect any association of the subtype with other morphological features including tumor margin, intratumoral calcification, and necrosis. The incidence of intratumoral calcification, hemorrhage, and necrosis in this study was much lower than reported in previous studies (3, 22, 23). This difference might be associated with tumor size. Smaller RCCs usually have a lower chance of intratumoral change. Therefore, subjective analysis based on morphological features may have limitations in the differential diagnosis of small RCCs.
This study had several limitations. It was a retrospective study and might have some degree of selection bias. We studied only pathologically confirmed RCC cases, and we did not include benign renal tumors in this study. There is a limitation in the application of the result. If a renal tumor turns out to be an RCC and not an AML, oncocytoma or some other benign lesion, the result would be helpful. A small number of non-clear cell type RCCs due to their rare incidence may be a second limitation. However, to the best of our knowledge, this study consisted of the highest number, to date, of patients enrolled in a study to determine the radiological differentiation of small RCCs less than 4 cm. The third limitation may be that all CT examinations were not performed using exactly the same protocol.
In conclusion, the measurement of attenuation value and heterogeneity of enhancement may be a simple and useful method in the subtype differentiation of small RCCs as evaluated on MDCT images.