
Abstract
Background
Q-space analysis is a new metric that uses multiple, high b-value, diffusion-weighted magnetic resonance (MR) data. This technique shows promising results as a tool to provide information complementary to that of other imaging techniques used on biological tissue in vivo.
Purpose
To investigate the use of a mean displacement (MDP) map of high b-value, q-space imaging (QSI) to characterize spinal and spinal cord lesions in vivo.
Material and Methods
Eight patients with spine or spinal cord disorders (two neurinomas, one myeloma, three cases of syringohydromyelia, and two cases of cervical spondylosis) were included. The MR imaging protocol consisted of conventional MR sequences, conventional diffusion-weighted imaging (DWI; b = 1000), and high b-value QSI with a maximum q value of 836.9 cm−1. Apparent diffusion coefficient (ADC) maps of conventional DWI and MDP maps of QSI data were obtained and region-of-interest analyses for the lesions were performed.
Results
MDP values of normal spinal cord, cerebrospinal fluid (CSF), and tumor parenchyma were 6.57 ± 0.52, 17.6 ± 2.75, and 8.49 ± 2.09, respectively (µm, mean ± standard deviation). In general, MDP maps were not well correlated with the corresponding ADC maps at the pathologic lesions. Spondylotic lesions tended to have higher MDP values than normal spinal cord, whereas syringohydromyelia produced MDP values slightly lower than those of CSF.
Conclusion
The heterogeneous MDP values were probably due to differences in tissues and pathologic structures. This technique has potential to provide additional clinical information to that obtained with conventional MR imaging.
Keywords
In addition to conventional magnetic resonance (MR) imaging, including T2- and T1-weighted imaging, diffusion-weighted imaging (DWI) is now applied as a non-invasive MR technique for assessing spine or spinal cord disorders in vivo. A DWI-derived parameter, apparent diffusion coefficient (ADC), has been used as a biomarker to estimate pathologic lesions, such as demyelinated lesions (1–3), infarction (4, 5), degeneration (6–10), and traumatic changes (11, 12).
Recently, q-space analysis (13–28) using high b-value diffusion-weighted MR data has been proposed as a different approach to measure diffusion of water molecules in neural tissues. Because neuronal tissue represents a complex environment, the decay of the diffusion signal is affected by many factors, including tissue compartment sizes, restriction of water, and intra- and extracellular water exchange. New approaches that do not assume a Gaussian shape for the underlying probability density function of the diffusion of water molecules seems to be a more precise estimation of structural information. Therefore, this technique shows promise as a tool to provide information complementary to that obtained with conventional MR imaging and DWI (15–23). However, few studies have investigated the usefulness of q-space imaging (QSI) for examining the human spinal cord in vivo (23).
The purpose of this study was to investigate the use of QSI mean displacement (MDP) maps to characterize spine and spinal cord lesions in vivo.
Material and Methods
A total of eight patients (4 women, 4 men; mean age 57 years) with spine or spinal cord disorders were included in this study. The diseases consisted of two neurinomas, one myeloma, three cases of syringohydromyelia, and two cases of cervical spondylosis. Informed consent was obtained from each patient. Ethical approval was obtained from the institutional review board before this study.
All MR imaging was performed on a 1.5 T MR imager (Signa HD; GE Healthcare, Milwaukee, WI, USA) with a cervix-thorax-lumbar coil. The MR imaging protocol consisted of conventional MR sequences (T1-weighted spin-echo imaging and T2-weighted fast spin-echo imaging in both sagittal and axial planes) and high b-value QSI. The imaging parameters of QSI were as follows: TR/TE = 10000/147.6 ms, matrix 128 × 128, bandwidth = 250 kHz, FOV = 240 × 240 mm to 280 × 280 mm, slice thickness/gap = 5/1.5 mm, with q values of 241.6, 341.7, 418.4, 483.2, 540.2, 591.8, 639.2, 683.3, 724.8, 764.0, 801.3, and 836.9 cm−1 for each axis in 20 slices. These 12 q values were the equivalent of b values of 1000, 2000, 3000 … 12000 s/mm2. Q values were applied in three directions (x, y, z). Motion probing gradient (MPG) duration time δ and MPG separation time Δ were kept at 55.8 and 62.0 ms, respectively. Conventional diffusion-weighted imaging (b = 1000) was also performed for the three patients with spinal tumors. The imaging parameters of conventional DWI were as follows: TR/TE = 8000/70 ms and b values of 0 and 1000 s/mm2, with the maximum b value applied in three directions in 20 slices. The bandwidth, FOV, spatial resolution, slice thickness, and slice gap for conventional DWI were the same as for QSI. Total scan time was approximately 40 s and 6 min 30 s for conventional DWI and QSI, respectively.
All QSI data were transferred to an independent PC, and MDP maps were obtained for each MPG axis by using software (QSI-analyzer; 25, 27, 28) applying the theory of q-space analysis (24, 25). All conventional DWI images were transferred to an independent workstation, and ADC maps were obtained.
MDP maps of QSI data and ADC maps of conventional DWI (if available) were obtained, and a region-of-interest (ROI) analysis was performed for the lesions, normal spinal cord, and CSF (representing free water). Because of low spatial resolution, white matter and gray matter could not be separated. ROIs of at least 9 pixels were placed on MDP maps in all patients. Moreover, corresponding ADC values were calculated under the conventional monoexponential model in the normal spinal cord, CSF, and tumor parenchyma. The average of MDP values of the three axes (x, y, z) in the ischemic lesions were compared to corresponding ADC values. Due to the small number of patients, we were not able to perform a statistical analysis.
Results
A sample figure showing the signal decay in the x, y, and z directions (Fig. 1) and q-space data in the same patient (Fig. 2) are shown for a patient with a neurinoma. MDP values of normal spinal cord, CSF, and tumor parenchyma were 6.57 ± 0.52, 17.6 ± 2.75, and 8.49 ± 2.09, respectively (µm, mean ± standard deviation [SD]). Corresponding ADC values were 1.52 ± 0.20, 3.19 ± 0.26, and 1.83 ± 0.77, respectively (10−3 mm2/s, mean ± SD). MDP values were not well correlated with corresponding ADC values (correlation coefficient r = 0.3448, P = 0.5032). Intra-tumoral structures were clearly demonstrated on MDP maps (Fig. 3) as additional findings. Similar findings were evident for the spondylotic lesions (Fig. 4).

High b-value images of the data in the x (top row), y (middle row), and z (bottom row) directions. From left to right, the images reflect b values of 0, 1000, 2000, 3000 … 11000 s/mm2, respectively. Note that data in which the signal is nearly zero in the high b-value images are needed to reduce truncation artifacts for q-space analysis

Q-space analysis was performed by Fourier transformation of the data after zero-filling up to q-values of 250 cm−1. Tumor_C indicates the cystic portion of the tumor and Tumor_S the solid part of the tumor. Note that the displacement distribution profiles show a ‘truncation artifact’ because these curves show the data before fitting to a bi-Gaussian function to obtain the displacement of the narrow and broad components

Neurinoma in a 69-year-old man. A fat-suppressed T2-weighted image (a) shows a heterogeneous hyperintense mass lesion indicating paravertebral dumbbell-type neurinoma. The MDP map (b) shows intra-tumoral structures in detail. Note that various intensities were demonstrated in the tumor (arrows), corresponding to a T2-elongated area on a T2-weighted image. The corresponding ADC map (c) derived from conventional DWI of the same location shows less detail in the tumor
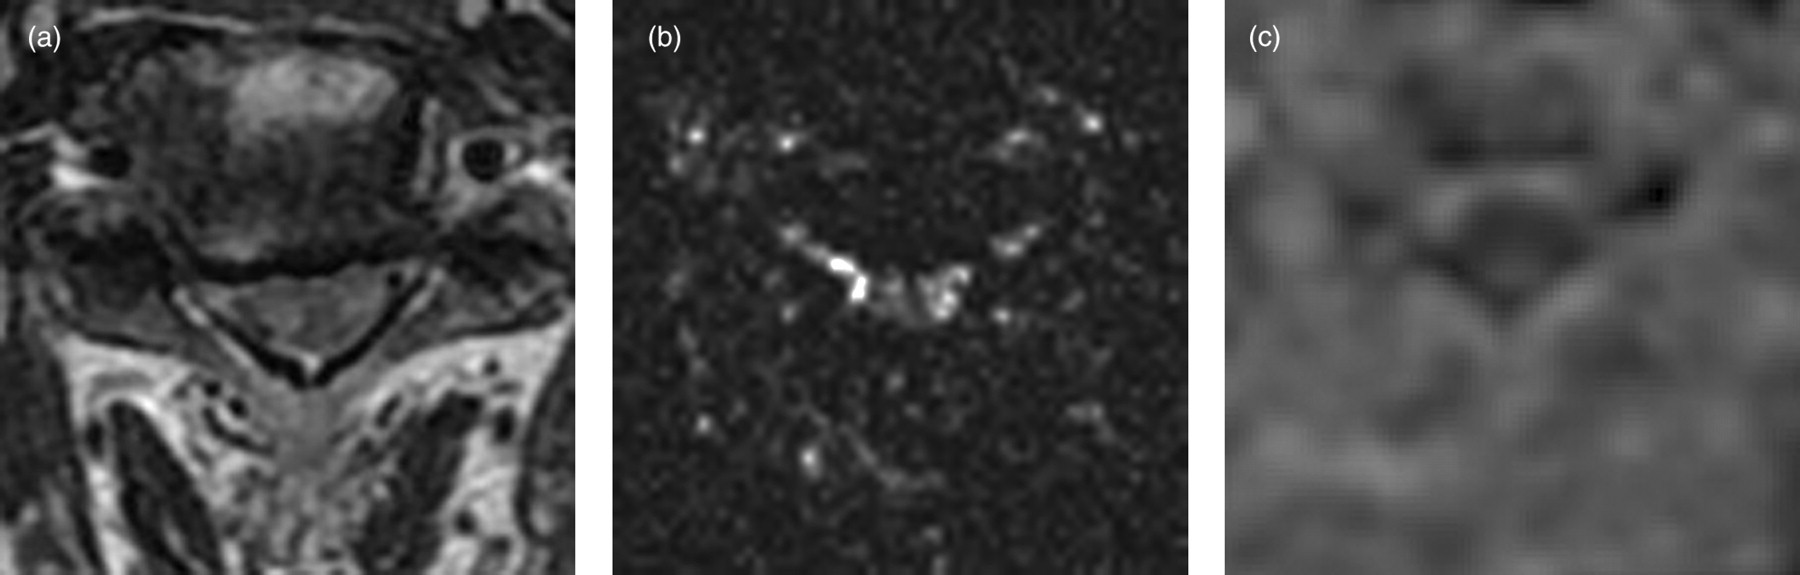
Cervical spondylotic myelopathy in a 61-year-old man. An axial T2-weighted image (a) shows a slightly high signal intensity in the cervical spinal cord. The MDP map (b) shows internal structures of the cervical spinal cord in detail. The degradation of image quality in the corresponding ADC map (c) derived from conventional DWI at the same location makes interpretation difficult
The spondylotic lesions tended to have higher MDP values (7.11 ± 0.75 µm, mean ± SD) than the values of normal spinal cord. The syringohydromyelia lesions had slightly lower MDP values (13.47 ± 1.02 µm, mean ± SD) than CSF.
Discussion
This study was performed to test the feasibility of using QSI to image lesions of the spine and spinal cord. The MDP values we obtained in normal spinal cord (6.57 ± 0.52) showed good agreement with the values reported in the literature (23). ADC values in normal spinal cord and CSF also appeared to be reasonable. Therefore, we believe that quantitative measurement of spine and spinal cord using QSI is appropriate, even though images were obtained on a 1.5 T clinical MR unit.
As shown in Fig. 3, the MDP maps were different from the corresponding ADC maps and showed better contrast for intratumoral structures. MDP maps may therefore provide more and different information about intratumoral lesions and have the potential to be a useful clinical tool, for example, for the differential diagnosis of lesions and to determine the extent of disease.
Although our results are from a small number of patients, MDP in the affected lesions in patients with cervical spondylosis showed higher values, which was similar to previously reported results of increased ADC values (6–10). However, a low positive correlation between ADC and MDP values has been reported in some situations, for example, in ischemic lesions in the brain (28). Therefore, increased MDP values in the spinal cord would provide information in addition to the increased ADC in patients with cervical spondylosis. A potential explanation for our results is that chronic compression may disturb the arrangement of axons and cause microstructural changes in the spinal cord that enable molecular water to move more freely.
In the syringohydromyelia lesions, MDP values in the syrinx were slightly lower than those in CSF, which is equivalent to free water. The restriction of water molecules due to microstructure in the cavity is a probable explanation for this result.
The limitations of our study are the small number of patients and the heterogeneous pathologies. Further investigation is needed before MDP values could be used clinically to evaluate lesions of the spine and spinal cord. Correlation between imaging and pathology, comparison studies with conventional DWI metrics, and correlation with clinical outcomes are particularly needed. The heterogeneous values of MDP in the spine and spinal cord lesions are possibly due to different tissues or pathologic structures; however, which metric is the best for clinical use remains to be established.
In conclusion, this feasibility study shows that it is possible to apply QSI to the spine and spinal cord in vivo and that the additional contrast provided by MDP maps may be useful for visualizing normal internal structures and pathologic lesions, even at 1.5 T, as an addition to the use of conventional MR imaging and DWI. However, more studies that include clinical correlation are needed.