




Abstract
Background
Directional connectivity measures, such as partial directed coherence (PDC), give us means to explore effective connectivity in the human brain. By utilizing independent component analysis (ICA), the original data-set reduction was performed for further PDC analysis.
Purpose
To test this cascaded ICA-PDC approach in causality studies of human functional magnetic resonance imaging (fMRI) data.
Material and Methods
Resting state group data was imaged from 55 subjects using a 1.5 T scanner (TR 1800 ms, 250 volumes). Temporal concatenation group ICA in a probabilistic ICA and further repeatability runs (n = 200) were overtaken. The reduced data-set included the time series presentation of the following nine ICA components: secondary somatosensory cortex, inferior temporal gyrus, intracalcarine cortex, primary auditory cortex, amygdala, putamen and the frontal medial cortex, posterior cingulate cortex and precuneus, comprising the default mode network components. Re-normalized PDC (rPDC) values were computed to determine directional connectivity at the group level at each frequency.
Results
The integrative role was suggested for precuneus while the role of major divergence region may be proposed to primary auditory cortex and amygdala.
Conclusion
This study demonstrates the potential of the cascaded ICA-PDC approach in directional connectivity studies of human fMRI.
To illustrate directional relationships of cortical information flow, directionality has to be estimated by a specific measure (1-4). Partial directed coherence (PDC) (3) is capable of estimating linear directionality in a Granger-causal sense as a function of frequency between distinctive brain areas, based on multivariable parametric (MVAR) modeling of brain signals. This method reveals direct interactions from secondary interactions. Recently, PDC has been applied to analysis of electroencephalograms (EEG) (5-7) and functional magnetic resonance (fMRI) data (8, 9). An improved version of PDC, re-normalized PDC (rPDC), has been introduced by Schelter et al. (10).
For reliable parameter estimation of the MVAR model, we must take into account the inherent scarcity of temporal data points in fMRI data. A reduced variable set has to be selected instead of a full data-set, for example, selected regions of interest. The approach suggested here is to apply cascaded independent component analysis (ICA) for data reduction, followed by PDC (rPDC) analysis. This is a data-driven approach that is intended to provide an anatomically and functionally specific data-set for directional connectivity analysis between average time-series of the functional networks in the human brain.
ICA separates various sources (components) of the fMRI signal by maximizing the non-Gaussianity of the source signals and it has been successfully applied to fMRI analysis earlier (11-17). It has been shown (18) that 42 functional components can be robustly detected by repeatability analysis applying the ICASSO-software package (19) to group data. Here, we also utilize the repeatability measure in the formation of our reduced data-set. As a result of the spatial ICA, the spatial maps of the voxels belonging to a certain component are maximally independent, not the time courses of the components. As stated in (13), weak but significant temporal correlations among components remain, despite smaller than temporal dependencies within a component. Our aim here was to test the capacity of our approach, i.e. cascaded ICA and PDC, in directional connectivity studies of human fMRI data.
Material and Methods
Subjects, fMRI data acquisition, and pre-processing
The ethical committee of Oulu University Hospital approved the studies for which the subjects have been collected. An informed consent has been obtained from each subject individually in accordance with the Declaration of Helsinki guidelines. Fifty-five control subjects without any serious mental disorders were chosen (age 24.96 ± 5.25 years, 32 women, 23 men) from three resting state studies (a 1986 birth cohort study of ADHD and psychosis prone-ness, a 1996 birth cohort study of schizophrenia, and a brain tumor study; total n = 200) conducted in the Oulu University Hospital between January 2007 and May 2008. Resting state group data were imaged using a 1.5 T GE HDX scanner with 8-channel parallel imaging (TR 1800 ms, TE 40 ms, whole brain coverage with 28 oblique axial slices, 4 mm thick, interslice space 0.4 mm. FOV 25.6 cm × 25.6 cm, 64 × 64 matrix, flip angle 90 degrees). The resting state scan consisted of 253 functional volumes. The first three images were excluded due to T1 equilibrium effects. Individual T1-weighted scans were taken with a 3D FSPGR BRAVO-sequence (FOV 24.0 cm, matrix 256 × 256, slice thickness 1.0 mm, TR 12.1ms, TE 5.2 ms, and flip angle 20 degrees) in order to obtain anatomical images for co-registration of the fMRI data to standard space coordinates. Head motion, extra-cranial tissues extraction, spatial smoothing to a 7 mm FWHM Gaussian kernel, and detrending were performed. Further details have been presented by Kiviniemi et al. (18).
ICA analysis
A detailed description of ICA analysis can be found in the paper by Kiviniemi et al. (18). Temporal concatenation group ICA in a probabilistic ICA (20) (default ICA parameters, 70 components) was carried out in FSL4. ICASSO (19) repeatability runs were performed in Matlab with 200 repetitions and a stringent algorithm convergence threshold (epsilon = 0.0000001) to identify which independent components (ICs) robustly represent underlying signal sources. The Juelich histological atlas and Harvard-Oxford cortical and subcortical atlases (Harvard Center for Morphometric Analysis), provided with the FSL4 software package were used to quantify an anatomical match of component-wise maps in MNI standard space.
The reduced data-set consisted of the selected subject-wise time courses of the ICs. Originally, subject-specific IC time courses were extracted from the subject-specific segments of the ICA mixing matrix estimated using temporally concatenated subject-level data. Full columns of this mixing matrix are orthogonal (as estimation of unmixing vectors orthogonalizes vectors with respect to each other) but the columns of mixing matrix projected back to their original dimensions with a dewhitening matrix are no longer orthogonal. The subject-specific segments of the back-projected mixing matrix columns can be interpreted to represent user specific temporal dynamics associated with ICs. The major DMN components, i.e. the frontal medial cortex (FMC) with the repeatability index IQ = 0.93 (IQ range 0 to 1 in ICASSO (19)), Precuneus (IQ = 0.91) and posterior cingulate cortex (PCC) (IQ = 0.88) were selected. The selected Precuneus component was found to be particularly stable in ICA model order analyses (21) and had a major spatial overlap (28.16%) with the precuneus cortex (Harvard-Oxford atlas). Also, other robust components were selected with the following thresholds: a minimum of 50% coverage of any known functional area defined by atlases (18) and an IQ ≥0.9. It is emphasized that each of the selected components was not a single region, but a resting state network.
rPDC analysis
The background of rPDC is presented in the Appendix (see http://ar.rsmjournals.com/content/52/9/1037/suppl/DC1). The reduced data-set of nine components, from 55 subjects, for 250 temporal data points (differencing for stationarity, then zero-mean and variance normalized) was obtained for further rPDC analysis, beginning with the parametric (MVAR) model estimation (estimation algorithm: Vieira-Morf using unbiased covariance estimates) in Matlab using the BioSig toolbox (22). In order to estimate optimal model order p, the comparison of non-parametric and parametric estimation of the power spectral densities (as suggested in (23)) was performed subject-wise (Fig. 1). The MVAR model's assumption of white noise residual was found to apply, i.e. uncorrelatedness (tested similarly to (24)) and normality of residuals (estimated with Lilliefors test) were fulfilled at a 5% risk level at the group level. Stability of each MVAR model was confirmed with eigenvalue analysis. Derived from the parametric model, rPDC values were determined (10) in the low frequency range of fMRI (0.1 Hz and below) for each subject. The directional connection was considered significant if the rPDC value exceeded the significance level at alpha = 5% risk (corrected alpha for multiple comparisons, false discovery rate). Significance level was determined according to (10).
In order to estimate optimal model order p, the comparison of non-parametric (Welch's method, 90-point window, 50% overlap, black line in (a) and parametric (MVAR) estimation (a, in grey or red) of the power spectral densities (PSD) was performed subject-wise as a function of model order (P = 1…30), as suggested in Schelter et al. (23). The difference sum between PSDs was first computed for each component (b) and the median value was obtained per subject. Thus, the model order where the difference sum between PSDs reached the minimum, gave the estimate of the optimum model order for the subject. A distribution of optimum model orders for the group was obtained respectively (c)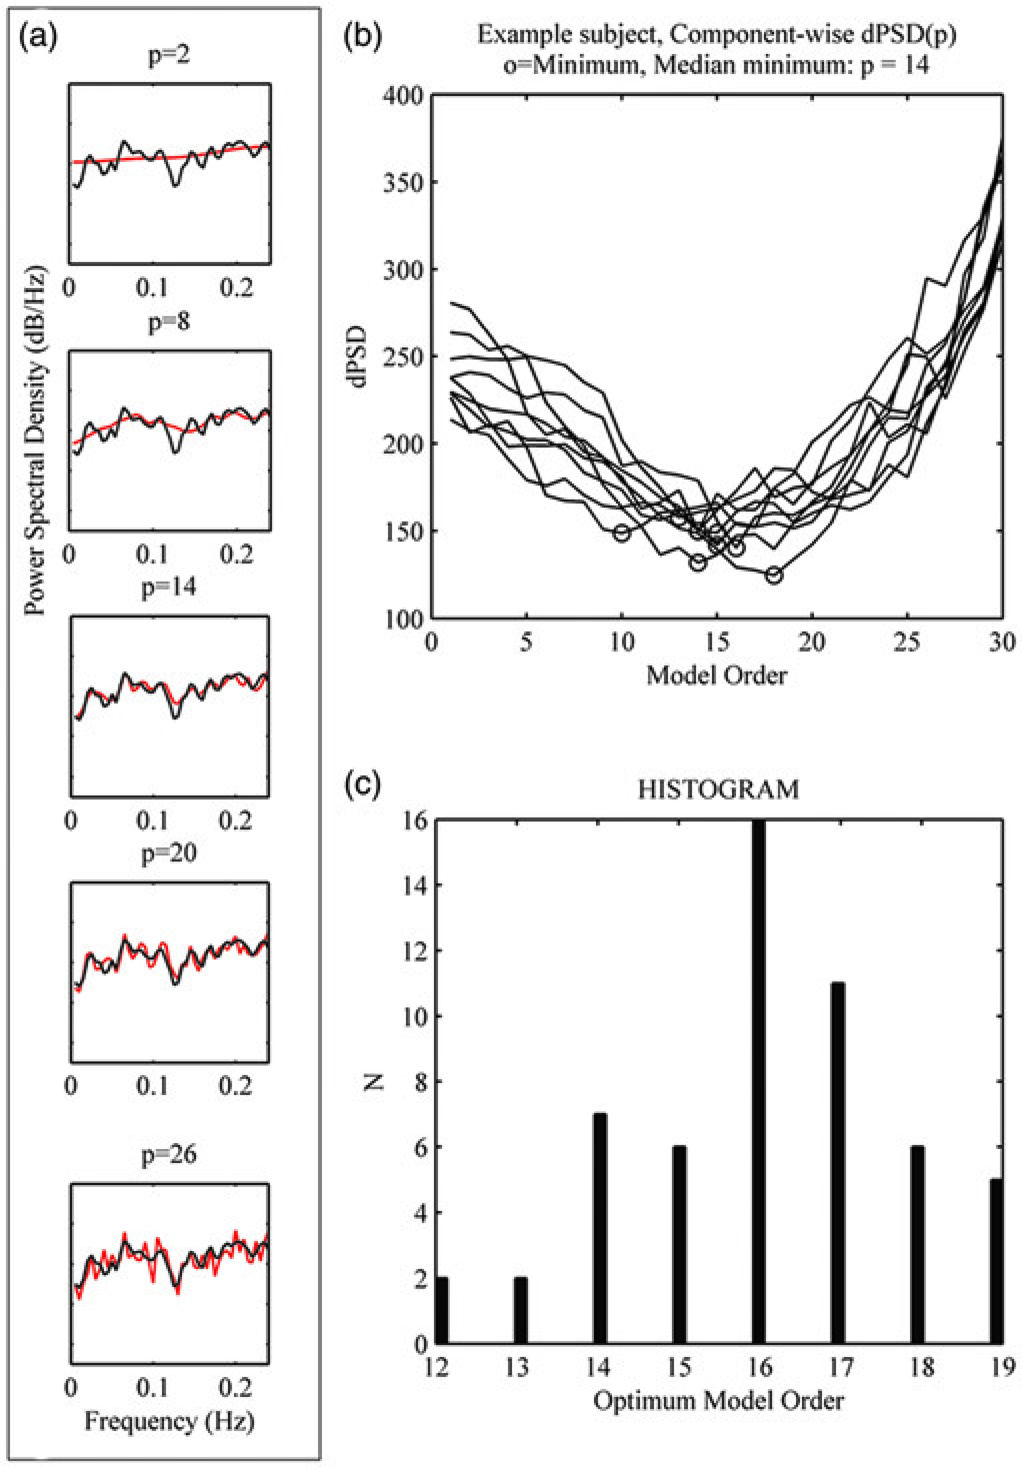
Results
The reduced data-set fulfilling the selection criteria included nine components. The components matched secondary somatosensory cortex (S2) (IC 43), inferior temporal gyrus (ITG) (IC 13), intracalcarine cortex (ICC/V1) (IC 59), Heschl's Gyrus and primary auditory cortex (HC/A1) (IC 25); subcortical Amygdala (IC 29) and Putamen (IC 41); and the DMN components: FMC (IC 10), PCC (IC 38) and Precuneus (IC 33) (IC numbering respective to Kiviniemi et al. (18)).
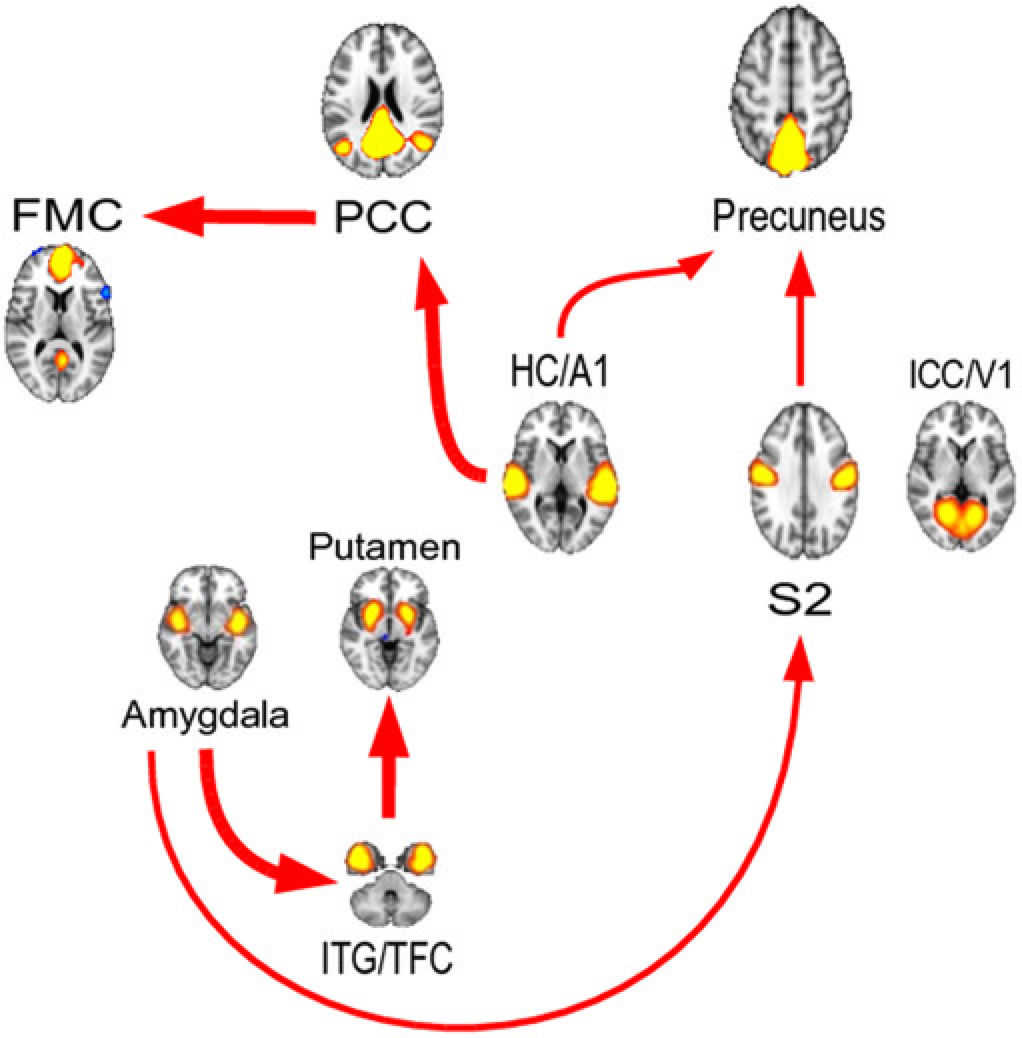
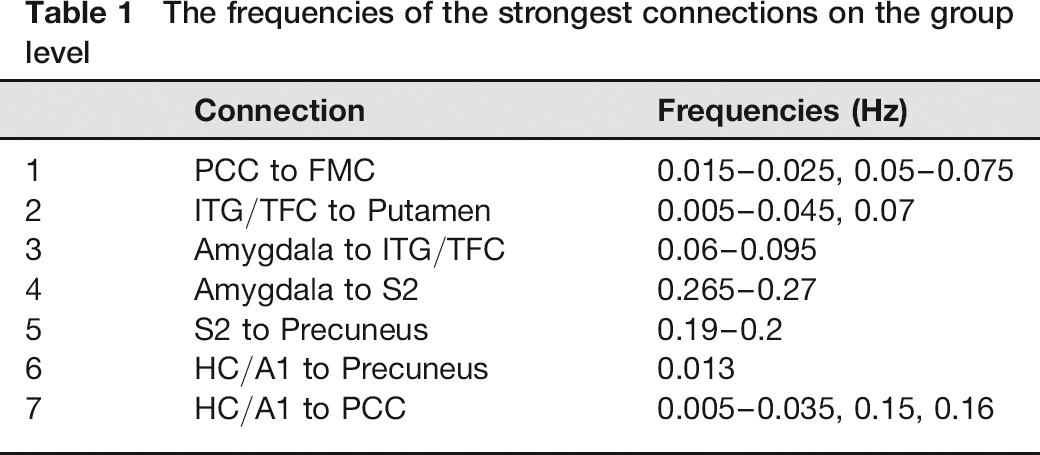
Median and 40th and 60th percentiles of rPDC values in function of frequency are shown in Fig. 2 for the strongest connections. These connections, having a connectivity rate of 40% or more at the group level (i.e. 60th percentiles over significance level) were confined to seven connections (Table 1). The resulting graph of these seven connections (Fig. 3) represents the flow of information between brain areas, while the connection frequencies are specified in Table 1.
Median and 40th and 60th percentiles of rPDC values in function of frequency. Straight line = 5% significance level (corrected for multiple comparisons). Diamonds = 60th percentile was above significance level; only these strongest connections are shown. Components and their corresponding abbreviations include the following: secondary somatosensory cortex (S2), inferior temporal gyrus (ITG), Heschl's gyrus - primary auditory cortex (HC/ A1); subcortical Amygdala and Putamen; and DMN: frontal medial cortex (FMC), posterior cingulate cortex (PCC) and Precuneus
The frequencies of the strongest connections on the group level
In this analysis, the precuneus appears to function as a major integration area, with input from cortical regions (S2 and HC/A1). PCC plays a double role as the cortical output/input center, however, with the outward connection being to another DMN area, the FMC. A similar role was played by the ITG/TFC, with subcortical input/output, from the Amygdala, and output to the Putamen. HC/A1 has the most outward connections to the DMN (PCC and precuneus). In this analysis, ICC/V1 remains isolated.
Most of the strongest connections were found below 0.1 Hz (Fig. 2, Table 1). However, three connections (Amygdala to S2, HC/A1 to Precuneus and S2 to Precuneus) occurred over 0.1 Hz frequencies with the narrow bandwidths (Table 1).
Discussion
With the cascaded ICA-PDC approach, directional connectivity relationships in a Granger-causal sense were revealed across resting-state networks, based on the resting state fMRI data of 55 subjects. If the component-wise anatomical correspondence is taken account, the results suggest the integrative role of the precuneus. Directed connections must be considered to occur between brain networks, not between single confined regions. This study introduces a procedure based on the combination between ICA and PDC, i.e. cascaded ICA-PDC. This emphasizes the role of data reduction with maximal data-driven decisions, putting lesser weight on subjective selection of seed regions or components.
DMN did split into separate components (FMC, PCC and Precuneus) in our high-order ICA analysis (18). The reduced data-set included ICA components in apparent concordance with the work of Jafri et al. (13). Their selection included default mode, temporal, parietal, frontal, subcortical, visual, and fronto-temporo-parietal components. In comparison to our set (the naming convention following the highest matching functional anatomy) of DMN (FMC, PCC and Precuneus), HC/A1, ITG, S2, subcortical Amygdala and Putamen and ICC/V1, there were differences, but all these areas were also included either as a major area of a selected component (e.g. visual vs. ICC/ V1) or participating in several network components (like temporal and fronto-temporo-parietal vs. ITG). Jafri et al. (13) used a similar approach by measuring the connectivity with temporal correlation and lag analysis of componentwise time courses (frequency band 0.0372-0.372 Hz).
ITG is a part of the inferior temporal cortex and at the end of ventral stream of visual processing. Its primary functional roles are associated with visual working memory, face and object recognition (25, 26) and reading (27). Especially, involvement to individuation of faces is suggested for ITG (28). From the perspective of these roles, input from ICC/V1 was lacking, however, the strong connection from amygdala (emotion, memory) is highly relevant. The connection to putamen is first more difficult to interpret, but in the light of multisensory integration (29), this finding is less puzzling.
For the auditory area, our study suggests an association of a feed-forward relay station. Both multisensory integration, e.g. Hoffman et al. (29), and auditory mismatch studies, e.g. Näätänen et al. (30), are in agreement with this finding. It is known that the auditory areas serve subconscious discrimination and attention to filtering relevant from irrelevant information, as well as other higher-order cognitive processing (30). Thus, this finding of feed-forward relations from the auditory area to the cortical DMN (PCC, Precuneus) areas are highly plausible, but still require further confirmation.
In this study, the strongest directional connectivity occupied mostly frequencies <0.1Hz (Fig. 2). In comparison to a network analysis of resting-state fMRI data (31), where small-word properties were apparent at 0.03-0.06 Hz, our results overlap these results. A frequency-specific functional connectivity study of (32) reported peaking within 0.01-0.02 Hz or 0.01-0.04 Hz, depending on functional network. Also, in a similar study (15), frequency-dependent Granger causality results overlapped low frequencies (0-0.1 Hz) in most of the connections.
Spatial ICA performed here on temporally concatenated subject data produces spatial data components that describe group-level patterns of coherent activity and corresponding subject-specific temporal dynamics. Repeatability analyses, such as ICASSO (19) can be used to improve/study robustness of the components, although recent results show that it may be unnecessary in resting-state fMRI (28). Even though a component contains a value for each voxel, subsequent statistical scoring and thresholding reveals the non-trivial areas. These areas may be spatially non-continuous and also constitute a network of otherwise distinct neuroanatomical regions. The subject-specific temporal dynamics corresponding to the component reflect some underlying brain activity which recruits these regions. In this sense, any correlation/causality analysis made between the time courses is analysis of interactions between these brain functions and not analysis of interactions between specific individual neuroanatomic regions.
Granger causality (33) in its time domain or in a frequency domain version has been widely utilized when exploring linear causal relationships from time series. Since (34), it has also been applied in fMRI (15, 35), and with a similar (but not identical) data-driven reduction scheme (36, 37) like in this study. Instead of Granger causality, another MVAR -modeling-based measure, PDC, was applied here. PDC has the capacity to detect direct relations (3, 6) and an inherent frequency-dependency (3). However, those indirect influences, which are mediated via an additional third network area are not included in the MVAR -model, cannot be excluded. Like Granger causality, PDC does not require a priori hypothesis of directional relationships. However, reduction of data-set is required for reliable parameter estimation of MVAR model, as mentioned earlier. Re-normalized PDC (rPDC) (10), a recent advanced form of PDC was selected here, as it reflects strength of the influence compared to strength relative to signal source in the original PDC measure. Furthermore, in evaluation of statistically significant connection, rPDC can use a constant significance level from chi square distribution (10).
Limitations of the study relate to the role of hemodynamic delay. Hemodynamic delay can vary considerably within the brain, especially in the cerebellar region where the large vasculature differs from the rest of the brain (38). These time relations are important issues and are under active debate (39-42) as if the cause is not prior to the effect, it will confuse the analysis based on MVAR-modeling designed to estimate connectivity in the Granger-causal sense. However, hemodynamic delay correction had only an average effect of 0.6-3.0% on the amount of DMN voxels obtained with a seed-region correlation analysis (38). In the same study, multivariate Granger analysis was performed with a single subject during a working-memory task, and more unidirectional and reciprocal connections were found after correcting the hemodynamic delay. This example is not directly applicable to our data, as we used time series representations of spatial-ICA components and frequency-dependent PDC analysis, but it suggests that more connections might arise with a hemodynamic delay correction. This requires further investigation.
In conclusion, to our knowledge, this is the first study to demonstrate the potential of the cascaded ICA-PDC approach in directional connectivity studies of human fMRI. Further studies to validate this approach with a larger population, and simulations to test the effect of hemodynamic delay, are suggested.
Footnotes
Acknowledgment
We thank professor Tapio Seppänen for his valuable comments on this work. This study was supported by Academy of Finland grants 111711 and 132123, the Finnish Medical Foundation, the Sigrid Juselius Foundation, and the Finnish Neurological Foundation.
None