
Abstract
Background
ShearWaveTM Elastography (SWE) provides a quantitative measurement of tissue stiffness and may improve characterization of breast masses. However, the significance of Young's modulus measurements and appropriate SWE evaluation criteria has not been established yet.
Purpose
To assess the usefulness of the pattern classification and Young's modulus measurements in the differential diagnosis between benign and malignant solid breast masses.
Material and Methods
Ninety-six patients (age range 18–84 years, mean 54 years) with 100 solid breast masses who underwent tissue sampling after a US examination were analyzed. We tried to create a visual pattern classification based on the SWE images. After classifying the visual patterns, the Young's modulus of the lesions was measured in every case.
Results
It was possible to classify the images into four patterns by the visual evaluation: no findings (coded blue homogeneously; Pattern 1), vertical stripe pattern artifacts (Pattern 2), a localized colored area at the margin of the lesion (Pattern 3), and heterogeneously colored areas in the interior of the lesion (Pattern 4). There were 17 Pattern 1 lesions, 14 Pattern 2 lesions, 20 Pattern 3 lesions, and 49 Pattern 4 lesions. When Patterns 1 and 2 were assumed to be benign, and Patterns 3 and 4 were assumed to be malignant, the sensitivity and specificity were 91.3% (63/69) and 80.6% (25/31), respectively. The mean Young's modulus measurements of the benign and the malignant lesions were 42 kPa and 146 kPa, respectively (P < 0.0001). No significant differences were found between benign and malignant lesions in Pattern 3. In Pattern 4, however, the Young's modulus of the benign lesions (50 kPa) was lower than the smallest Young's modulus of malignant lesions (61 kPa).
Conclusion
The visual pattern classification and adding Young's modulus measurements may improve characterization of solid breast masses.
Ultrasonography (US) has emerged as the most important adjunct to mammography in the diagnosis of breast disease (1–3). At present, Doppler US (4, 5) and elastography (6) are also used in addition to B-mode US as aids for the differential diagnosis between benign and malignant lesions, as they provide information not only on the morphology, but also on the vascularity and tissue elasticity.
Elastography with manual compression is a form of diagnostic imaging in which external force is used to deform a tissue and its elasticity is estimated on the basis of the strain. In breast elastography the hardness of the lesion is visualized by compressing the site of the lesion from above with a probe. High specificity (85.8–89.8%) has been shown in previous reports on elastography (6–9). However, because there is not a proportional relationship between the strength of the force applied and the amount of tissue strain, the results may vary with the degree of compression. Moreover, because the compression is performed free-hand, the direction of the force is variable, and examiner dependence and reproducibility are sometimes a problem (10).
In recent years, attempts have been made to evaluate the hardness of a breast lesion without applying external compression (11–13), and Athanasiou et al. (12) have reported finding that a supersonic shear imaging system modified by SuperSonic Imagine (Aix-en-Provence, France) provided complementary information for the differential diagnosis of breast lesions. The technique is based on a combination of the radiation force induced in a tissue by an ultrasound beam and an ultrafast imaging sequence capable of capturing the propagation of the resulting shear waves in real time (11–13).
Previous reports of studies in which supersonic shear imaging was used (12, 13) have stated that using Young's modulus of elasticity (kPa) was useful in making the differential diagnosis between benign and malignant lesions. However, because supersonic shear imaging produces color display images based on Young's modulus measurements, a certain level of diagnostic accuracy can be obtained from the color display images without measuring Young's modulus. In the present study we evaluated supersonic shear imaging visually and attempted to create a pattern classification. We then assessed the usefulness of the pattern classification and Young's modulus measurements in the differential diagnosis between benign and malignant solid breast masses.
Material and Methods
Patients and inclusion criteria
Between October 2010 and April 2011, 202 patients underwent ShearWaveTM Elastography (SWE; SuperSonic Imagine, Aix-en-Provence, France). In this study 96 patients (age range 18–84 years, mean 54 years) with 100 solid breast masses who underwent tissue sampling (core needle biopsy or vacuum-assisted biopsy) after a US examination were analyzed.
Of these 96 patients, 61 were asymptomatic, 33 had presented with a palpable mass, and two presented with nipple discharge. Mammography was performed before the US examination in all of the patients. The mammography findings in the 100 solid breast masses were classified according to the American College of Radiology (ACR) Breast Imaging Reporting and Data System (BI-RADS) (14) as: category 1 (negative) in 36 breasts; category 0 (need additional imaging evaluation) or category 4 (suspicious abnormality) in 53 breasts; and category 5 (highly suggestive of malignancy) in 11 breasts. There were no category 2 (benign finding) or category 3 (probably benign finding) lesions. The lesion was visualized in the form of a mass in 32 cases, as a mass with microcalcifications in nine cases, as microcalcifications in three cases, as a focal asymmetry in 16 cases, and as an architectural distortion in four cases.
The final findings in the 100 solid breast masses prior to biopsy were classified according to the ACR BI-RADS-US (15) as: category 3 in 12 masses; category 4 in 72 masses; and category 5 in 16 masses.
Breast US
The breast US examinations were performed by using the Aixplorer US system (SuperSonic Imagine, Aix-en-Provence, France) equipped with a linear array transducer having a bandwidth of 4–15 MHz.
SWE is a tissue elasticity imaging method that is based on estimation of the velocity of a shear wave generated by radiation force (11). A remote radiation force (pushing beam) is generated by focusing ultrasound with a conventional ultrasonic probe. The radiation force displaces tissue a few micrometers, and the displacement generates a transient shear wave in the medium. A quasiplane shear wave can be generated by successively focusing multiple beams at increasing depths, and after generating the quasiplane shear wave, the echographic device switches to an ultrafast imaging mode by acquiring raw radiofrequency data at a very high frame rate (up to 20,000 Hz) with the same ultrasonic probe. Young's modulus (kPa) is then calculated from the shear wave velocity obtained, and the interior of the region of interest (ROI) is displayed in colors (hard areas as red, soft areas as blue).
SWE imaging was performed by setting the ROI so that it included the lesion and the surrounding normal tissue, and the direction of the probe was adjusted so that the skin, lesion, and thoracic wall were perpendicular. The elasticity range was fixed at 0–180 kPa (Fig. 1) in every lesion, and imaging was performed while striving to minimize compression by the probe.
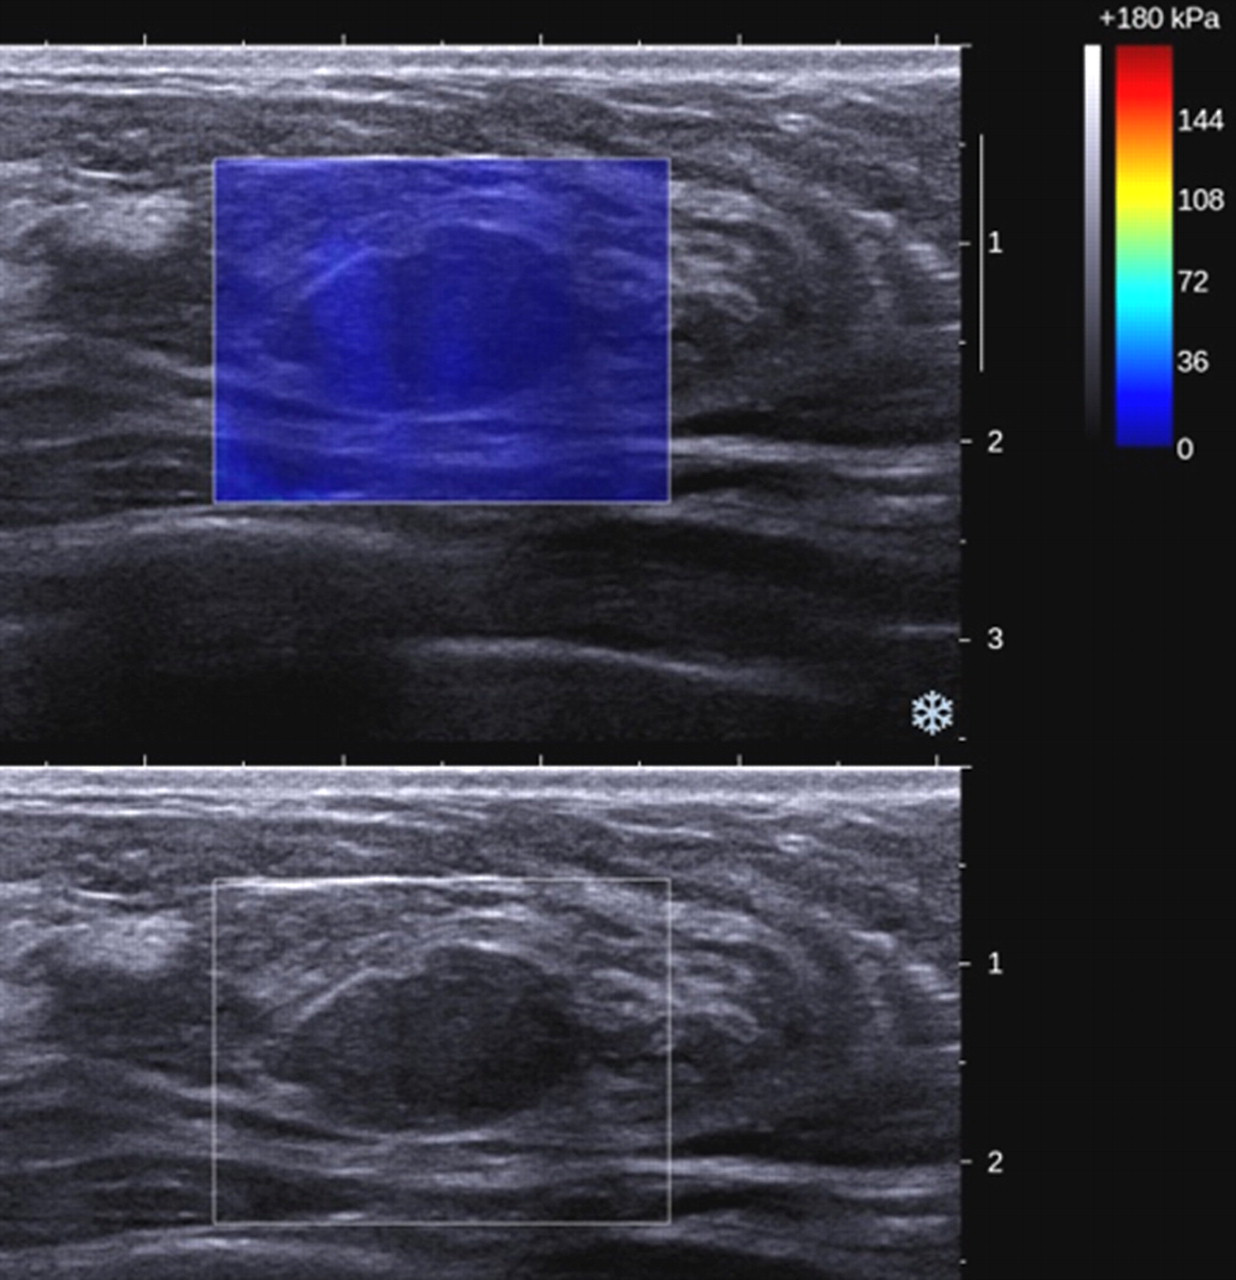
A 49-year-old woman with fibroadenoma. B-mode image on the bottom and color-coded map of elasticity on the top. With ShearWaveTM Elastography (SWE) image the lesion is coded blue homogeneously (no findings; Pattern 1). Mean value of the lesion was 14 kPa
Data evaluation and statistical analysis
We tried to create a visual pattern classification based on the SWE images. A radiologist with 18 years' experience in breast US who did not know the pathology results performed visual evaluations of the images of 100 lesions that had been stored in electronic medical charts.
After classifying the visual patterns, a Q-BoxTM function that measures Young's modulus was used to measure the Young's modulus of the lesions in every case, and the mean values of the benign lesions and the malignant lesions were compared. The Q-BoxTM diameter was set at 2 mm. In the lesions in which the visual pattern classification was positive, we made the measurements in the area that was depicted as the hardest, and in the lesions that were negative, we made the measurements in the interior of the lesions.
The Mann-Whitney U-test and Pearson's correlation coefficients were used to statistically evaluate the numerical data. A P value less than 0.05 was considered as statistically significant. The statistical analyses were performed with statistical software (SPSS for Microsoft Windows, version 16.0; SPSS, Chicago, IL, USA).
Results
The histopathologic diagnosis was malignant in 69 lesions and benign in 31 lesions. The histological types of malignancy included ductal carcinoma in situ (DCIS) (n = 6), invasive ductal carcinoma, not otherwise specified (ductal NOS) (n = 52), invasive lobular carcinoma (n = 5), mucinous carcinoma (n = 5), and apocrine carcinoma (n = 1). The 31 benign lesions included fibroadenoma (n = 17), benign proliferative disease (n = 8), intraductal papilloma (n = 4), ductal adenoma (n = 1), and cavernous hemangioma (n = 1). The average size of the malignant lesions was 20 mm (range 3.5–60 mm), and the average size of the benign lesions was 14 mm (range 3.0–70 mm).
It was possible to classify the images into four patterns by the visual evaluation (Table 1). When no difference from the color around the lesion was observed at the margin of the lesion or in its interior (coded blue homogeneously), the image was classified as ‘no findings’ (Pattern 1) (Figs. 1 and 2). When a color that differed from the color around the lesion was observed at the margin or in the interior of the lesion, but it extended beyond the lesion and continued vertically in cords on the cutaneous side or the thoracic wall side, it was concluded to be an artifact unique to SWE and classified as a negative finding (Pattern 2) (Figs. 3 and 4). On the other hand, when a localized colored area was present at the margin of the lesion, it was classified as a positive finding (Pattern 3) (Figs. 5 and 6). When colored areas were present in the interior of the lesion heterogeneously, it was classified as a positive finding (Pattern 4) (Figs. 7 and 8). Even when the lesion and cord-like artifact overlapped, if a localized colored area was observed at the margin of the lesion (Fig. 6), it was classified as a positive finding (Pattern 3).

A 61-year-old woman with mucinous carcinoma. B-mode image shows a hyperechoic solid mass (arrows). With SWE image the lesion is coded blue homogeneously (no findings; Pattern 1). Mean value of the lesion was 17 kPa
A 35-year-old woman with fibroadenoma. SWE image shows light green vertically striped pattern (Pattern 2). Mean value of the lesion was 40 kPa
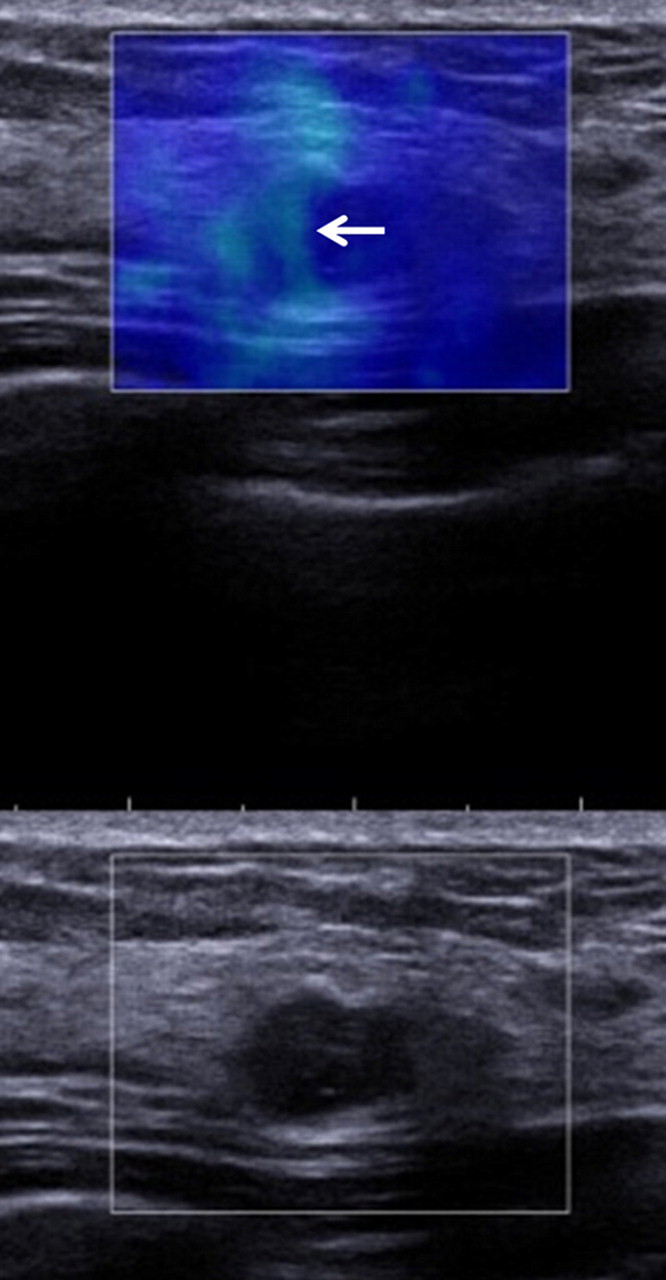
A 47-year-old woman with ductal carcinoma in situ (DCIS). SWE image shows light green vertically striped pattern (arrow) (Pattern 2). Mean value of the lesion was 52 kPa. Histological evaluation of lumpectomy specimen revealed 8.2-mm low-grade DCIS

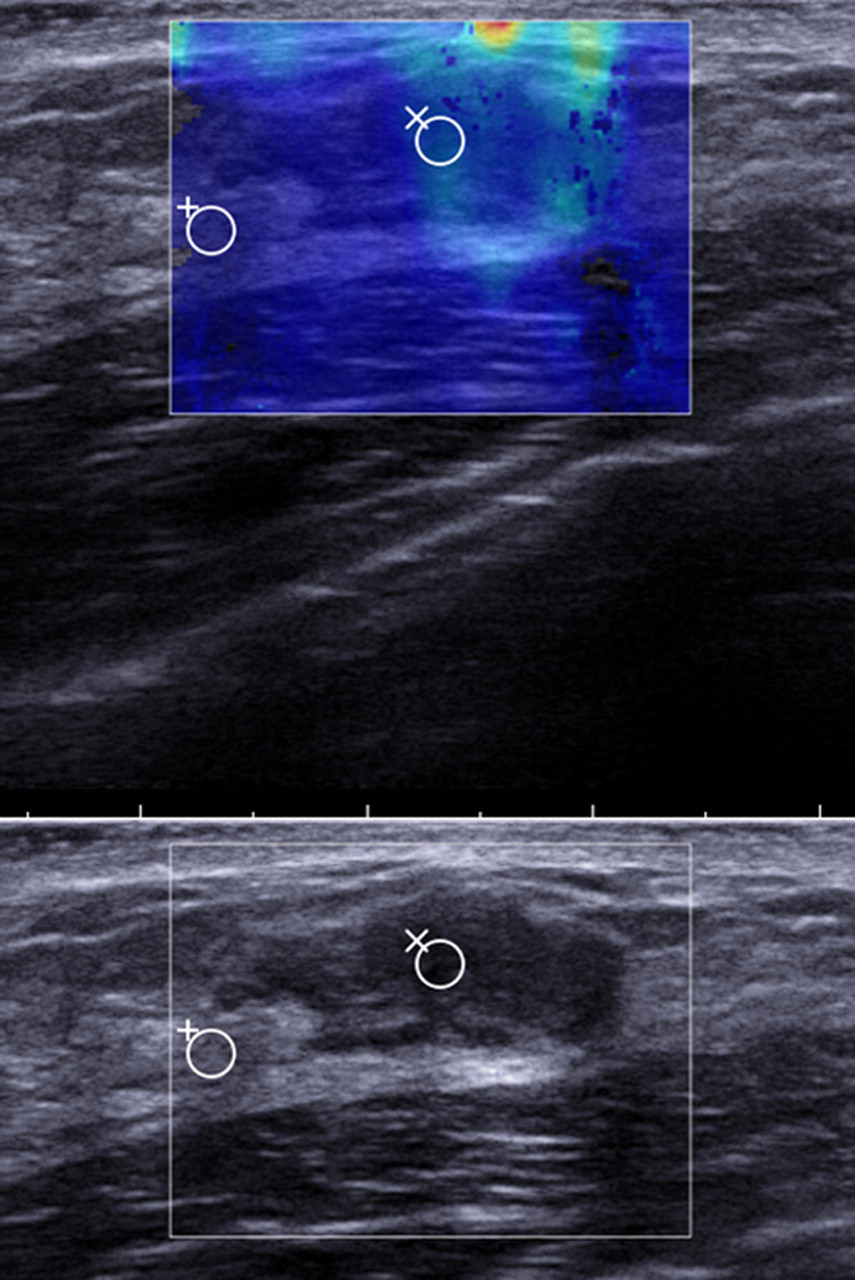
A 73-year-old woman with invasive ductal carcinoma. SWE image shows localized colored area (arrows) at the margin of the lesion (Pattern 3). Mean value of the lesion was 71 kPa
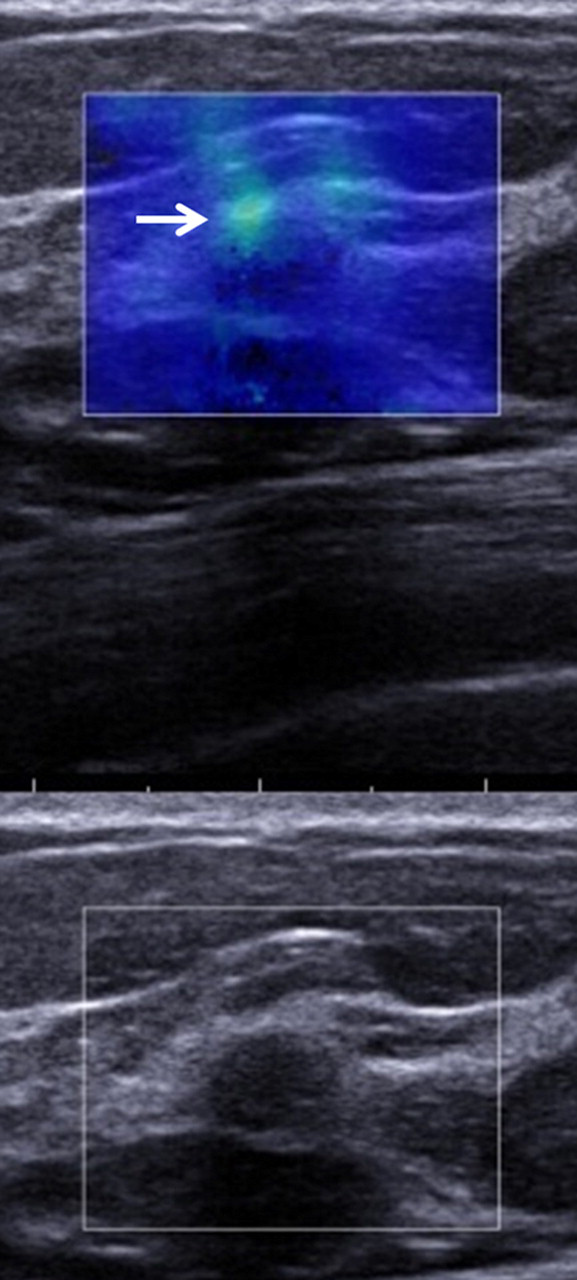
A 41-year-old woman with fibroadenoma. SWE image shows light green vertically striped pattern, but localized colored area (arrow) is observed at the margin of the lesion (Pattern 3). Mean value of the lesion was 67 kPa
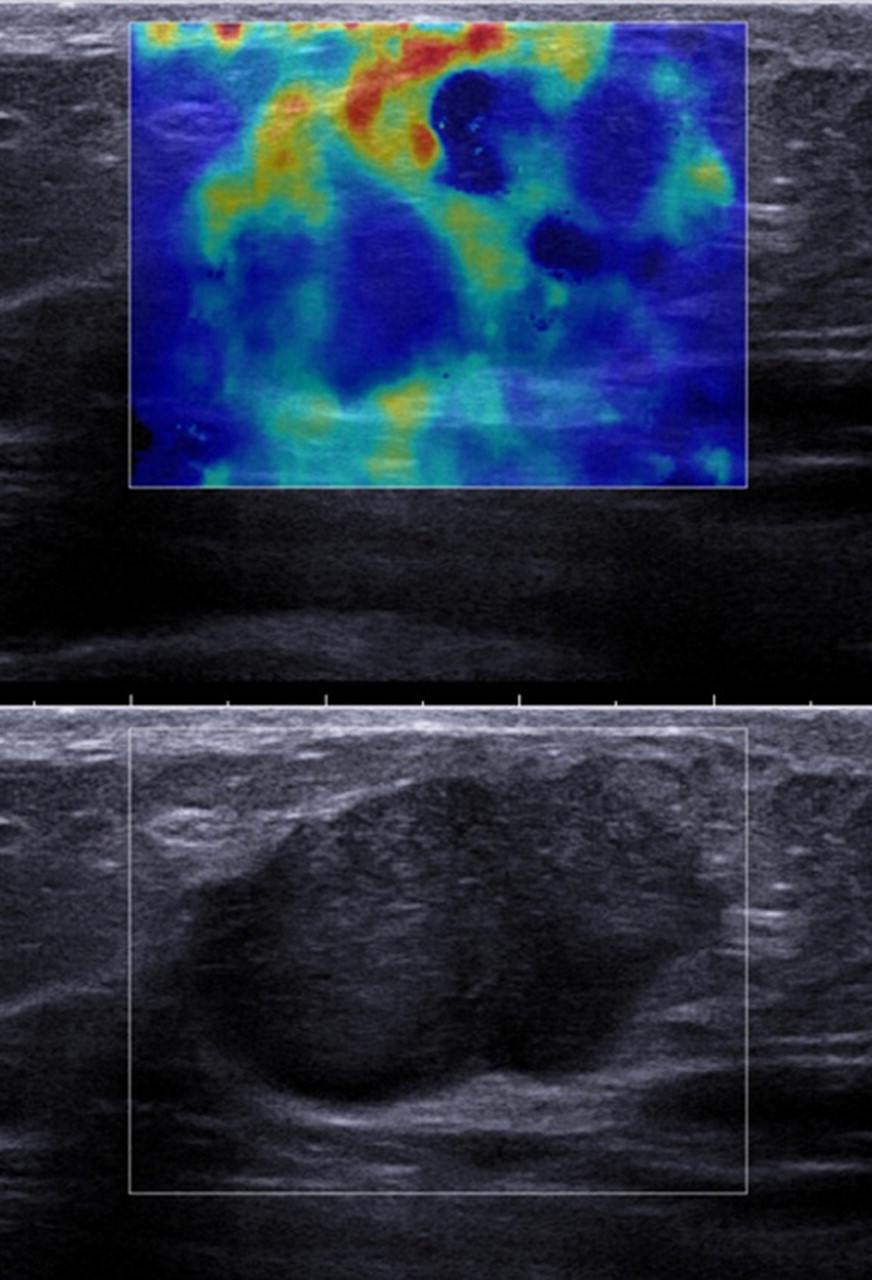
A 65-year-old woman with invasive ductal carcinoma. SWE image shows heterogeneously colored areas in the interior of the lesion (Pattern 4). Mean value of the lesion was 137 kPa
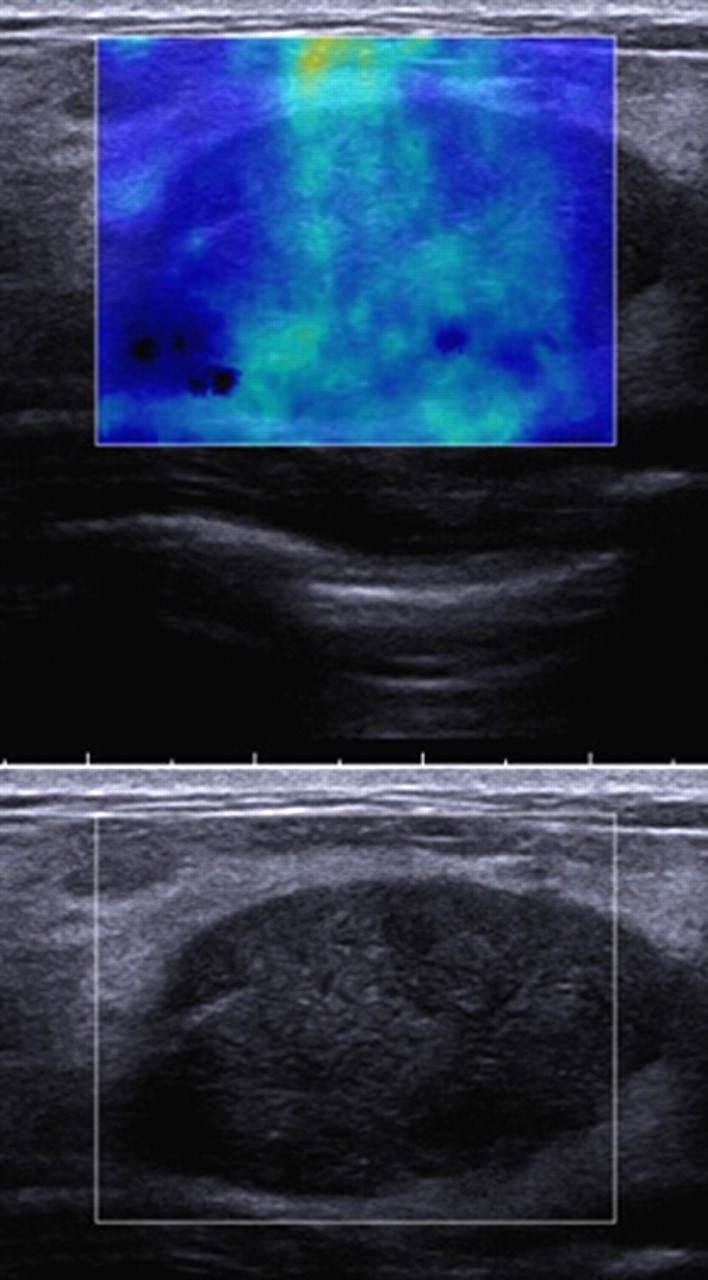
A 31-year-old woman with fibroadenoma. SWE image shows heterogeneously colored areas in the interior of the lesion (Pattern 4). Mean value of the lesion was 50 kPa
Pattern classification of ShearWave™ Elastrography images
According to the visual pattern classification there were 17 Pattern 1 lesions, 14 Pattern 2 lesions, 20 Pattern 3 lesions, and 49 Pattern 4 lesions (Table 1). When it was assumed that Patterns 1 and 2 were benign and Patterns 3 and 4 were malignant, sensitivity, specificity, the positive predictive value (PPV), the negative predictive value (NPV), and accuracy were 91.3% (63/69), 80.6% (25/31), 91.3% (63/69), 80.6% (25/31), and 88% (88/100), respectively. The histological types of the six false-negative malignant lesions (Figs. 2 and 4) were DCIS (n = 3), ductal NOS (n = 2), and mucinous carcinoma (n = 1), and the histological types of the six false-positive benign lesions (Figs. 6 and 8) were fibroadenoma (n = 5) and intraductal papilloma (n = 1). The average size of the false-negative malignant lesions was 9.3 mm (range 4.3–18 mm), and the average size of the false-positive benign lesions was 22 mm (range 6.6–70 mm).
Based on BI-RADS-US category, the frequency of breast cancer according to category was 0% (0/12) of the category 3 cases, 73.6% (53/72) of the category 4 cases and 100% (16/16) of the category 5 cases (Table 2). When the cut-off point was placed between BI-RADS-US category 3 and BI-RADS-US category 4, the BI-RADS-US classification had a sensitivity of 100%, specificity of 38.7% (12/31), PPV of 78.4% (69/88), NPV of 100%, and accuracy of 81% (81/100) (Tables 2 and 3). Among the cases with a category 4 lesion, 15 benign lesions and six malignant lesions exhibited Pattern 1 or Pattern 2 (Table 2). If the pattern classification of the SWE images were applied to the BI-RADS-US category 4 lesions, evaluation by the BI-RADS-US and SWE classifications combined would yield a sensitivity of 91.3 % (63/69), specificity of 87.1% (27/31), PPV of 94% (63/67), NPV of 81.8% (27/33), and accuracy of 90% (90/100) (Table 3).
BI-RADS-US category and pattern classification of ShearWave™ Elastography images
Diagnostic performance characteristics: comparison BI-RADS-US category 4 lesions and pattern classification of ShearWave™ Elastography (SWE)
*Pattern classification of ShearWave™ Elastography images
The mean Young's modulus measurements of the benign lesions and the malignant lesions were 42 kPa (6.3 kPa to 96 kPa; standard deviation [SD], 28 kPa) and 146 kPa (7.1 kPa to 299 kPa; SD, 80 kPa), respectively, and the difference was statistically significant (P < 0.0001). In Pattern 3, the mean Young's modulus values of the benign and malignant lesions were 80 kPa (67 kPa to 96 kPa; SD, 11 kPa) and 92 kPa (31 kPa to 269 kPa; SD, 69 kPa), respectively, and the difference was not statistically significant (Table 4). In Pattern 4, however, the Young's modulus of the benign lesions (50 kPa) was lower than the smallest Young's modulus of malignant lesions (61 kPa) (Table 4). In addition, there were statistically significant differences between the mean Young's modulus (92 kPa vs. 177 kPa) and mean size (14 mm vs. 24 mm) of the Pattern 3 malignant lesions and the Pattern 4 malignant lesions (P = 0.0001, P = 0.0002, respectively). Among the malignant lesions in Patterns 3 and 4, the Young's modulus was significantly correlated with the lesion size (r = 0.50; P < 0.0001; 95% confidence intervals 0.29–0.66).
The Young's modulus values in each pattern of ShearWave™ Elastography images
Discussion
Previous studies that have used SWE have reported that Young's modulus observed in lesions was useful for differentiating between benign and malignant lesions (12, 13). Athanasiou et al. (12) assessed 20 invasive carcinomas and 28 benign lesions, including seven cysts, and reported that the mean Young's modulus of the malignant lesions (147 kPa) was significantly higher than the mean Young's modulus of the benign lesions (45 kPa) (P < 0.001). In our own study the mean Young's modulus values of the benign lesions and malignant lesions were 42 kPa and 146 kPa, respectively, very close to the values reported by Athanasiou et al. (12), and the difference between them was statistically significant (P < 0.0001).
In the present study we classified the image patterns visually before using Young's modulus. There were two reasons for doing so. One reason was that the Young's modulus of the interior tissue in the ROI has already been incorporated as information in the SWE images themselves, and the numerical values are displayed in colors. Thus, if the measurement conditions are made uniform, SWE images of different lesions can be compared, and to some extent it appears possible to evaluate whether a lesion is hard or soft visually. We also think it is more efficient to use Young's modulus after having to some extent screened lesions according to the visual pattern classification than to measure the Young's modulus of every lesion. The second reason is that vertical stripe pattern artifacts were observed rather frequently. Such artifacts are thought to be unique to SWE, and although they may be attributable to compression by the probe, there has been no particular description of them in previous reports, and their precise nature remains unclear. Turning our attention to one of the patterns in the present study, we found that Pattern 2 was observed in 14% of the lesions, and the fact that the mean Young's modulus was higher in the Pattern 2 lesions (52 kPa) than in the Pattern 1 lesions (19 kPa) appears to have been due to these artifacts. In the future we think that testing will be necessary in order to reduce this artifact, and it is hoped that the result will be an improvement in the diagnostic accuracy of SWE.
The results of this study showed that when Patterns 1 and 2 were judged to indicate benign lesions and Patterns 3 and 4 to indicate malignant lesions, sensitivity was 91.3% (63/69), and specificity was 80.6% (25/31). Evans et al. (13) reported a sensitivity of 97% and specificity of 83% in 53 solid breast masses when they made 50 kPa the cut-off value. However, in the present study no statistically significant difference between the mean Young's modulus of the benign lesions and malignant lesions was found in Pattern 3, meaning that no significance to adding Young's modulus measurements could be detected in the Pattern 3 lesions. By contrast, the Young's modulus of the benign Pattern 4 lesions (50 kPa) was lower than the lowest Young's modulus of the malignant Pattern 4 lesions (61 kPa). After adding the Young's modulus measurements sensitivity was 91.3% (63/69) and specificity was 83.9% (26/31), and an improvement in specificity was observed. Nevertheless, there was only one false-positive Pattern 4 lesion, and we think further study will be essential in the future.
The fact that there were relatively few false-positive lesions in the visual pattern classification suggests that there is little likelihood of benign lesions being included in Patterns 3 and 4. This may be one of the distinctive characteristics of SWE. Pattern 3 consists of a group of lesions that exhibit a state in which propagation of the shear wave reaches the margin of the lesion, and the site is displayed in color, but no shear wave is detected in the interior, the so-called ‘black-hole’ phenomenon. A black hole was also present in many of the Pattern 4 lesions as well. This is thought to be a phenomenon in which the shear wave cannot be measured in the interior of the lesion either because of attenuation of the energy of the shear wave at the margin of the lesion or because the interior of the lesion is very hard (because the velocity of the shear wave is high), and this phenomenon itself may be a sign that suggests malignancy. Moreover, when we compared the characteristics of the malignant lesions in Patterns 3 and 4, we observed statistically significant differences between both the mean Young's modulus and the mean lesion size (P = 0.0001, P = 0.0002, respectively). Thus, the tendency to exhibit Pattern 3 was stronger in the small lesions, and Young's modulus tended to be lower. In fact, Young's modulus was significantly correlated with the lesion size of the Pattern 3 and Pattern 4 malignant lesions (r = 0.50; P < 0.0001), and we think it corroborates that using a Young's modulus cut-off value alone to make the differential diagnosis between benign and malignant lesions is insufficient.
The most important point is how to utilize the pattern classification of the SWE images in actual clinical practice. According to the results of the present study, applying the pattern classification of the SWE images to BI-RADS-US category 4 lesions was most useful for differentiating between benign and malignant lesions. The accuracy of BI-RADS-US and SWE was 81% and 88%, respectively, and it was possible to increase their accuracy to 90% by using a BI-RADS-US and SWE in combination. However, the NPV was not 100% (81.8%), and we think that in the future it will be necessary to determine which BI-RADS-US category 4 lesions can be ‘downgraded’.
This study had several limitations: First, there were only 31 benign lesions (31%). The reason for their low frequency is that many of the US examinations in our hospital are performed on patients who have been referred to us because a malignancy was suspected on the basis of a US examination at another hospital. That created a bias in this study, and we think that a study in which the number of benign lesions has been increased will be necessary in the future. Second, according to the results of this study the frequency of malignancy among the BI-RADS-US category 4 lesions was 73.6% (53/72), and clearly higher than the frequencies of 16–47% (16–19) in other reports. No ‘low suspicious malignancy’ lesions, whose course is monitored without performing tissue sampling, were included even among the BI-RADS-US category 4 lesions in this study. A study that includes cases that are monitored for a long time without performing tissue sampling will be important in the future. We think that even more accurate specificity will be revealed by that study. Third, only solid mass lesions were eligible for inclusion in the present study, whereas in actual clinical practice unnecessary biopsies are performed on many cystic lesions (complicated cysts or complex masses). In the future we think that it will also be necessary to assess the usefulness of SWE in regard to cystic lesions. Lastly, the visual evaluations were all performed by one radiologist. Creating a visual pattern classification was the main purpose of this study, and the pattern classification appeared to be useful clinically. In the future, we think that it will be essential to test inter-observer variability when using the classification and to conduct a prospective study.
In conclusion, SWE appeared to be useful in diagnosing whether solid breast masses were malignant or benign. The visual pattern classification was useful in the evaluation method, and it was hoped that adding Young's modulus measurements will improve specificity. We think that the significance of Young's modulus measurements and appropriate SWE evaluation criteria will be established by increasing the number of lesions in the future, and especially by accumulating false-positive lesions.