
Abstract
Background
Three-dimensional (3D) turbo spin-echo (TSE) images have been used in imaging of the extremities and comparable diagnostic performance to two-dimensional (2D) TSE images has been reported in several studies. However, comparison of the 3D isotropic TSE intermediate-weighted sequence and 3D FFE sequence in terms of image quality has not been investigated.
Purpose
To compare the image quality of a 3D isotropic TSE intermediate-weighted sequence with refocusing control (volume isotropic turbo spin echo acquisition [VISTA]) and a 3D isotropic fast-field echo (FFE) sequence of the knee joint.
Material and Methods
3.0 T knee MRI with VISTA and 3D FFE sequences was performed in 10 healthy volunteers (3 men, 7 women; age range 26–30 years). Two radiologists with specialties in the musculoskeletal system assessed tissue contrast between the fluid-cruciate ligament (F-L), fluid-meniscus (F-M), and fluid-cartilage (F-C) based on a 4-point scale (1, poor; 2, fair; 3, good; and 4, excellent). Statistical analysis for inter-observer agreement and differences in grades in tissue contrast between VISTA and 3D FFE images (Wilcoxon signed-rank) were performed. For a quantitative analysis, the signal-to-noise ratio (SNR) was obtained by imaging phantom and noise-only image. Image contrast ratios (CRs) were calculated between F-L, F-M, and F-C in volunteer images of VISTA and 3D FFE and compared statistically with a paired t-test.
Results
Based on qualitative analysis, VISTA had statistically superior grades of tissue contrast in F-L (P < 0.001) and F-M (P < 0.001). 3D FFE had superior but not statistically significant (P = 0.317) grades in F-C. Based on quantitative analysis, the SNR of the phantom imaging was higher in VISTA than that in 3D FFE (28.18 vs. 14.90). VISTA had superior CRs in F-L (P < 0.001) and F-M (P < 0.001). 3D FFE had superior CR in F-C (P = 0.038).
Conclusion
The VISTA sequence was superior in tissue contrast between F-M and F-L, and 3D FFE was superior in tissue contrast between F-C, subjectively and quantitatively.
Magnetic resonance (MR) imaging is an accurate and non-invasive method to identify internal derangement of the knee (1, 2). Traditional two-dimensional (2D) turbo spin-echo (TSE) imaging has high accuracy, but requires multiple imaging planes. Several three-dimensional (3D) fast-field echo (FFE) imaging methods have been used in the evaluation of the knee with multiplanar reconstruction, but insufficient soft tissue contrast leads to limitations in detection of internal derangement of the knee (3–5). Since the application of 3D TSE images with intermediate-weighted sequence in musculoskeletal imaging were introduced (4), 3D TSE images have been used in imaging of the extremities and comparable diagnostic performance to 2D TSE images has been reported in several studies (4, 6–9). However, comparison of the 3D isotropic TSE intermediate-weighted sequence and 3D FFE sequence in terms of image quality has not been investigated. Thus, we compared the image quality of the 3D isotropic TSE intermediate-weighted sequence and the 3D isotropic FFE of the knee joint.
Material and Methods
Subjects
The Institutional Review Board approved this HIPAA-compliant study, and informed consent was obtained. Between November 2009 and April 2010, a knee MR imaging was performed in 10 healthy volunteers (3 men, 7 women; age range 26–30 years) who had no history of operations or injuries involving the knee joint.
MR imaging protocol
MR protocols of VISTA and 3D FFE
*Selective partial inversion recovery
†Binominal radiofrequency pulse with flip angle of 11.25° and 33.75° in 1:3:3:1 spectral spatial pulses
VISTA images were acquired in the sagittal plane utilizing a 3D TSE non-selective method, driven-equilibrium (DRIVE) radio frequency pulse, and an asymmetric TSE profile order. 3D FFE images were obtained in the sagittal plane. A binominal RF pulse with a flip angle of 11.25° and 33.75° in 1:3:3:1 spectral spatial pulses were used for strong fat suppression for 3D FFE.
Phantom study
To quantitatively assess the signal-to-noise ratio (SNR) at parallel imaging, we measured noise via noise-only data (10, 11). A bottle phantom containing white mineral oil (liquid petroleum at 20°C) 27 cm in height with a 2000 cc capacity was scanned with VISTA and 3D FFE sequences. The phantom was positioned at the center of the images and scanned in the sagittal plane. Noise-only data was acquired with the RF turned off for parameters of each VISTA and 3D FFE sequence. Both object and noise-only data were reconstructed offline to apply parallel imaging calibration weights, homodyne partial Fourier phase correction, and multichannel image combination to the noise-only data. To calculate the SNR of the phantom, ROIs were placed in the reconstructed object images to measure mean signal intensities and duplicated in the noise-only reconstructions to measure noise.
Qualitative analysis
Two radiologists specializing in musculoskeletal imaging who were not blinded to the used sequence (YCY and JWK with 6 and 5 years of experience in musculoskeletal MR imaging, respectively) independently evaluated the VISTA and 3D FFE images of the volunteers. All information, such as parameters and imaging time, were removed from image when they performed qualitative evaluation. The time interval between the two sessions (sets of VISTA and 3D FFE) was 2 weeks. The images of each volunteer were evaluated using a picture archiving and communication system (PACS, Centricity Radiology RA 1000; GE Healthcare, Chicago, IL, USA). The tissue contrast between the fluid-ligaments (F-L; posterior cruciate ligament at the intercondylar area), fluid-meniscus (F-M; at the posterior horn of the medial meniscus), and fluid-cartilage (F-C; at the retropatellar cartilage) was subjectively assessed based on a 4-point scale (1, poor; 2, fair; 3, good; and 4, excellent).
Quantitative analysis
We measured the SNR in VISTA and 3D FFE with the following calculation: SNR = mean of the object (Mobject)/ standard deviation of the noise in the object (SDobject). As SDobject is biased by proper signal variation, it was estimated from the mean of the noise image at the same location. For a Rician distribution in the absence of the signal, the SDobject is calculated as the mean of the noise image/1.253 (12). Hence, the SNR = Mobject/SDobject = 1.253 × Mobject/Mnoise, where Mnoise is the mean of the noise image (12, 13). To obtain the Mobject and Mnoise, we applied 435.7mm2 sized region-of-interests (ROIs) at the same position of the phantom image and noise data.
For a quantitative analysis, image contrast ratios (CRs) were calculated between the F-L, F-M, and F-C in the VISTA and 3D FFE (13, 14). Regions of interest (ROIs) were placed in the respective tissues with the area as large as possible to avoid the inclusion of confounding structures. The smallest accepted size of a ROI included at least 3 mm2. The image contrast between the specific tissues was calculated by dividing the difference between the signal intensity (SI) of the reference tissue and the SI of the compared tissue by the sum of the SI of the reference tissue and the SI of the compared tissue, as follows: (SIref − SIctiss)/(SIref + SIctiss), where SIref is the SI of the reference tissue – the synovial fluid, and the SIctiss is the SI of the compared tissue. The three categories per sequence for the calculation of image CRs were as follows: the CR of the SI of cartilage to the SI fluid; the CR of the SI of the ligament to the SI of the fluid; and the CR of the SI of the meniscus to the SI of the fluid. To ensure consistency, all ROI placements were made by the same radiology resident (JMS with 3 years of experience).
Statistical analysis
Inter-observer agreement between the two observers was calculated using kappa statistics. The strength of agreement was considered less than chance (0.00), slight (0.01–0.20), fair (0.21–0.40), moderate (0.41–0.60), substantial (0.61–0.80), and near perfect (0.81–0.99) (15). For the non-squared data, the percent agreement was calculated for inter-observer agreement. To evaluate the differences in subjective grades of tissue contrast between the VISTA and 3D FFE, a Wilcoxon signed-rank test was performed. The image CRs between the VISTA and 3D FFE were compared using the paired t-test. A P value <0.05 was considered statistically significant.
Results
Qualitative analysis
Inter-observer agreement resulting from subjective evaluation of VISTA and 3D FFE by two radiologists
Kappa values are presented with 95% confidential interval. Non-squared data are presented as the percent agreement
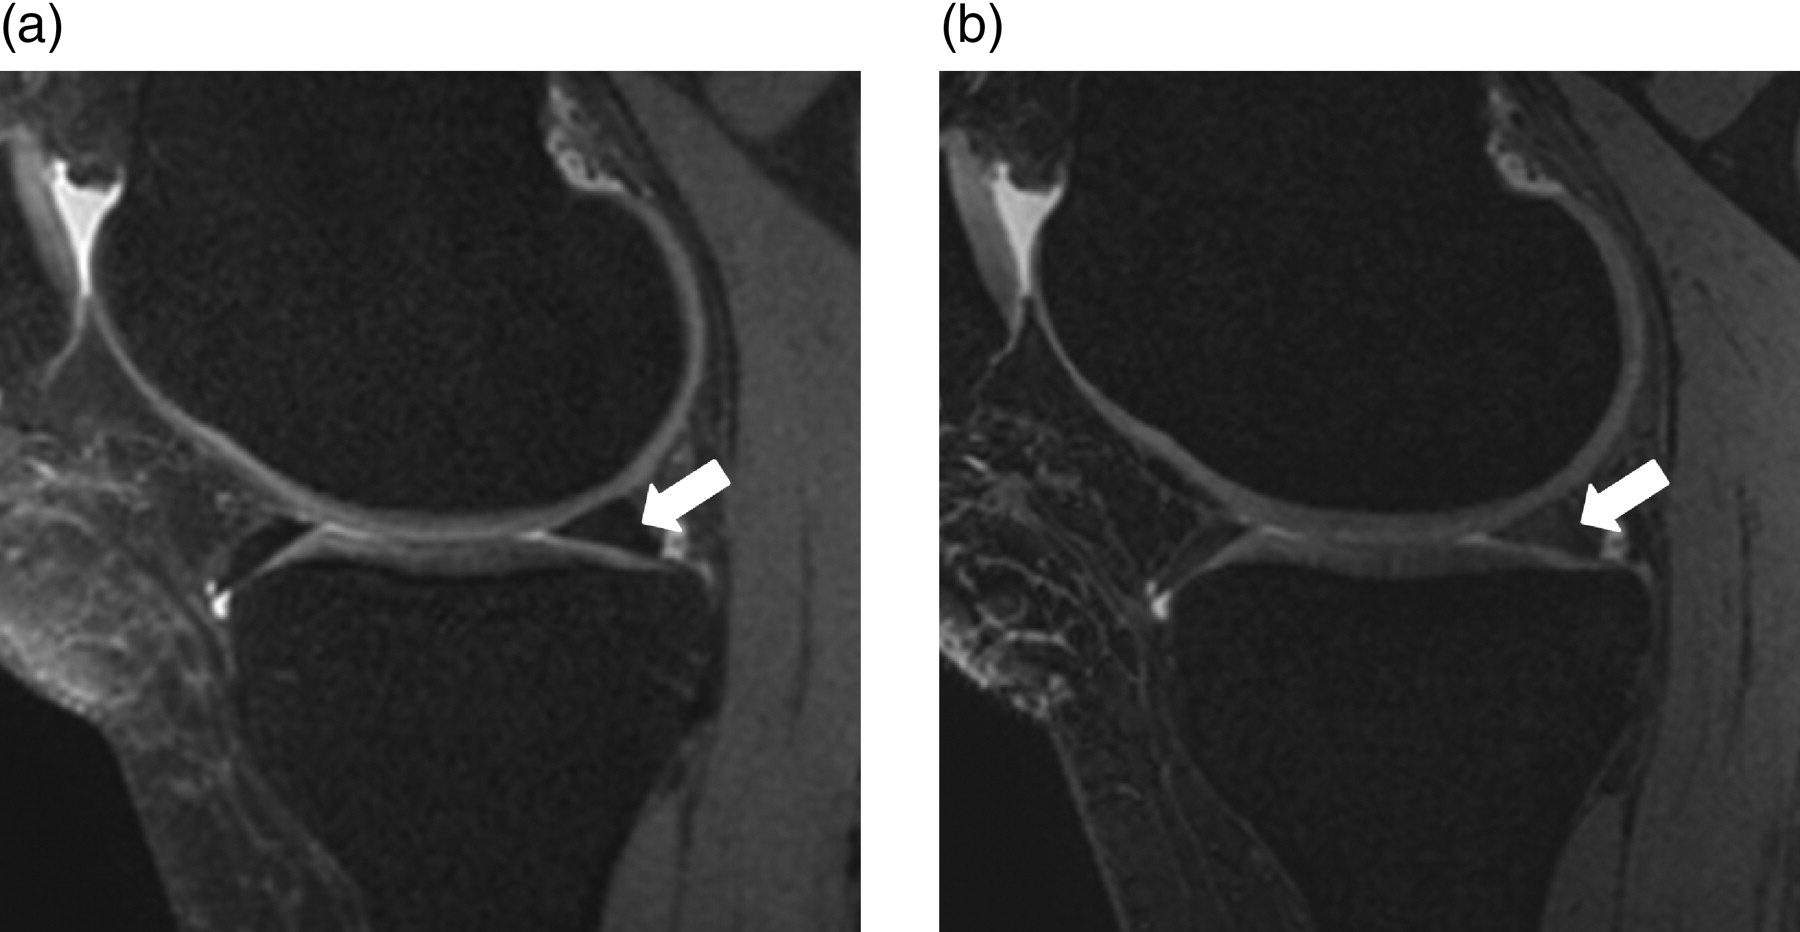
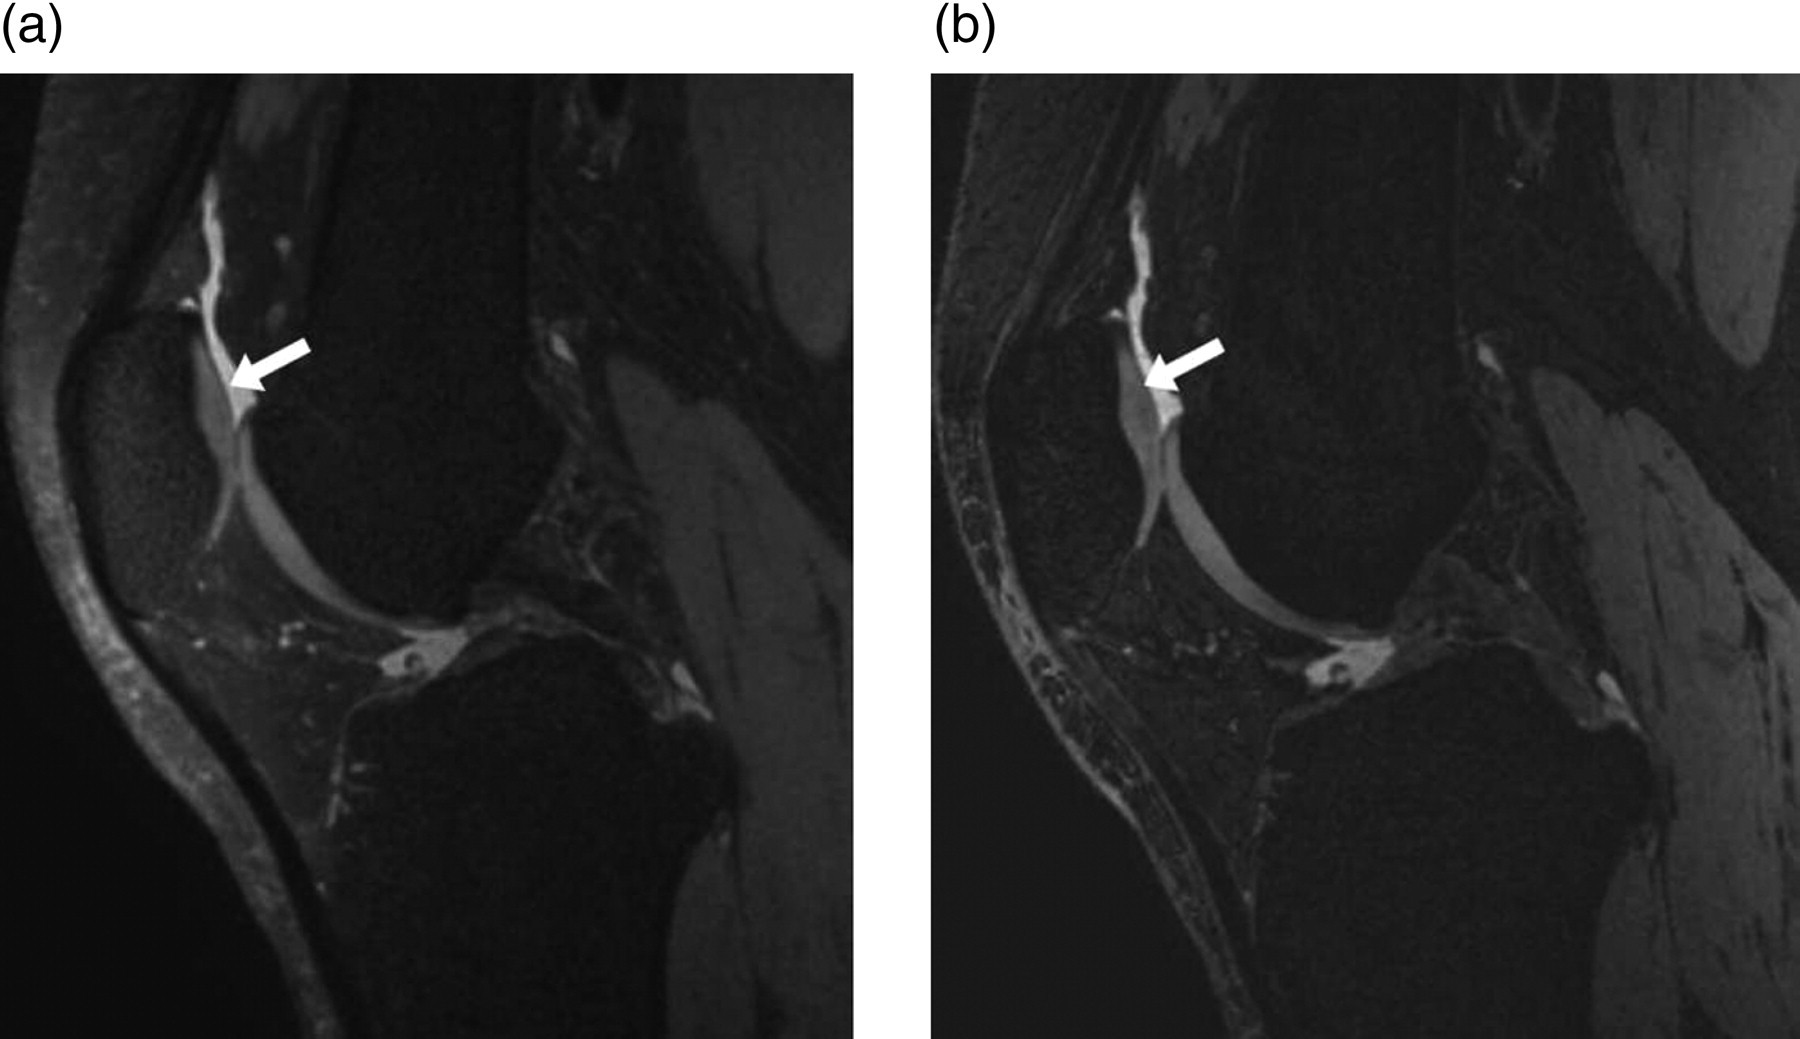
Table 3 illustrates the results of subjective analysis of tissue contrasts. The tissue contrast between F-L was statistically superior with VISTA compared to 3D FFE (P < 0.001; Fig. 1). The tissue contrast between F-M was statistically superior with VISTA compared to 3D FFE (P < 0.001; Fig. 2). The tissue contrast between F-C was superior with 3D FFE compared to VISTA, but not statistically significant (P = 0.317; Fig. 3).
The MR images of the right knee in a 29-year-old female volunteer. With VISTA (a), observers 1 and 2 recorded the grade of contrast between the fluid-ligament (arrows) as excellent and good, respectively. With 3D FFE (b), observers 1 and 2 recorded the grade of contrast between the fluid-ligament as good and fair, respectively. CR was calculated as 0.83 on VISTA, and 0.69 on 3D FFE The MR images of the right knee in a 29-year-old female volunteer. Observers 1 and 2 graded the tissue contrast between the fluid-meniscus (arrows) as excellent on VISTA (a), and good on 3D FFE (b). CR was calculated as 0.80 on VISTA, and 0.71 on 3D FFE The MR images of the right knee in a 30-year-old female volunteer. With VISTA (a), observers 1 and 2 graded the tissue contrast between the fluid-cartilage (arrows) as good. With 3D FFE (b), observers 1 and 2 graded the tissue contrast between the fluid-ligament as good and fair, respectively. CR was calculated as 0.23 on VISTA, and 0.34 on 3D FFE Subjective analysis of tissue contrast on VISTA and 3D FFE Numbers represent ‘excellent-good-fair-poor’ tissue contrast of 10 volunteers assessed by each observer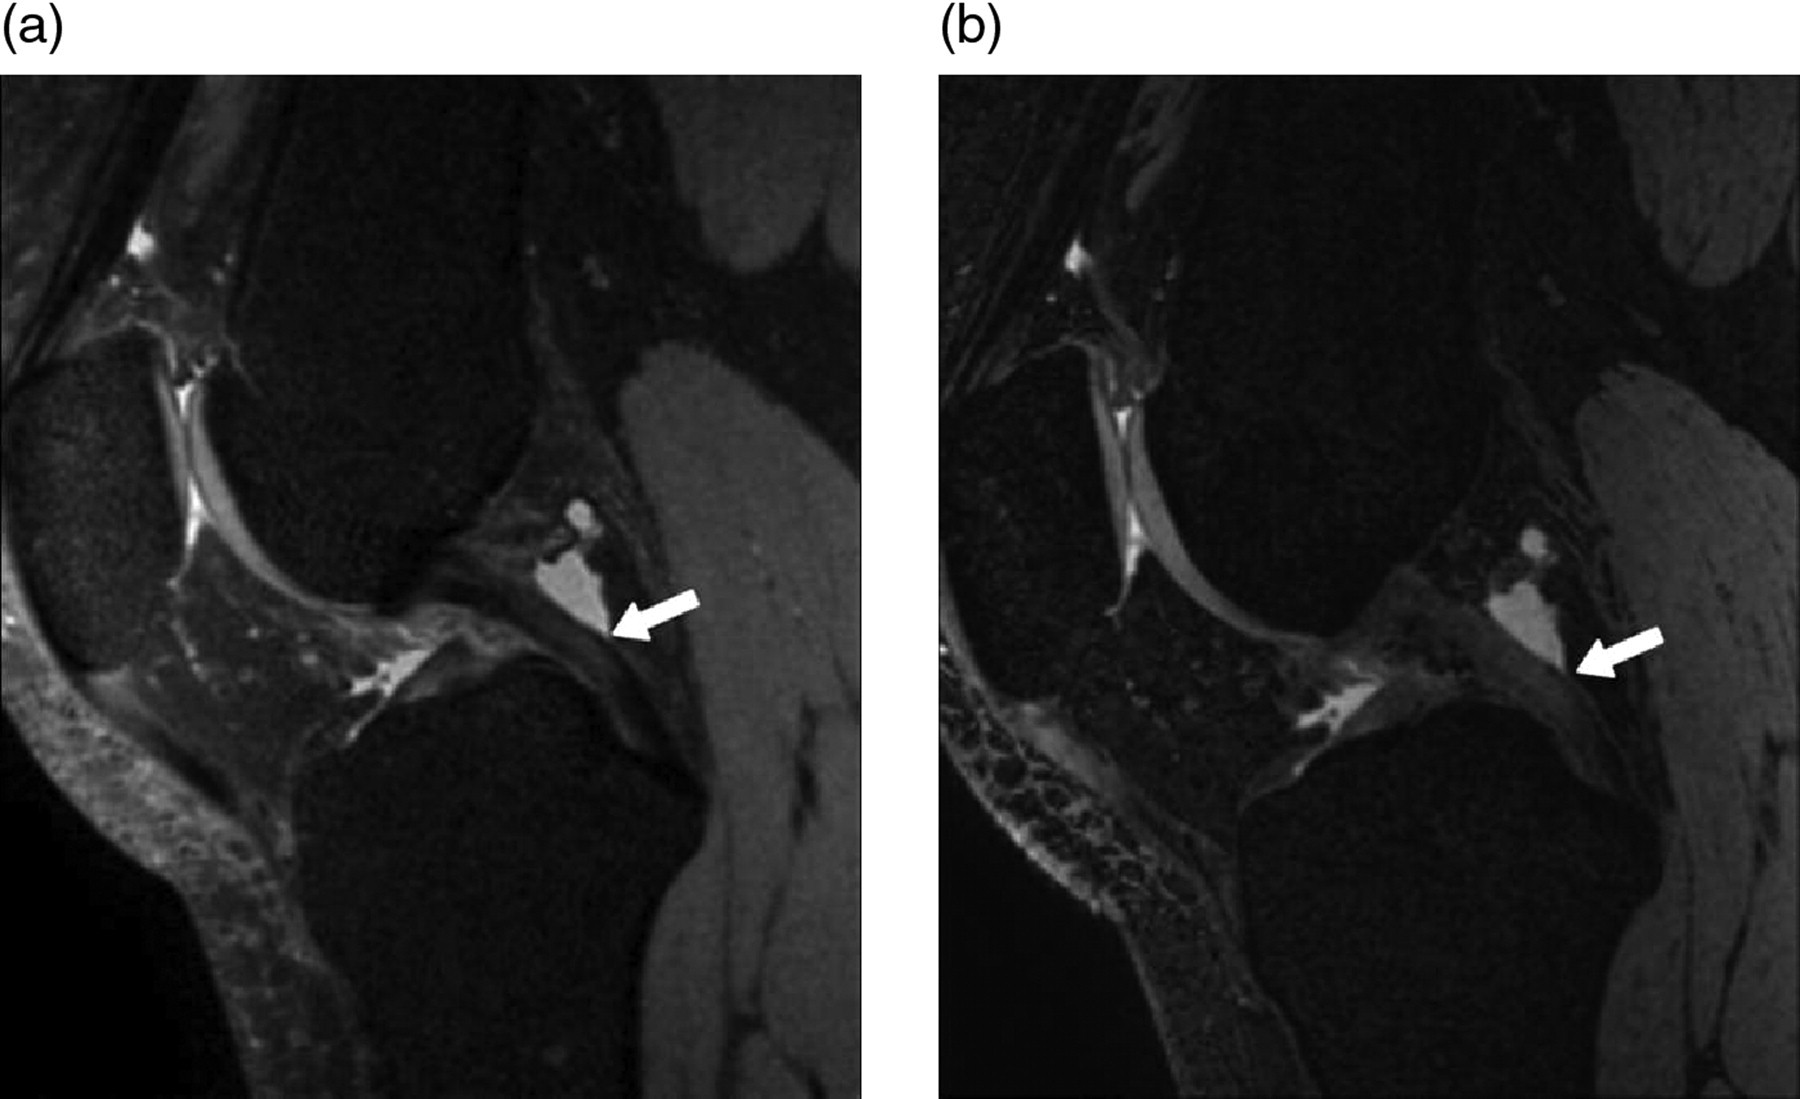
Quantitative analysis
On the phantom study, the SNR of VISTA was 28.18 (=1.253 × 1068.3/47.5), and the SNR of 3D FFE was 14.90 (=1.253 × 1040.5/87.5).
The mean image CR between F-L was 0.76 (±0.07) on VISTA and 0.71(±0.07) on 3D FFE, which was statistically superior with VISTA (P < 0.001). The mean image CR between F-M was 0.82 (±0.06) on VISTA and 0.74 (±0.06) on 3D FFE, which was statistically superior with VISTA (P < 0.001). The mean image CR between F-C was 0.27 (±0.07) on VISTA and 0.31 (±0.08) on 3D FFE, which showed a significantly higher value on 3D FFE (P = 0.038; Fig. 4).
Box and whisker plot of the mean image CRs between the fluid-ligament, fluid-meniscus and fluid-cartilage on VISTA and 3D FFE. The mean image CRs between fluid-ligament and between fluid-meniscus on VISTA are significantly higher than those on 3D FFE (P < 0.001). The mean image CR between fluid-cartilage on 3D FFE is significantly higher than that on VISTA (P = 0.038)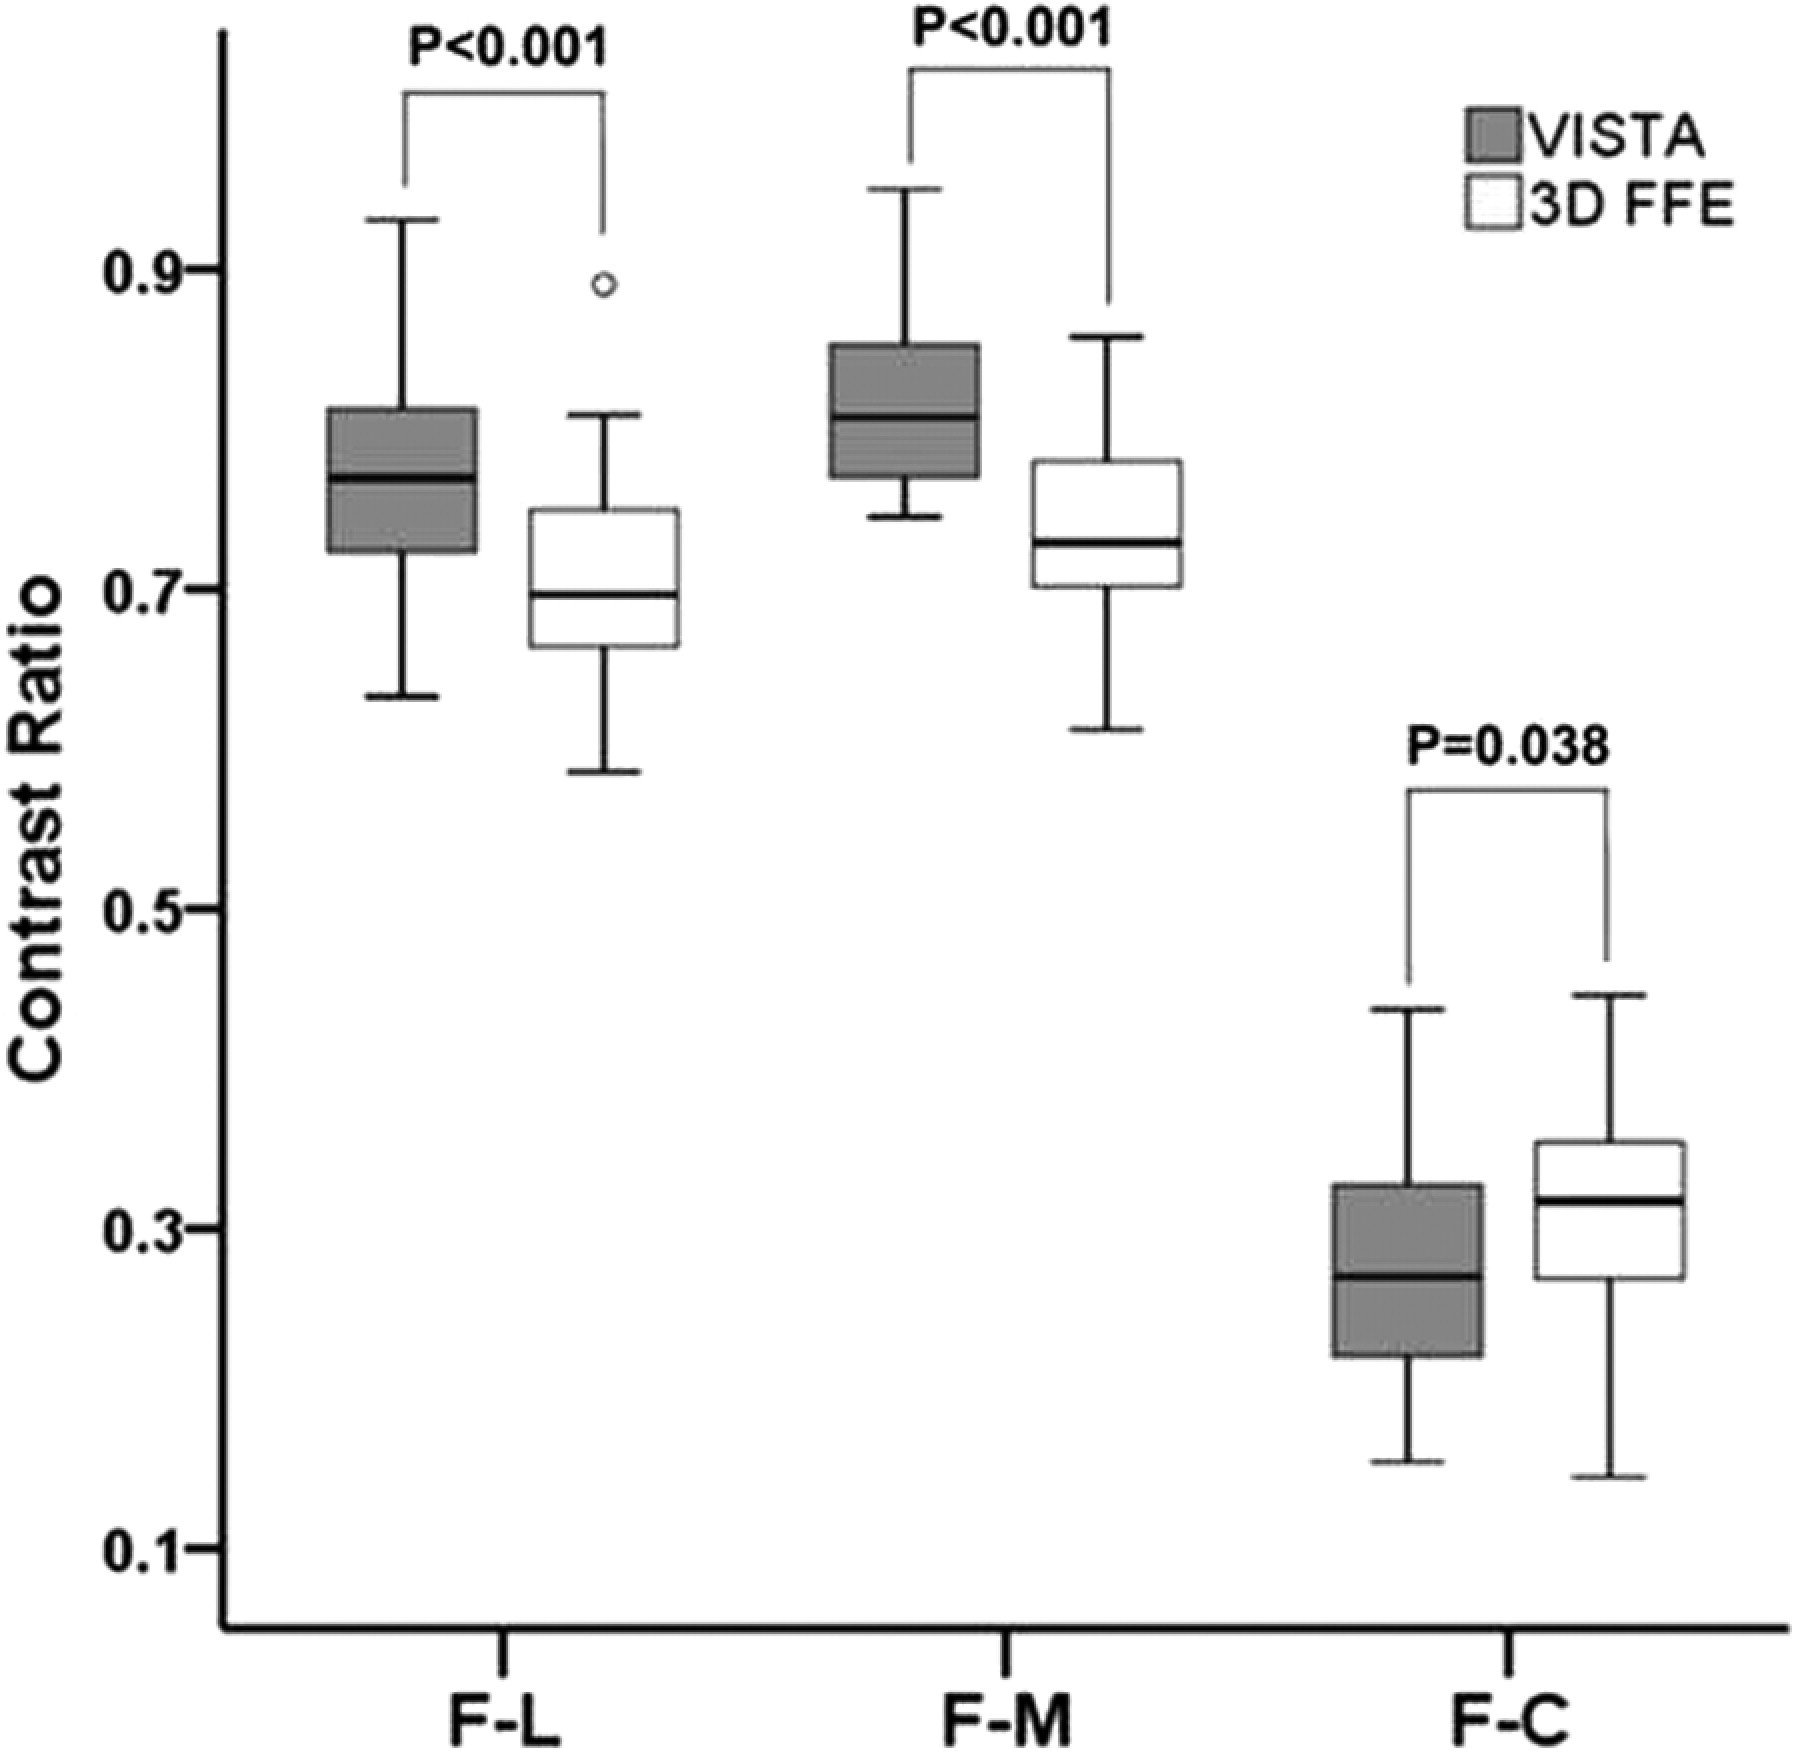
Discussion
The previous studies reported that 3D isotropic TSE enables thin section data acquisition and multiplanar image reformation, which helps detection and analysis of complex structures in musculoskeletal imaging. In addition, favorable tissue contrast in assessment of ligaments, menisci, and cartilage yields high sensitivity and specificity in the diagnosis of cruciate ligament and meniscal tears (2, 4, 7, 8). In evaluating internal derangement of the knee, it has been reported that 3D TSE had high-quality isotropic images with similar contrast to 2D-TSE (6). Two clinical studies showed that the diagnostic performance of 3D TSE with multiplanar reformation for internal derangement of the knee was comparable to that of conventional sequences consisting of 2D TSE (8, 16). Similarly, Stevens et al. (7) reported that 3D TSE had a comparable SNR to 2D TSE with an acceptable imaging time and ability to reform the images in arbitrary planes in evaluation of internal derangement of the ankle. However, there were two reports postulating that diagnostic efficacy of 3D TSE was inferior to that of 2D TSE for meniscal tears (17, 18).
The 3D FFE sequence for musculoskeletal imaging has been widely applied to various conditions, such as hyaline cartilage defects of the knee, anterior cruciate ligament tears, and the demonstration of triangular fibrocartilage tears (19–21). However, several drawbacks have limited the use of 3D FFE for evaluation of internal derangements of joints. A relatively higher signal intensity of normal menisci with 3D FFE was reported (5, 20). Thus, the specificity of the 3D FFE sequence in diagnosing meniscal tears could be reduced. The 3D isotropic FFE sequence used in the present study was a non-spoiled gradient echo sequence using binomial RF pulse for fat suppression with water excitation. In musculoskeletal imaging, water excitation is related to an increase in the SNR and contrast-to-noise ratio (CNR), and better uniformity of fat suppression and reduction of artifacts are considered better overall quality and diagnostically more useful than fat-saturated images for all sequences.
In the present study, 3D VISTA was statistically superior to 3D FFE in tissue contrast between F-M and F-L in subjective and quantitative analyses. Similar to previous studies that have reported a comparison of 2D SE with 3D FFE (5, 20, 22, 23), the present study also suggests that the detection of meniscus and ligament injuries will be facilitated with 3D TSE sequences compared to 3D FFE. In previous studies, 2D SE sequences showed high negative predictive values for meniscal injuries, whereas 3D FFE had lower specificity with high false-positive findings caused by excessive high signal intensity for degenerative intrameniscal changes (5). 2D SE images also assessed anterior cruciate ligament tears more reliably than 3D FFE, with favorable sensitivities and specificities (5, 20, 22, 23). This is explained by less tissue contrast of the 3D FFE images, which prevents the detection of signal inhomogeneity and intervening fluid collections (23). The thinner slice thickness with a lesser degree of flow artifact from the popliteal artery did not overcome this major drawback (5, 20, 22, 23).
In contrast, 3D FFE had statistically significant and superior image CR compared to VISTA between F-C. In a subjective study, also tissue contrast between F-C was superior in 3D FFE to VISTA sequence though not statistically significant. The results of the present study are similar to previous studies reporting inferior sensitivity of TSE for cartilage lesion detection and promising results of 3D FFE for detection of cartilage defects (19, 24–26). The extended echo-train length used in 3D TSE might cause loss of SNR and CNR of the tissues with a short T2 relaxation time and can be related to blurring (27). However, there are some studies that show poor diagnostic performance of 3D FFE in the detection of early chondromalacia or surface irregularity of the hyaline cartilage (28, 29). Thus, although 3D FFE has a superior SNR or CNR, the clinical value of 3D FFE compared to 3D SE-based images in detection of cartilaginous lesions is still controversial and in need of additional investigation. In contrast to current study, cartilage SNR of 3D turbo spin echo sequence was much higher than those of 3D isotropic sequences with gradient echo sequences (30). These differences may be attributed by difference in SNR and CNR calculations, as parallel imaging was used in 3D TSE sequence, but SNR and CNR were acquired with a conventional method. As objective assessment parameters, we used SNR of the phantom images and CR of volunteer images. CNR is degraded by image noise while CR depends only on the mean signal intensity. The conventional method to acquire SNR and CNR based on standard deviation of background cannot be applicable to parallel images whose noise distribution is not homogenous (31).
This study had several limitations. The first limitation was that only healthy volunteers were imaged and the number was relatively small. An additional study will be necessary to compare the diagnostic usefulness of VISTA and 3D FFE in detection of internal derangement of the knee with a correlation to arthroscopic findings. Second, the 2D TSE sequence was not assessed in the present study. However, previous studies regarding a comparison of the SNR and CNR between 3D TSE and 2D TSE in the knee joint have been reported (6, 9). Third, although all information, such as parameters and imaging time, were removed from images when they evaluated qualitatively, they might not be blinded to the used sequence because they were using the VISTA sequence in daily practice. Thus, it might make a bias.
In conclusion, the VISTA sequence was subjectively and quantitatively superior in tissue contrast between F-M and F-L, and 3D FFE was quantitatively superior in tissue contrast between F-C.