
Abstract
Background
Though previous investigators have attempted to evaluate its utility in characterization of focal renal lesions, diffusion-weighted MR imaging (DW MRI) in renal diseases is still an evolving field and its role in predicting the aggressiveness of renal cell carcinoma (RCC) is yet to be established.
Purpose
To assess whether apparent diffusion coefficient (ADC) values can be used to determine the nuclear grade and histological subtype of RCCs and to identify the tumor attributes contributing to variation in ADC values.
Material and Methods
The institutional ethics committee waived the requirement of informed consent for this retrospective study. The study cohort consisted of 33 patients who underwent MRI (with diffusion-weighted imaging at b values of 0 and 500 s/mm2) and were found to have 36 pathologically-proven RCCs. ADC values were determined for solid portions of RCC, cystic/hemorrhagic areas, and normal renal parenchyma. Histological subtype, nuclear grade, and cell count were determined for each lesion. ADC values were compared between different grades and subtypes and correlation with cell count was investigated. Receiver operating characteristic curves were drawn to establish cut-off ADC values.
Results
There were 23 low grade (grades I and II) and 13 high grade tumors (grades III and IV). There were 32 clear-cell and four non-clear-cell RCCs. A decreasing trend of ADC values was seen with increasing grade and mean ADC of high grade RCC was significantly lower than low grade (1.3145 vs 1.6982 × 10⁻³ mm2/s) (P = 0.005). Mean ADC for clear-cell RCC was significantly higher than non-clear-cell RCC (1.6245 vs. 1.0412 × 10⁻³ mm2/s) (P = 0.005). ADC values higher than 1.7960 × 10⁻³ mm2/s were seen only with low grade and values greater than 1.4904 × 10⁻³ mm2/s were seen only with clear-cell RCC.
Conclusion
ADC values provide a non-invasive means to predict the nuclear grade and histological subtype of RCC. Cellularity and morphology are other tumor attributes contributing to the variation in ADC values of RCCs.
Renal cell carcinoma (RCC) accounts for 5% of the cancers in men and 3% of the cancers in women (1). Despite its increasing incidence, the proportion of deaths due to RCC has been gradually decreasing (1, 2). Factors responsible for increased survival include advances in imaging as well as expansion of therapeutic paradigms (2). There is growing interest, not only in characterization and extent delineation of renal neoplasms, but also in preoperative histological subtyping and grading. Concomitant with the detection of smaller and early stage tumors, there has been a shift in the surgical paradigm from radical nephrectomy to nephron-sparing surgeries and also emergence of newer treatment modalities like radiofrequency ablation and cryoablation (3, 4).
Individual RCCs differ in their biologic behavior and not all lesions are destined to progress, metastasize, or recur. There are limited means to preoperatively assess this aggressiveness of a lesion. Considering the risks of bleeding, infection, tumor seeding, and taking into account false-negative and indeterminate results of biopsy/aspiration, non-invasive methods to predict the aggressiveness of RCC would be an ideal choice.
Tumor-related prognostic factors include pathological stage, nuclear grade, and histological subtype of RCC. The widely accepted Fuhrman's nuclear grade for RCC has been found to be the most effective parameter in predicting the biological aggressiveness and metastatic potential of RCC (5). This is especially true in case of stage I neoplasms and in case of clear-cell subtype (5–10). To increase the reproducibility and reduce the intra-/inter-observer variability, Fuhrman's grades can be merged into two-tiered system: grades I and II as low grade, and grades III and IV as high grade, without any compromise in the predictive accuracy of nuclear grade (6–10). Clear-cell RCC has a poorer prognosis as compared to papillary and chromophobe types; but there is no significant difference between the latter two (9–11). Histological distinction between clear-cell and non-clear-cell types of RCC is also important because of different sensitivity of these subtypes to targeted immunotherapies (tyrosine kinase inhibitors sunitinib and sorafenib are effective against clear-cell RCCs whereas rapamycin inhibitor temsirolimus is effective against papillary RCC) (12–14).
Diffusion-weighted MR imaging (DW MRI) provides quantification of Brownian motion of water molecules in tissues, which depends on tissue organization, cellularity, integrity of cell membranes, and extracellular space tortousity (15). DW MRI in renal diseases is still an evolving field and many investigators have attempted to evaluate its utility in characterization of focal renal lesions (16–22), renal parenchymal disease (18, 23) and renal infections (24–26). The apparent diffusion coefficient (ADC) values in RCC have been reported to be lower than normal renal parenchyma, though the range is wide and shows overlap with other lesions as well as with normal parenchyma (16–22). ADC appears to be a complex variable that may be influenced by multiple factors including nuclear grade, histological subtype, cellularity, and morphology of RCC. There are only few studies which have evaluated the correlation of ADC values with nuclear grade (22, 27), histological subtype (20, 22, 28), and cellularity (29, 30) of RCC.
The purpose of this study was to assess whether ADC values can be used to determine the nuclear grade and histological subtype of RCC. We also investigated the relationship of ADC values with tumor cellularity and morphology of RCC. An attempt was made to identify the tumor attributes which contribute to variation in the ADC values in RCCs.
Material and Methods
Subject population and gold standard
This was a single-institution retrospective study approved by the institutional ethics committee and the need to obtain informed consent was waived. A review was performed of all patients who underwent MRI (with DW imaging) for renal mass lesions from January 2009 to September 2010 and had pathologically-proven RCC. The final study cohort consisted of 33 patients (26 men, 7 women, mean age 48.7 years, age range 21–80 years) with 36 histologically-proven RCCs. Thirty-two of these tumors were surgically resected while four underwent ultrasound-guided biopsy. Good quality diffusion-weighted images and ADC maps could be obtained in all the patients.
MRI
All patients underwent MR imaging on a 1.5 Tesla scanner (Siemens, Avanto, Erlangen, Germany) (maximum gradient strength 45 mTm−1, maximum slew rate 200 mTm−1s−1) using a phased array body coil with patient in supine position. Two 6-element body matrix coils were placed anteriorly and used in conjunction with two posterior spine clusters (3 channels each) to optimize the signal-to-noise ratio (SNR). The imaging protocol included True Fast Imaging and Steady Precession (True FISP) axial and coronal sequences, which served as a localizer for planning of further sequences. Then T1-weighted axial (in and opposed) and fat-suppressed (FS) T2-weighted axial and coronal sequences were acquired. Dynamic contrast-enhanced MR was performed using Gadobenate dimeglumine (MultiHance; Bracco, Milan, Italy), injected IV via a dual head pressure injector (Spectris Solaris, Medrad, Philadelphia, PA, USA) at the rate of 2 mL/s followed by 20 mL saline flush at the same rate. The dose employed was 0.1 mmol/kg body weight and contrast was withheld if the GFR was less than 30 mL/min/1.73m2. Post-contrast T1-weighted FS 3D volume interpolated breath-hold examination (VIBE) sequence was acquired in the axial plane in cortico-medullary, nephrographic, and pyelographic phases and in coronal plane in nephrographic phase. A pre-contrast T1-weighted FS VIBE axial was also acquired so that subtracted images could be generated.
DW MR imaging
Respiratory triggered FS spin echo – echo planar axial diffusion-weighted sequence at b values of 0 and 500 s/mm2 was done prior to contrast administration, using parallel imaging based on generalized autocalibrating partially parallel acquisition (GRAPPA) with two-fold acceleration factor and diffusion gradients applied in all three orthogonal directions separately. The following parameters were used: EPI factor 95, TR/TE 1600/62 milliseconds, flip angle 90 degrees, slice thickness 7 mm, distance factor 30%, number of averages 6, receiver bandwidth 1735 Hz/pixel, field of view 249 × 380, matrix 94 × 192, acquisition time 2–4 minutes (depending on patient's respiratory cycle). The DW sequence was respiratory triggered using navigator triggered prospective acquisition correction technique (PACE) in which diaphragmatic position is assessed periodically by navigator echoes. Trace diffusion-weighted images and ADC maps were derived automatically on a voxel-by-voxel basis. The maximum b value of 500 s/mm2 was chosen as an optimal compromise between adequate diffusion-weighting and image quality.
Image analysis
The imaging data were reviewed by three radiologists in consensus (having 20, 15, and 10 years of experience in abdominal MR imaging). The diffusion-weighted images at b values of 0 and 500 s/mm2 were qualitatively assessed to evaluate whether the renal lesion exhibited free/restricted diffusion. If there was an increase in signal intensity on b 500 s/mm2 images (compared to b 0 s/mm2 images), it was categorized as restricted diffusion while loss of signal on b 500 s/mm2 images was interpreted as free diffusion.
Regions of interest (ROIs) for quantitative measurement of ADC were placed on a commercial workstation by a single radiologist with 3 years of experience in interpretation of abdominal MRI. The following technique was employed: to measure the representative ADC of the renal tumor (ADClesion), circular ROIs (with minimum area of 1 cm2) were placed on the solid portions of the lesion showing restricted diffusion (areas showing enhancement on post-contrast images or visibly dark areas on ADC maps). ADC value from single ROI (for lesions <2 cms) or mean value from multiple ROIs (for lesions >2 cms) was considered as representative ADC of the renal tumor. ADC maps were reviewed in conjunction with T2-weighted and post-contrast images so as to ensure the placement of ROIs (for ADClesion) on the solid portion of the renal lesion (avoiding necrotic/cystic and hemorrhagic areas). In case of renal lesions showing free diffusion (entirely cystic RCCs), ROI was placed on the most homogeneous portion. To measure the ADC of a normal kidney, circular ROI of size 1 cm2 was placed on the contralateral normal renal parenchyma, without any preference for cortex/medulla. In addition to the ROIs for ADClesion, wherever applicable, ROIs were also placed specifically on the non-enhancing necrotic/cystic portions and T1 hyperintense portions of the renal tumors so as to measure the ADC values of these regions. The ADC values were expressed as mean ± standard deviation in the form of A × 10−3 mm2/s up to four decimal places.
Histopathological analysis
The histopathological sample was retrospectively reviewed by two pathologists in consensus (having 20 and 10 years of experience, respectively), who were unaware of the MR imaging findings. Histological subtype and Fuhrman's nuclear grade were assigned for each lesion. Cellularity count was done for the surgically resected specimens (n = 32) both manually and automated as follows: (a) For manual cellularity count, the cell count was done manually in a pre-defined area at 40× objective (Nikon microscope, Japan) in at least two representative sections for each case. The resulting mean value was taken as the manual cellularity count; (b) For automated cellularity index, photomicrographs of at least two representative areas were taken using 20 × objective on Olympus® BX-50 (Japan) optical microscope. A cool SNAP-PRO of color (Media Cybernetics Inc., Bethesda, MD, USA) CCD camera was used to take digital images. The photographs were saved in .jpg or .tif formats, ISO-10918-1 with quality set to 100% and using ‘Baseline (Standard)’ compression algorithm. Image morphometry was done using Image pro-plus 4.1 software (Media Cybernetics Inc., Bethesda, MD, USA). Contrast inversion and segmentation of the images was done to accentuate the color contrast of different components. The total number of nuclei (including those of endothelial cells) in the image were counted by selecting the nuclear color intensity and mean from two representative images was taken as the automated cellularity index.
Statistical analysis
Statistical analysis was performed using SPSS software (version 17.0, SPSS, Chicago, IL, USA). For comparing the ADC values between I–IV nuclear grades of RCCs and clear-cell, papillary, and chromophobe RCCs, one way ANOVA (ANalysis Of VAriance) was employed and post-hoc analysis was done using LSD alpha. Student's t-test was used to evaluate the difference between ADC values of low grade and high grade RCCs; and clear-cell and non-clear-cell RCCs. Box and whisker plots were drawn based on median and interquartile ranges to highlight the difference between the groups and variation within the groups. Receiver operating characteristic (ROC) curves were drawn to find out area under the curve (AUC) for differentiation of two groups and cut-off ADC values were calculated so as to achieve highest average sensitivity and specificity. To explore the relation between ADC values and cellularity counts, scatter plots were drawn and Pearson's correlation coefficient was calculated by bivariate correlation. All P values < 0.05 were taken as statistically significant.
Results
Lesion characteristics
There were 36 pathologically-proven RCCs in 33 patients in our study. The mean tumor size was 6.87 ± 3.96 cms. Based on Fuhrman's nuclear grade, there were four grade I (11.1%), 19 grade II (52.8%), nine grade III (25%), and four grade IV RCCs (11.1%). Nuclear grades I and II were clubbed as low grade and nuclear grades III and IV were clubbed as high grade RCC. Thus there were 23 low grade and 13 high grade RCCs. As per histological subtype, there were 32 clear-cell (88.9%), three papillary (8.3%), and one chromophobe RCC (2.8%). Papillary and chromophobe RCCs were combined into one group because of small numbers of these subtypes and also because the clinically relevant distinction is between clear-cell and non-clear-cell types. Thus there were 32 clear-cell types and four non-clear-cell types of RCCs.
The mean ADC value for normal renal parenchyma was found to be 2.3431 ± 0.1291 (×10−3 mm2/s) (range = 1.9354–2.5421 (×10−3 mm2/s)). Thirty-three RCCs (91.7%) in our study showed restricted diffusion while three entirely cystic RCCs showed free diffusion. Mean ADC value for RCCs was 1.5597 ± 0.4054 (×10−3 mm2/s) (range = 0.5642–2.5217 (×10−3 mm2/s)) and this was significantly lower than that of normal renal parenchyma (P < 0.0001).
ADC variation with nuclear grade of RCC
There was a decreasing trend of ADC values with increasing nuclear grade (Fig. 1) and the difference between ADC values of these groups was found to be statistically significant (P = 0.009). Mean ADC value for grade I RCC was 1.9797 ± 0.5201 (×10−3 mm2/s), for grade II RCC was 1.6389 ± 0.3573 (×10−3 mm2/s), for grade III RCC was 1.3765 ± 0.3083 (×10−3 mm2/s), and for grade IV RCC was 1.1752 ± 0.2354 (×10−3 mm2/s). However on post-hoc analysis, ADC values of grade I RCC were not significantly different from grade II. Similarly ADC values of grade III RCC were not significantly different from grade IV. On clubbing the nuclear grades into low grade and high grade, ADC values of high grade RCC (1.3145 ± 0.2942 (×10−3 mm2/s)) were found to be significantly lower than those of low grade RCC (1.6982 ± 0.3985 (×10−3 mm2/s)) (P = 0.005) (Figs. 2 and 3).

Box and whisker plot shows a decreasing trend of ADC values with increasing nuclear grade of RCC. Lines within boxes represent median value. Top and bottom of boxes (hinges) represent 25th and 75th percentiles of data values. The T-bars that extend from the boxes (whiskers) are expected to include approximately 95% of the data (assuming normal distribution). The points are outliers and asterisks are extreme outliers
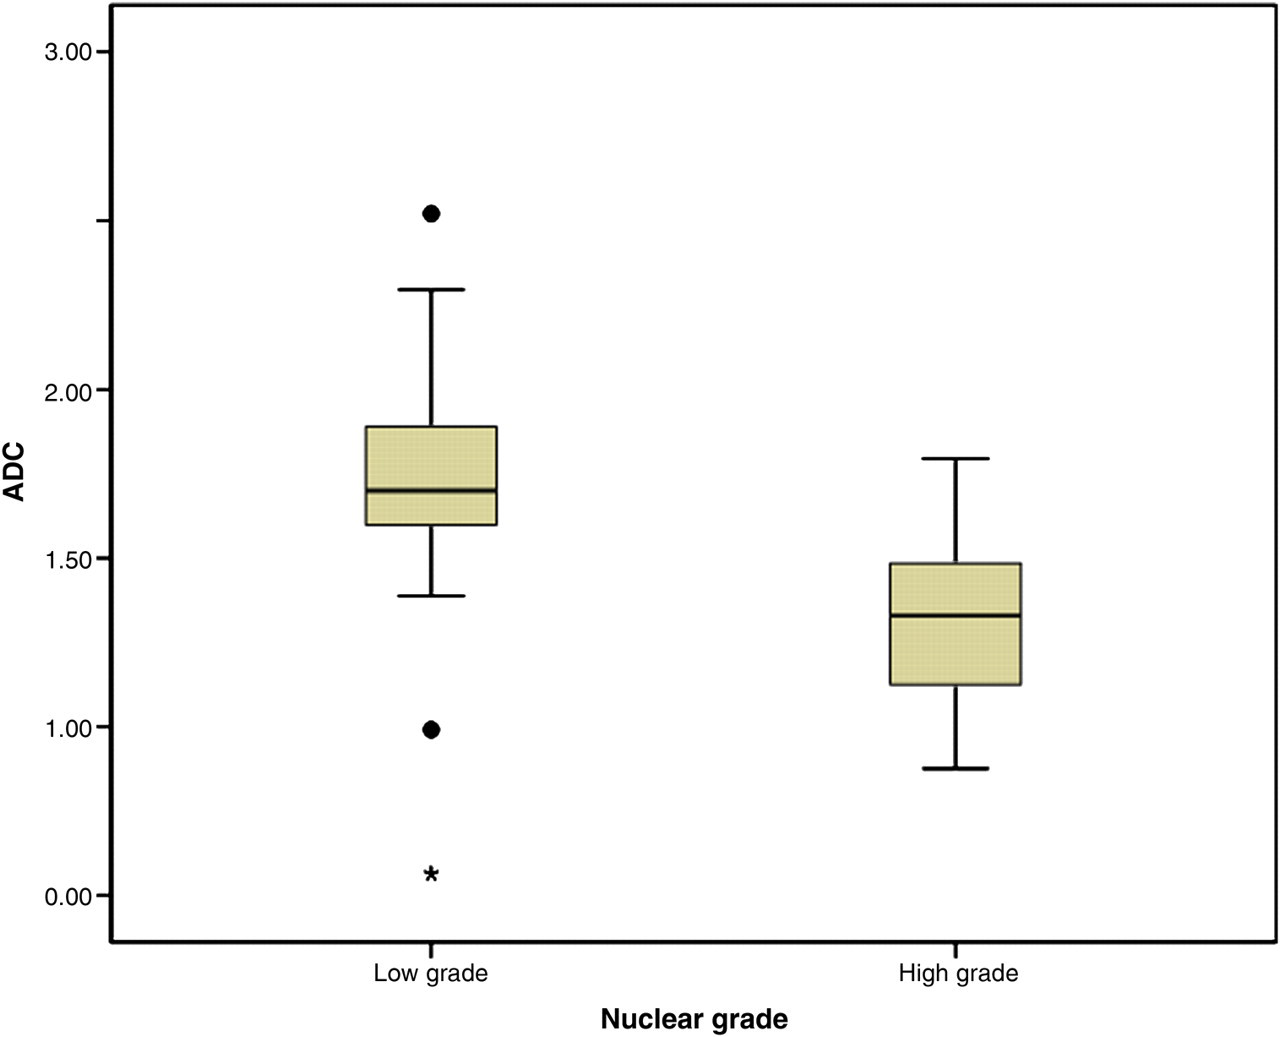
Box and whisker plot of ADC values in low grade (nuclear grades I and II) and high grade (nuclear grades III and IV) RCC shows lower ADC values associated with high grade RCC
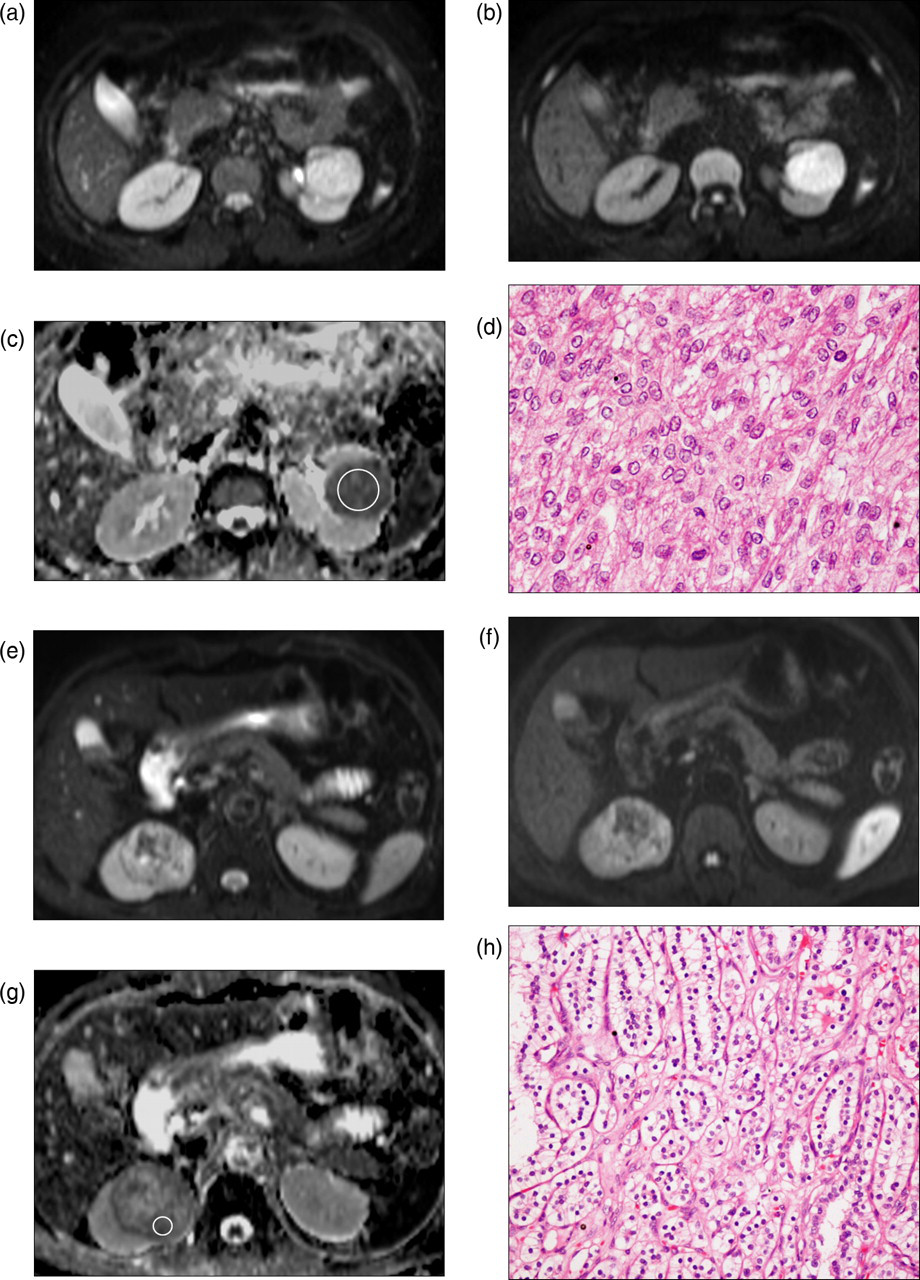
High grade RCC in a 40-year-old woman (a–d). Axial diffusion-weighted (DW) images at b value of 0 s/mm2 (a), 500 s/mm2 (b), and ADC map (c) show marked restriction of diffusion in the well-circumscribed left renal interpolar mass lesion with a mean ADC value of 1.3268 (×10−3 mm2/s), suggestive of high grade RCC. Circle in (c) depicts example of ROI placement. Histological photomicrograph (d) confirms high grade clear-cell RCC (Fuhrman's grade 3) (original magnification ×40; hematoxylin-eosin [H-E] stain). Low grade RCC in a 48-year-old man (e–h). Axial DW images at b value of 0 s/mm2 (e), 500 s/mm2 (f), and ADC map (g) show heterogeneous restriction of diffusion in the right renal mass lesion with a mean ADC value of 1.7945 (×10−3 mm2/s), suggestive of low grade RCC. Circle in (g) depicts example of ROI placement. Histological photomicrograph (h) confirms low grade clear-cell RCC (Fuhrman's grade 1) (original magnification ×20; hematoxylin-eosin [H-E] stain)
ADC variation with histological subtype of RCC
Mean ADC value for clear cell RCC was 1.6245 ± 0.3641 (×10−3 mm2/s), for papillary RCC was 1.0578 ± 0.4639 (×10−3 mm2/s), for chromophobe RCC was 0.9912 (×10−3 mm2/s), and the difference was statistically significant (P = 0.020). On combining papillary and chromophobe RCCs into non-clear-cell type, mean ADC value was found to be 1.0412 ± 0.3803 (×10−3 mm2/s) and this was significantly lower than the clear-cell type (P = 0.005) (Figs. 4 and 5).
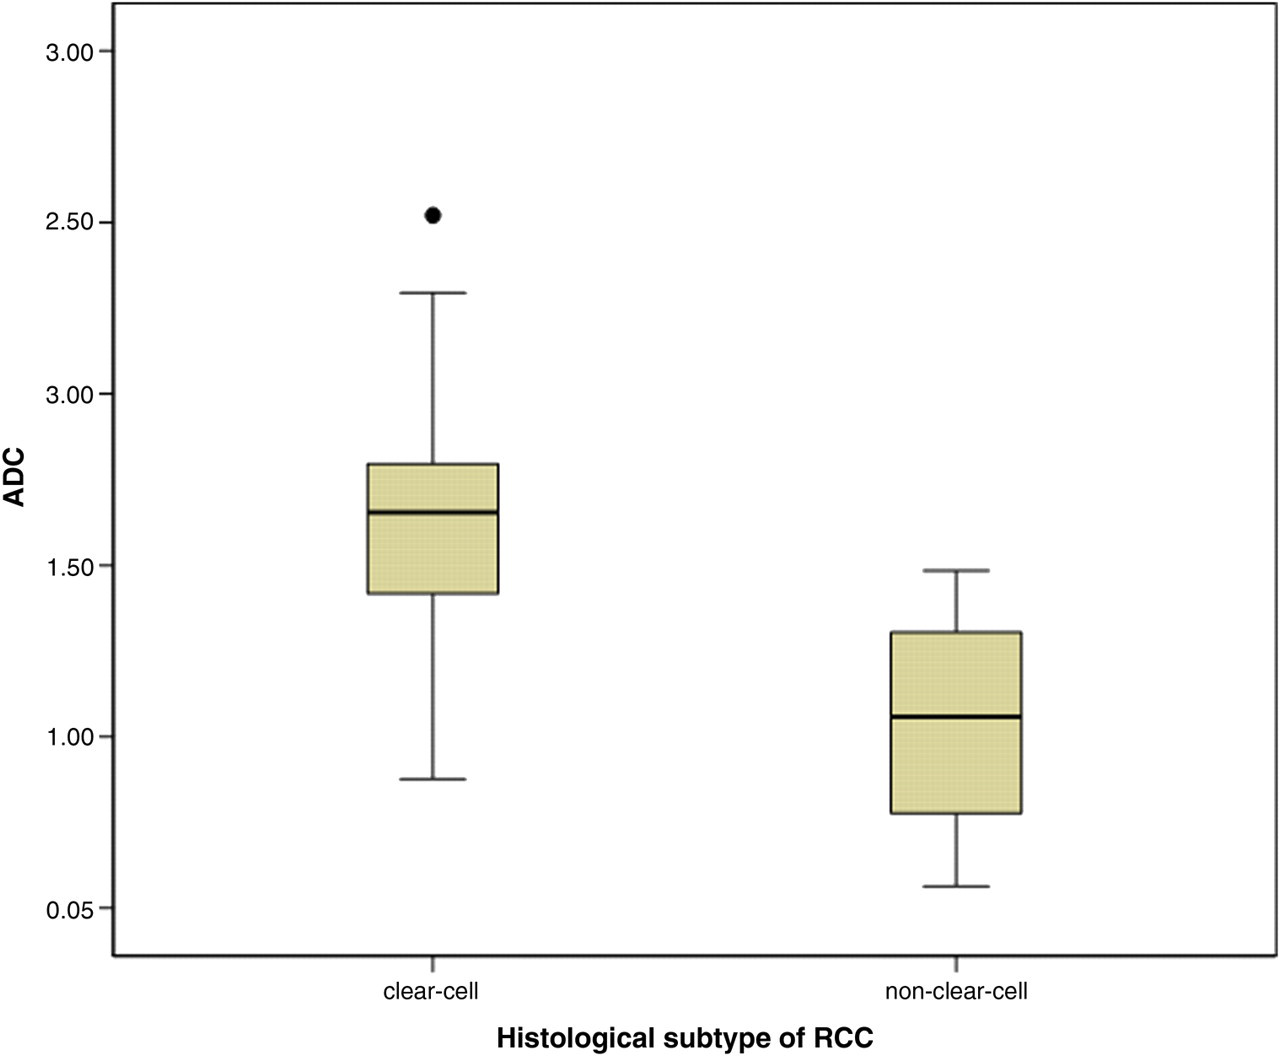
Box and whisker plot of ADC values in clear-cell and non-clear-cell RCC shows higher ADC values associated with clear-cell subtype
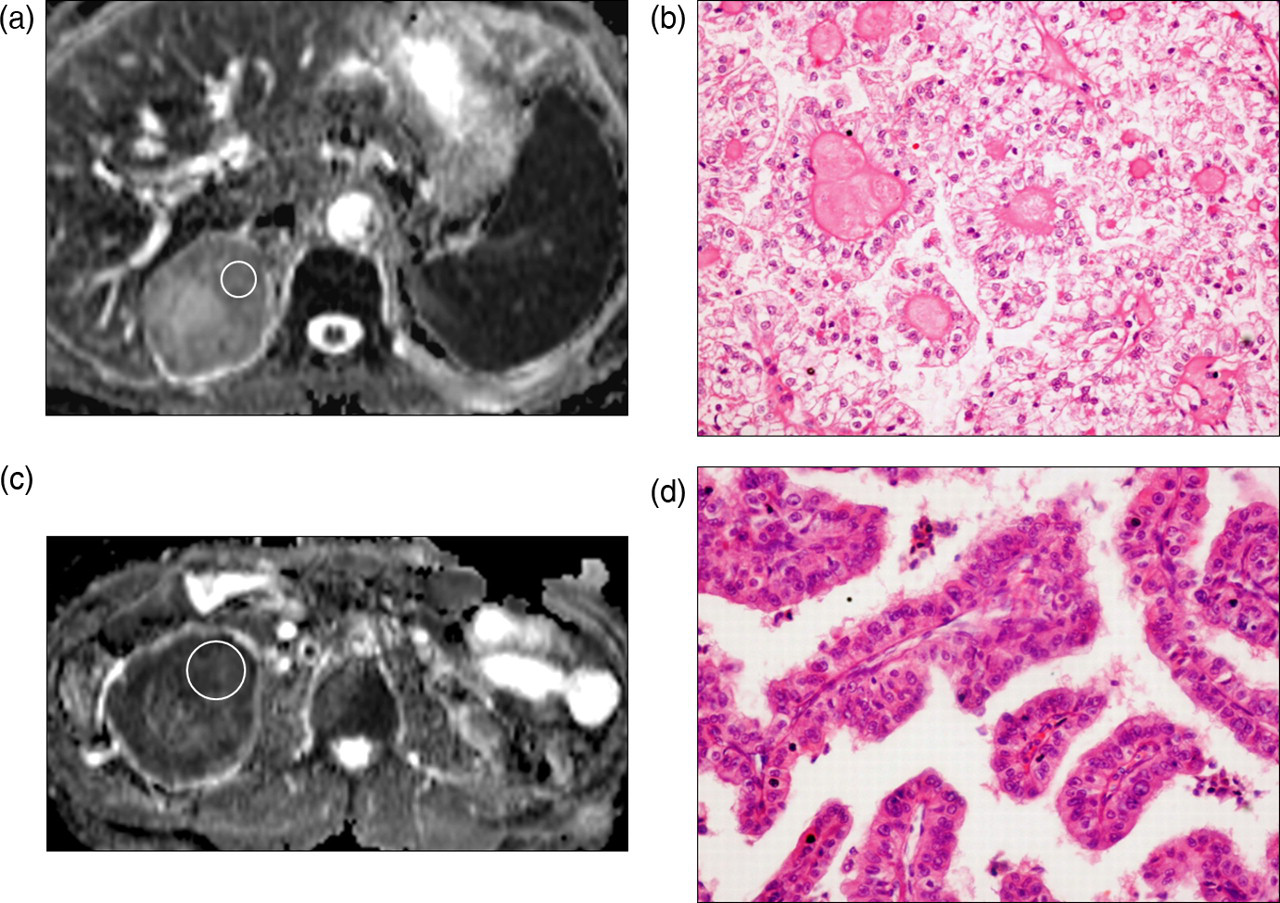
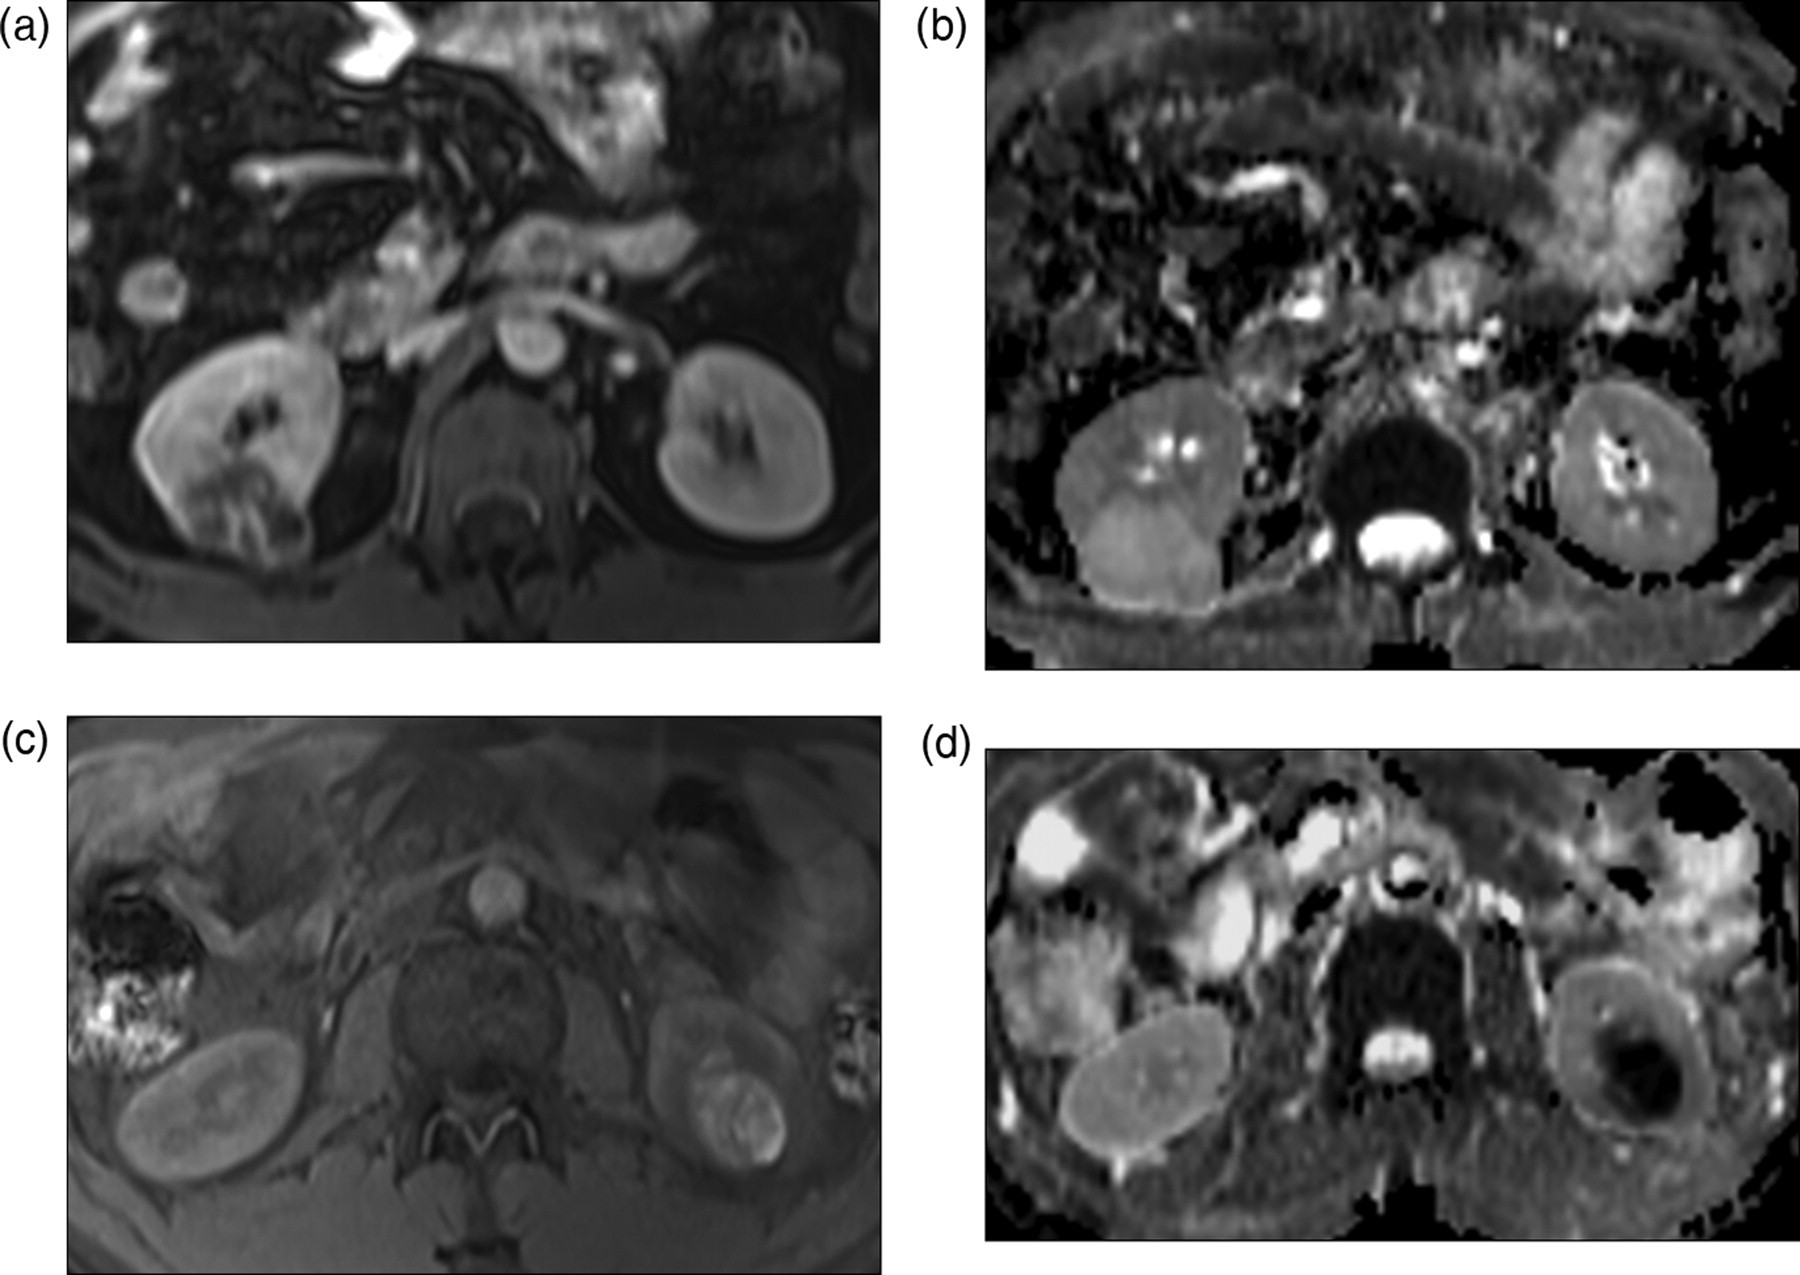
Clear-cell RCC in a 48-year-old man (a, b). ADC map (a) shows mild heterogeneous restriction of diffusion in the right renal upper polar mass lesion with a mean ADC value of 1.7654 (×10−3 mm2/s), suggestive of clear-cell subtype. Circle in (a) depicts example of ROI placement. Histological photomicrograph (b) confirms (low grade) clear-cell RCC (original magnification ×20; hematoxylin-eosin [H-E] stain). Non-clear-cell RCC in a 55-year-old man (c, d). ADC map (c) shows marked restriction of diffusion in the right renal lower polar mass lesion with a mean ADC value of 1.1236 (×10−3 mm2/s), suggestive of non-clear-cell type. Circle in (c) depicts example of ROI placement. Histological photomicrograph (d) confirms (high grade) non-clear-cell RCC (Papillary RCC) (original magnification ×20; hematoxylin-eosin [H-E] stain)
ROC analysis
ROC analysis was performed for ADC in differentiating low grade and high grade RCC. For detection of high grade RCC, AUC was 0.816, SE = 0.076, P = 0.002 (Fig. 6a). For a cut-off ADC value of 1.5200 (×10−3 mm2/s), sensitivity was 84.6%, specificity was 82.6%, and 95% confidence intervals = (0.667, 0.965) (values below cut-off indicated high grade). In addition, ADC values higher than 1.7960 (×10−3 mm2/s) were seen only with low grade RCCs.
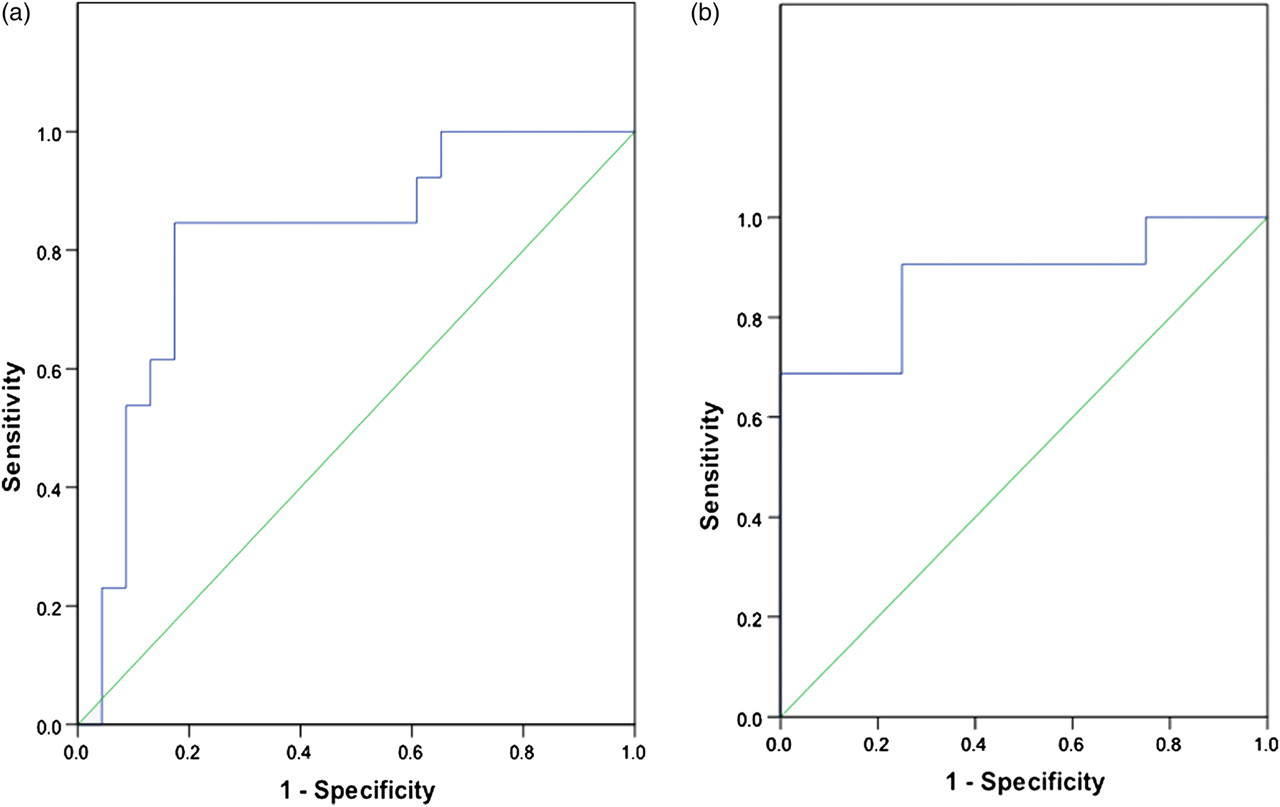
ROC curves (blue lines) for ADC in differentiation of low grade and high grade RCC (a) and clear-cell and non-clear-cell RCC (b). Straight diagonal green line spanning the middle of the graphs indicates an AUC of 0.5
ROC analysis was also performed for ADC in differentiating clear-cell and non-clear-cell types of RCC. For detection of clear-cell RCC, AUC was 0.875, SE = 0.072, P = 0.016 (Fig. 6b). For a cut-off ADC value of 1.4904 (×10−3 mm2/s), sensitivity was 68.8%, specificity was 100%, and 95% confidence intervals = (0.700, 1.000) (values above cut-off indicated clear cell RCC). Hence, ADC values greater than 1.4904 (×10−3 mm2/s) were seen only with clear-cell RCC.
ADC variation with cell count of RCC
There was inverse correlation between ADC values and manual cellularity count of RCC (R =–0.14). Similarly there was inverse correlation between ADC values and automated cellularity index of RCC (R =–0.32). However, these correlations were not found to be statistically significant.
ADC variation with morphology of RCC
Thirty-three out of 36 RCCs (91.7%) depicted areas of necrosis/cystic change on imaging while 19 (52.8%) depicted non-enhancing T1 hyperintense areas of hemorrhage/proteinaceous content within.
Compared to the solid portion of RCCs, ADC values of necrotic/cystic portions (2.4306 ± 0.3416 (×10−3 mm2/s)) were significantly higher (P = 0.000) whereas ADC values of T1 hyperintense hemorrhagic/proteinaceous portions (1.234 ± 0.734 (×10−3 mm2/s)] were lower (P = 0.07).
There were three completely cystic RCCs with little discernible solid components and all three showed free diffusion and high ADC values (Fig. 7). None of the solid RCCs (with clearly perceptible solid enhancing components) showed free diffusion. There was a single case of entirely hemorrhagic RCC with no definite enhancing components and it showed very low ADC values (Fig. 7).
Predominantly cystic RCC in a 42-year-old man (a, b). Axial contrast-enhanced FS VIBE image (a) shows predominantly cystic mass lesion arising exophytically from the posterior cortex of right kidney, showing enhancement in its wall and septations. ADC map (b) shows no restriction of diffusion in the mass with a mean ADC value of 2.4376 (×10−3 mm2/s). Mean ADC value of normal renal parenchyma in this case was 2.3651 (×10−3 mm2/s). Histopathology confirmed extensive cystic degeneration in the renal mass, which was proven to be clear-cell RCC. Predominantly hemorrhagic RCC in a 34-year-old man (c, d). Axial FS T1-weighted image (c) shows hyperintensity in the left renal mass lesion, suggestive of intralesional hemorrhage. ADC map (d) shows marked restriction of diffusion in the lesion with a mean ADC value of 0.4356 (×10−3 mm2/s). This severely restricted diffusion was attributable to the hemorrhagic component, and the mass was confirmed to be clear-cell RCC
Discussion
The accurate prediction of nuclear grade and histological subtype of RCC is of clinical importance because of worse prognosis associated with high grade RCC and with clear cell carcinomas. The clear-cut indications of minimally-invasive/nephron-sparing therapeutic options have not yet been established; and size and stage may not be the only determining criteria. The nuclear grade and histological type also merit consideration, as is the cellularity; since the latter may predict response to chemotherapeutic agents (31, 32). Even for extensive unresectable tumors, knowledge of grade and histological type is necessary for prognostication and for deciding the targeted chemotherapy.
Fifty-three percent of RCCs in our study were detected to have nuclear grade II. This is similar to the high prevalence of this grade in previous studies (8, 11, 27). Eighty-nine percent of RCCs in our study were clear-cell type, which is the most common histological subtype of RCC (33). Ninety-two percent of RCCs in our study depicted areas of necrosis/cystic change while 53% depicted areas of hemorrhage. This is in accordance with the fact that most of the RCCs are variegated tumors with areas of necrosis and hemorrhage (34).
Mean ADC value for normal kidney in our study was 2.3431 ± 0.1291 (×10−3 mm2/s), which is similar to the previously reported values (16, 28, 30). The mean ADC value of RCC was found to be significantly lower than that of normal renal parenchyma. However, the range of ADC values was wide and showed overlap with the normal parenchyma, as has been observed in previous studies (16–22).
There was a decreasing trend of ADC values with increasing nuclear grade and the mean ADC value of high grade RCCs was found to be significantly lower than that of low grade RCCs. ROC analysis revealed an AUC of 0.816 with optimal cut-off ADC value of 1.5200 (×10−3 mm2/s) and ADC values higher than 1.7960 (×10−3 mm2/s) were seen only with low grade RCCs. Sandrasegaran et al. (22) found that ADCs of high grade clear-cell cancers were lower than those of low grade, though the difference was not significant (1.77 vs. 1.95 (×10−3 mm2/s)). This may be due to the small number of cases in each group in their study (9 high grade and 8 low grade tumors). Rosenkrantz et al. (27) found that ADC-400 (at b values 0 and 400) was significantly lower among high grade than among low grade clear cell RCC (1.59 ± 0.57 vs. 2.24 ± 0.50 (×10−3 mm2/s)). They reported an AUC of 0.801 with the optimal threshold being 2.17 (×10−3 mm2/s). Hence, though the absolute reported ADC values show variations, the concept of lower ADC value associated with higher grade RCC seems unequivocal. It has been argued by previous investigators (27) that tumors for which ADC has been consistently shown to be inversely associated with grade (gliomas and prostatic adenocarcinomas) have grading systems based on cellularity, which thus explains the lower ADC values. On the contrary, Fuhrman's grading system for RCC is based solely on nuclear features. The possible explanation for this could be that with increasing Fuhrman's grade, there is increase in the size of the nucleus, nucleolus, nuclear-cytoplasmic ratio, and nuclear membrane irregularity, with presence of heavy chromatin clumps in high grade tumors (5, 8). This may contribute to the bulkiness of cells which in turn may pose greater hindrance to the motion of water molecules both in the extracellular and intracellular space.
The mean ADC value of clear-cell RCC was found to be significantly higher than that of non-clear-cell RCC. ROC analysis revealed an AUC of 0.875 with optimal cut-off ADC value of 1.4904 (×10−3 mm2/s) and ADC value greater than 1.4904 (×10−3 mm2/s) was seen only with clear-cell RCC. Taouli et al. (20) reported lower ADC values for papillary RCCs relative to non-papillary (mostly clear-cell) RCCs (1.43 ± 0.35 vs. 2.18 ± 0.63 (×10−3 mm2/s) at b = 0, 400). They postulated that this may be due to the fact that papillary and chromophobe RCCs are hypovascular lesions compared to clear-cell RCCs and ADC values represent the combined effects of capillary perfusion and diffusion. Sandrasegaran et al. (22) did not find any significant difference in the ADC values of clear-cell RCCs and non-clear-cell malignancies. Wang et al. (28) conducted a larger study at 3T MR system with 49 clear-cell, 22 papillary, and 14 chromophobe RCCs. In their study, clear-cell RCCs showed a significantly higher mean ADC (1.849 × 10⁻³ mm2/s) than papillary (1.087 × 10⁻³ mm2/s) and chromophobe (1.307 × 10⁻³ mm2/s) RCCs. There was no significant difference in the ADC values of papillary and chromophobe RCCs. Our findings are in concordance with their results. Again, though the absolute mean ADC values show minor variations, the pattern of higher ADC value associated with clear-cell RCC seems unambiguous. In clear-cell RCC, there are interspersed cystic and hemorrhagic areas within the tumor. Moreover, the cells have abundant clear cytoplasm (35). In papillary RCC, cells are organized into papillary projections, while in chromophobe RCC cells are arranged in solid sheets (35). This compact tissue architecture, higher nuclear cytoplasmic ratio (in papillary RCC) (35) and dense cytoplasm (in chromophobe RCC) (35) may be responsible for lower ADC values in non-clear-cell RCCs.
In the present study, an inverse correlation was found between the ADC values and automated cellularity index/manual cellularity count of RCC. However, it was not statistically significant. This may be due to the fact that ADC values are affected by a multitude of factors and cellularity alone may not have a major impact. Squillaci et al. (30) did not find any correlation between the ADC value of renal tumors and cellularity while Manenti et al. (31) reported significant inverse relationship at 3T MR system. However, it has been acknowledged in previous studies (15) that in adenocarcinomas and necrotic neoplasms, correlation may not be seen between the ADC values and tumor cellularity.
ADC values were found to be different for necrotic/cystic and hemorrhagic areas of RCC, as compared to the solid portions. This information needs to be kept in mind to avoid the placement of ROIs on necrotic/hemorrhagic areas, as these may show ADC values different from those representative of the lesion. Also an entirely cystic or hemorrhagic RCC may show ADC values different from the usual variety of RCCs (with some solid tumor tissue) and hence DW MRI may not be reliable in these cases (Fig. 7). An entirely cystic RCC may not show restricted diffusion at all, and ADC values may be higher than that of normal renal parenchyma (Fig. 7). Thus tumor morphology has an impact on the ADC value of RCCs and must be given due consideration while interpreting the diffusion-weighted images.
Hence ADC appears to be a complex variable which is affected by nuclear grade, histological subtype, cellularity, and morphology of RCC. ADC values, in turn, may help in predicting the aggressiveness of RCCs and preoperative prognostication by predicting the grade and subtype. A possible future role of this preoperative characterization may be in guiding the medical (in deciding targeted immunotherapy) and surgical (in deciding for nephron-sparing procedures) therapeutic decisions in RCC.
A confounding proposition that follows from the above discussion is that lower ADC value would imply high grade RCC (having poor prognosis) as well as non-clear-cell RCC (having better prognosis). Hence, ADC values should always be analyzed in conjunction with the conventional imaging criteria, especially for histological type and grade of RCC. Since 88.9% of the RCCs in our study were clear cell type, the prediction of nuclear grade (based on ADC values) may be more applicable to this subtype of RCCs.
There are several limitations of our study. First, due to the retrospective nature of our study, applicability of our findings to a broader patient population will require further studies. Second, conventional MR imaging features of low grade and high grade RCCs or of different histological subtypes of RCC were not evaluated. We focused solely on the role of ADC values in distinction of grade and subtype of RCC. Third, there were only four non-clear-cell RCCs in our study, which reflects the overall low prevalence of these subtypes. Even then, we were able to demonstrate significant difference in ADC values of clear-cell and non-clear-cell RCCs. Further studies with larger patient population are required to give more reliable results regarding the ADC value of subtypes of RCCs. A standardized protocol for DW MRI in renal lesions has not yet been established and the choice of b values also contributes to variation in the mean and range of ADC values in different studies. Though the proposed cut-off ADC values may not be exactly reproducible, nevertheless, the trends are reproducible.
In conclusion, ADC values provide an additional paradigm to predict the nuclear grade and histological subtype of RCC, and these must be interpreted in conjunction with the conventional imaging features. Cellularity and morphology of the lesion are other tumor attributes contributing to the variation in ADC values of RCCs. Depending on these determining factors, ADC values in RCC may not always be lower than that of normal renal parenchyma. Necrotic/cystic and hemorrhagic areas must be avoided for ROI placement as these may hamper useful interpretation of ADC values.