
Abstract
Background
Limited data are available regarding the use of diffusion-weighted (DW) magnetic resonance imaging (MRI) with multiple b values for characterization of renal lesions.
Purpose
To demonstrate and compare the diagnostic performance of DW-MRI with multiple b values for renal lesion characterization.
Material and Methods
Sixty-three lesions (36 malignant, 27 benign) in 60 consecutive patients (48 men, 12 women; age 60 ± 12.5 years) with solid/cystic renal lesion diagnosed after MRI were included prospectively. Single-shot echo-planar DW abdominal MRI (1.5T) was obtained using seven b values with eight apparent diffusion coefficient (ADC) maps. Contrast-to-noise ratios (CNRs), signal intensities, lesion ADCs, and lesion/normal parenchyma ADC ratios were analyzed. Receiver-operating characteristic analysis was performed.
Results
The mean signal intensities of malignant lesions (at b0, 50, and 200s/mm2) were significantly lower than those of benign lesions (P < 0.05). The mean ADC values at all b value combinations of malignant lesions were significantly lower than those of benign lesions (P < 0.000), excluding the ADC value at b50 s/mm2. ADC with all b values could better distinguish between benign and malignant lesions. A 1.35 × 10⁻³ mm2/s threshold ADC value permitted this distinction with 85.2% sensitivity and 65.6% specificity. The lesion/normal parenchyma ADC ratio was more effective than the lesion ADC.
Conclusion
In addition to the ADC value, the signal intensity curve on DW images using multiple b values could be helpful for differentiation of malignant and benign renal lesions.
Keywords
Renal adenocarcinoma accounts for 90– 95% of all renal cancers and about 3.5% of all malignancies in adults, and it is the sixth cause of tumor-related deaths worldwide (1). Differentiation of renal lesions requiring surgical treatment from non-surgical lesions is critical. The number of small, incidentally detected renal tumors is increasing in nephron-sparing surgery developed over the last decade due to the availability of new techniques and increased use of modern imaging modalities. Complicated or multiloculated cysts require additional attention to be differentiated from cystic carcinomas (2–6).
Diffusion-weighted imaging (DWI) provides additional information in oncology patients and helps the radiologist to direct his/her attention to suspicious areas when combined with conventional magnetic resonance imaging (MRI) of abdominal and pelvic tumors. In addition, DWI improves the radiologist's confidence in image interpretation (7). Furthermore, DWI permits characterization of focal renal lesions and the prediction of stage and grade of cancer (3, 8–10). Diffusion-weighted MRI (DW-MRI) is an evolving technology that can improve tissue characterization when findings are interpreted along with those obtained by other conventional MRI sequences. DWI provides qualitative and quantitative information regarding tissue characterization without the need for gadolinium administration and a strong need for alternatives to gadolinium-enhanced sequences exists for renal lesion characterization in patients at risk for nephrogenic systemic fibrosis (NSF) (8, 11).
In DW-MRI, the use of three or more b values is recommended (11). However, limited data are available regarding the use of DWI with multiple b values for characterization of renal lesions (12). The present study was performed to determine and compare the diagnostic performance of DW-MRI using multiple b values for characterization of renal lesions, with clinical histopathologic analysis.
Material and Methods
Patients
The research protocol of the present study was approved by our institutional review board. Collection of the data was performed prospectively and reviewer's evaluations were performed retrospectively. Informed constent was obtained from all patients. During the 18-month period between March 2008 and July 2010, 63 lesions in 60 consecutive patients (48 men and 12 women; age range 16–82 years; mean ± standard deviation [SD], 60 ± 12.5 years) who were referred to MRI for possible malignant renal lesion were included in the study. None of the cases was excluded. Diagnosis were confirmed by histopathology (n = 50 lesions) or follow-up ( >2 year) examinations using ultrasonography (USG) and/or computed tomography (CT) for cortical cysts (n = 9), or by clinical evaluation with laboratory tests for pyelonephritis (n = 4).
Malignant renal lesions included renal cell carcinomas (RCCs) (n = 24), primitive neuroectodermal tumors (pNETs) (n = 1), non-Hodgkin lymphoma (NHL) (n = 2), metastases (n = 2), and malignant urothelial neoplasms (transitional cell carcinomas [TCCs]) (n = 7). Benign renal lesions included oncocytomas (n = 3), cystic nephroma (n = 1), leiomyoma (n = 1), cortical cysts (n = 9), hemorrhagic cyst (n = 1), abscess (n = 1), hydatid cysts (n = 3), focal pyelonephritis (n = 7), and tubulointerstitial pyelonephritis (n = 1). In addition, three patients exhibited two different tumor types in the same kidney: one showed a primitive neuroendocrine tumor (pNET) and TCC, another exhibited RCC and TCC, and a third with RCC and a cystic nephroma.
MRI
All MRI examinations were performed using a 1.5-T MR system (Magnetom Avanto; Siemens, Erlangen, Germany) with a 33-mT/m maximum gradient strength, 75-mT/m/ms peak slew rate using a torso phased array and body coils (12 elements selected). All patients underwent a routine abdominal MRI protocol using a 3- to 5-mm slice thickness, 0.6- to 1-mm (20%) intersection gap, and 160–190 × 256 matrix, with a sensitivity-encoding factor of 2 and bandwidth of 260 Hz/px. The routine abdominal MRI protocol included the following imaging sequences and parameters: axial, coronal T2-weighted turbo-spin echo (TSE); axial, fat-saturated (FS) T2-weighted TSE (TR/TE 1900/80 ms, FA 150°); and axial and coronal T1-weighted TSE before and after intravenous (i.v.) contrast material with fat saturation (TR/TE 1900 ms/80 ms).
DW-MRI
Before i.v. contrast material injection, axial abdominal DW images were acquired in the same plane and orientation used in the routine sequences using a free-breathing single-shot echo-planar-imaging (SSH-EPI) sequence with a parallel imaging technique. Sequence parameters were TR/TE 4200 ms/87 ms, field of view 350–400 mm, section thickness 5 mm, intersection gap 20% (1 mm), sections 24–38, matrix 132 × 192, echo train length (EPI factor) 156, and two excitations. The acquisition time was approximately 4 min; the sensitivity encoding factor was 2, and parallel imaging generalized autocalibrating partially parallel acquisition (GRAPPA) with modified sensitivity encoding (mSENSE) was performed. This sequence harboured motion-probing gradients before and after the 180° refocusing pulse. The motion-probing gradient pulses were placed in the three orthogonal axes. Spectral presaturation was used to suppress chemical shift artifacts. SSH-EPI sequences at seven different b values were used (0, 50, 200, 400, 600, 800, and 1000 s/mm2). Isotropic DW-MR images at different b values were obtained after calculating the geometric average from the three set abdominal MR images.
ADC calculation
Eight ADC maps were obtained using a commercial workstation with standard software (Leonardo console software, ver. 2.0; Siemens AG Medical Solutions, Forchheim, Germany). In addition to the automatically generated ADC maps of DW images obtained using all b values (0, 50, 200, 400, 600, 800, and 1000 s/mm2; referred to as auto ADC), seven different ADC maps created using EPIs with b = 0 s/mm2 and six different b values (i.e. 0 and 50 s/mm2, 0 and 200 s/mm2, etc.), and using EPIs with four b values (0, 600, 800, and 1000 s/mm2) were obtained (referred to as various ADC). The combined mean ADC values of the detected lesions were measured directly from these ADC maps.
Image analysis
Image analyses were performed using the Advantage Workstation 4.4 (GE Healthcare, Milwaukee, WI, USA) and were randomly evaluated by two radiologists. Observers were blinded to clinical history, MR imaging reports, surgical findings, and histopathology results. Two experienced observers (ZK and GE, with 11 and 9 years of post-training experience, respectively, in the interpretation of body MR images) reviewed the DW and T2-weighted images in consensus for defining the lesions and image number. For three lesions not properly visualized on DW images, the location was determined using pre- and post-contrast T1-weighted images. After defining the lesions, the two observers retrospectively and randomly measured the lesion autoADC levels at autoADC maps in different sessions from the lesion-defining process by at least 3 weeks to minimize recall bias.
To objectively assess image quality, the contrast-to-noise ratio (CNR) of the lesions was calculated using the ratio: SIlesion − SI normal parenchyma/SDair, where SIlesion is the signal intensity of the detected lesion, SInormal parenchyma is measured at the contralateral (usually) renal cortex and SDair is the standard deviation (SD) of the background noise. The SIlesion and SDair values were measured by placing manually-defined regions of interest (ROIs) in the lesions and elliptical ROIs in air, respectively, on the DW images for each b value. For homogeneous and solid lesions, ROIs were drawn as large as possible to fit the lesion size. An average of three measurements per lesion was performed. For heterogeneous and necrotic lesions, measurements of the signal intensities and ADC values for focal lesions were performed by drawing so that they eccentrically covered the visualized low-ADC area and hyperintense area at high b values (b = 800 or b = 1000 s/mm2). Care was taken to avoid sampling necrotic, hemorrhagic, calcified, and cystic areas, as well as to avoid interference from the surrounding normal tissue. Each ROI was copied to ensure they were of the same size and location as on DW images obtained using different b values in the same lesion. For comparison of subgroups between the necrotic portion of tumors and cysts, only the cystic/necrotic components were used. If a lesion was completely cystic, the entire lesion was included in the ROI. If a cystic lesion had a solid compenent, only the solid portion of the lesion was included.
Measurement of ADC
The lesions were analyzed quantitatively for assessment of benignity/malignity by measuring ADC values. The ADC values were measured by placing manually-defined ROIs in the lesions on the nine ADC maps. The ROI was carefully placed and copied and pasted as described above for measuring the signal intensities. The ROI size varied according to lesion size and, depending on the lesion size, they were outlined on up to three sections in each mass. The ADC values of lesions are reported as the means ± SD. For intra-observer variability, ADC measurements were performed in all cases by consensus reading in different sessions, separated from the first evaluations by at least 3 weeks to minimize recall bias. In addition, the signal intensity and ADC values of the normal renal cortex were measured in three locations in each kidney on the contralateral sides (mostly) using ROIs 2.25 cm2 in diameter. The average diameter of the characterized lesions was 45.56 mm (range 11.2–140.8 mm; median 34.3 mm). The mean ROI size was 614.79 mm2 (range 12.3–8156 mm2; median 241.5 mm2). Background noise was measured at the same level as the lesion (mean ROI, 1 cm2).
Statistical analyses
Statistical analyses were performed using SPSS software (version 11.0 for Windows; SPSS Inc., Chicago, IL, USA). The normal distribution of the parameters was assessed using the Kolmogorov-Smirnov test. Wilcoxon's signed ranked test was used for comparison of CNRs of the DWIs and ADC values obtained from the different b values. Comparisons between groups were performed using the Mann-Whitney and Kruskal-Wallis tests. In all analyses, P < 0.05 was taken to indicate statistical significance. Subsequent pairwise comparisons of groups were performed using the Mann-Whitney test and the Bonferroni correction was applied. Receiver-operating characteristic (ROC) analysis was used to evaluate the diagnostic performance of the quantitative ADC values for differentiating between benign and malignant lesions, and corresponding sensitivities, specificities, and accuracies were calculated. The difference between the averaged areas under the curve (AUC) values was estimated for each sequence using jackknife dispersion and analysis of variance methods. Intra-observer variability between the measurements of ADC with all b values obtained in different sessions was assessed with Spearman's correlation coefficent.
Results
Contrast-to-noise ratio (CNR)
The CNR of malignant lesions on DWIs at b = 0, 50, and 200 s/mm2 was significantly lower than those of benign lesions (P < 0.05). Conversely, the CNR of malignant lesions on DWIs at b = 800 and 1000 s/mm2 were higher significiantly than those of benign lesions (P < 0.05; Fig. 1).
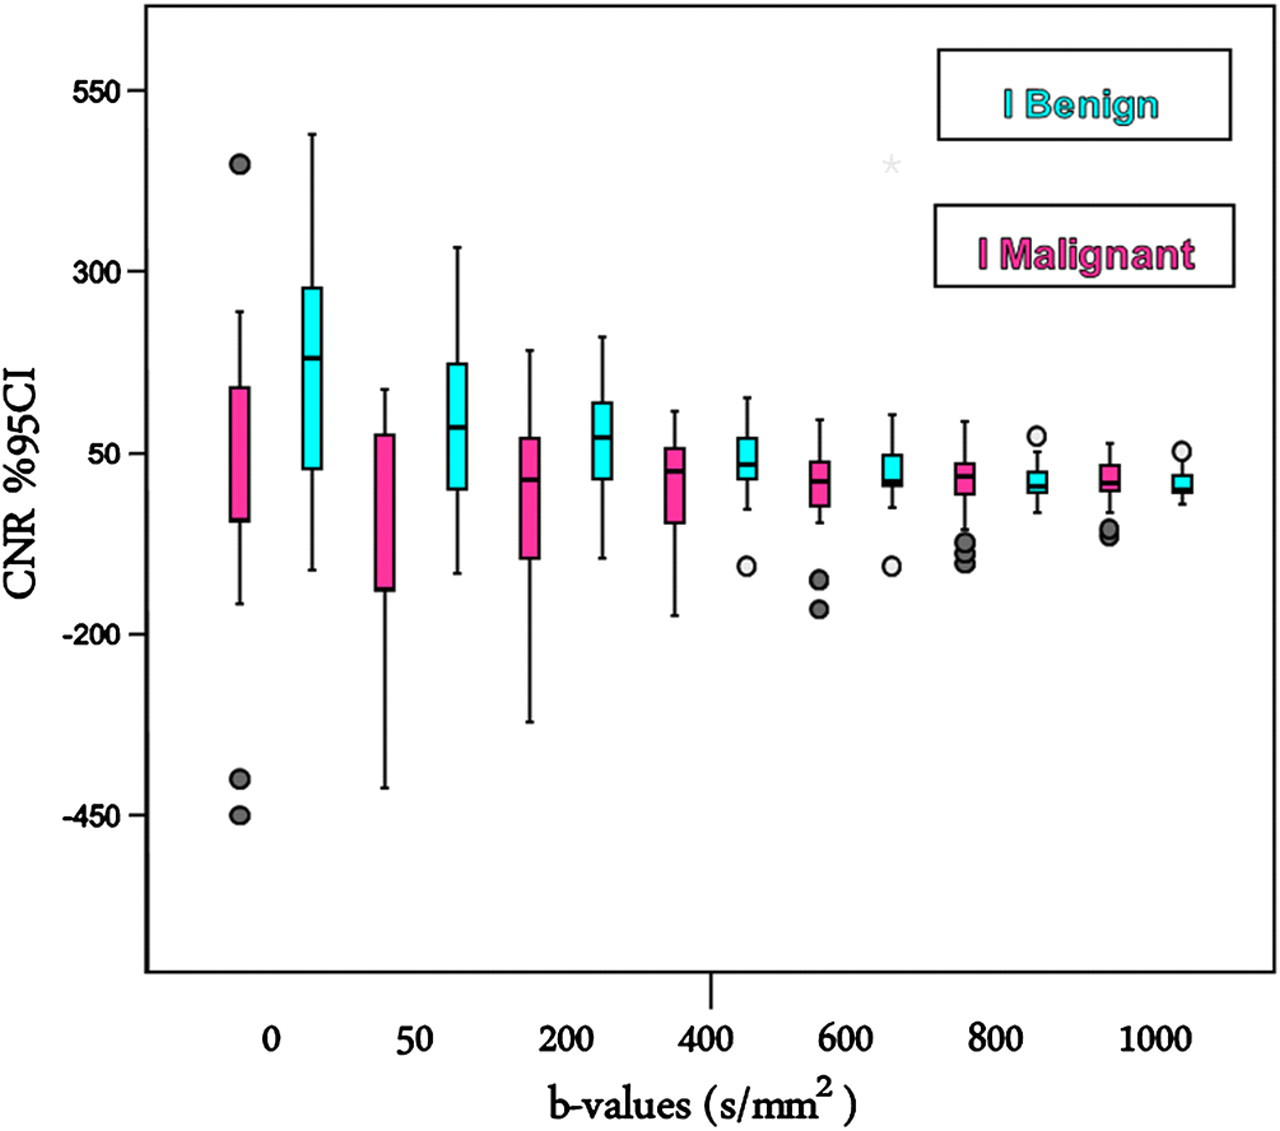
Box plots of contrast-to-noise ratio (CNR) values of malignant and benign renal lesions. Boxes stretch across the interquartile range (IR); the median is indicated as a line across each bar
Comparison of the signal intensity and ADC levels between lesions and normal parenchyma
The signal intensities of benign lesions were significantly higher than normal renal parenchyma on DW images at b values of 0, 50, 200, 400, and 600s/mm2 (P < 0.05).
There were no significant differences between the signal intensities of benign lesions and normal renal parenchyma on DWIs at b values of 800 and 1000 s/mm2. Significant differences were observed between the signal intensities of malignant lesions and their normal parenchyma on DWIs at all b values except b = 0 and b = 50 s/mm2 (P < 0.05).
The ADC values of malignant lesions were significantly lower than their normal renal parenchyma for all b value combinations (P < 0.05), the ADC values of benign lesions were significantly higher than their normal renal parenchyma only for the b value combination of auto ADC values (P < 0.05).
Differentiation between malignant and benign lesions
The mean signal intensities of malignant lesions at b values of 0, 50, and 200 s/mm2 were significantly lower than those of benign lesions. In contrast, the mean signal intensities of malignant lesions were higher than those of benign lesions for b = 800 and 1000 s/mm2 (P < 0.05) (Fig. 2).
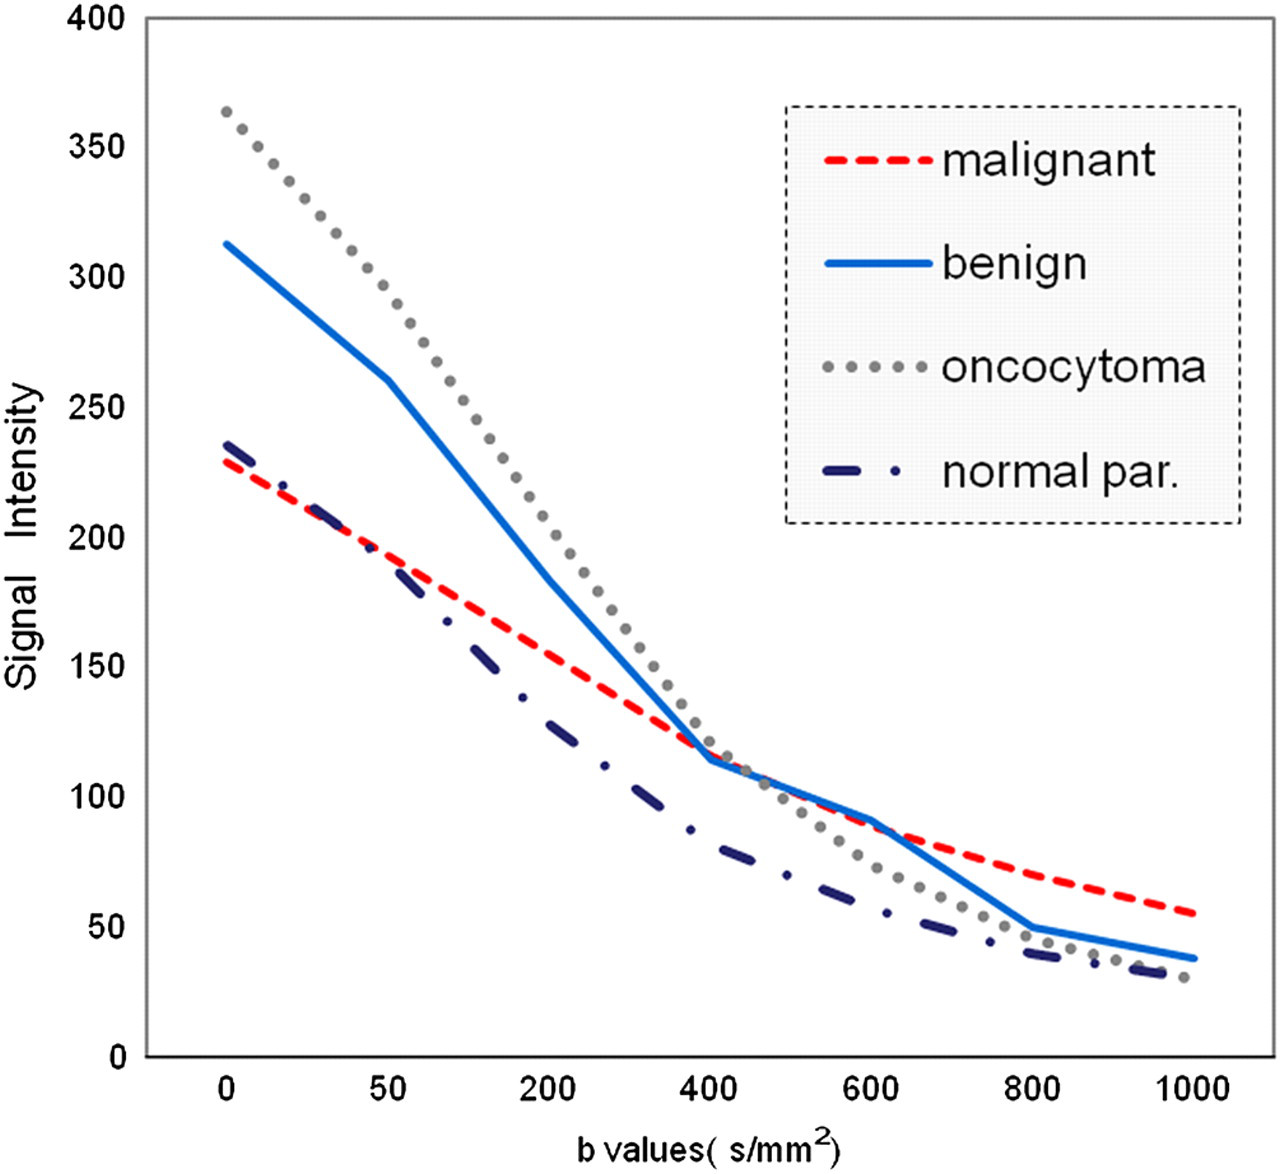
Mean signal intensity curves of normal renal parenchyma, oncocytoma, and benign and malignant lesions at different b values
The ADC values of benign and malignant renal lesions on DW images at different b values are summarized in Table 1 and Fig. 3a and b. The mean ADC values of malignant lesions were inversely correlated with b values. The mean ADC values at all b value combinations of malignant lesions were significantly lower than those of benign lesions (P < 0.000) except at b = 0 and 50 s/mm2 (Table 1). Significant differences were not found between the mean ADC values of RCC and focal pyelonephritis. In one case renal leiomyoma was found hyperintense on DWI for all b values compared with the normal parenchyma, and showed low ADC values compared with the normal parenchyma. Intra-observer variability for the measurements of ADC values were great correlation (r = 0.93 and P = 0.0001).
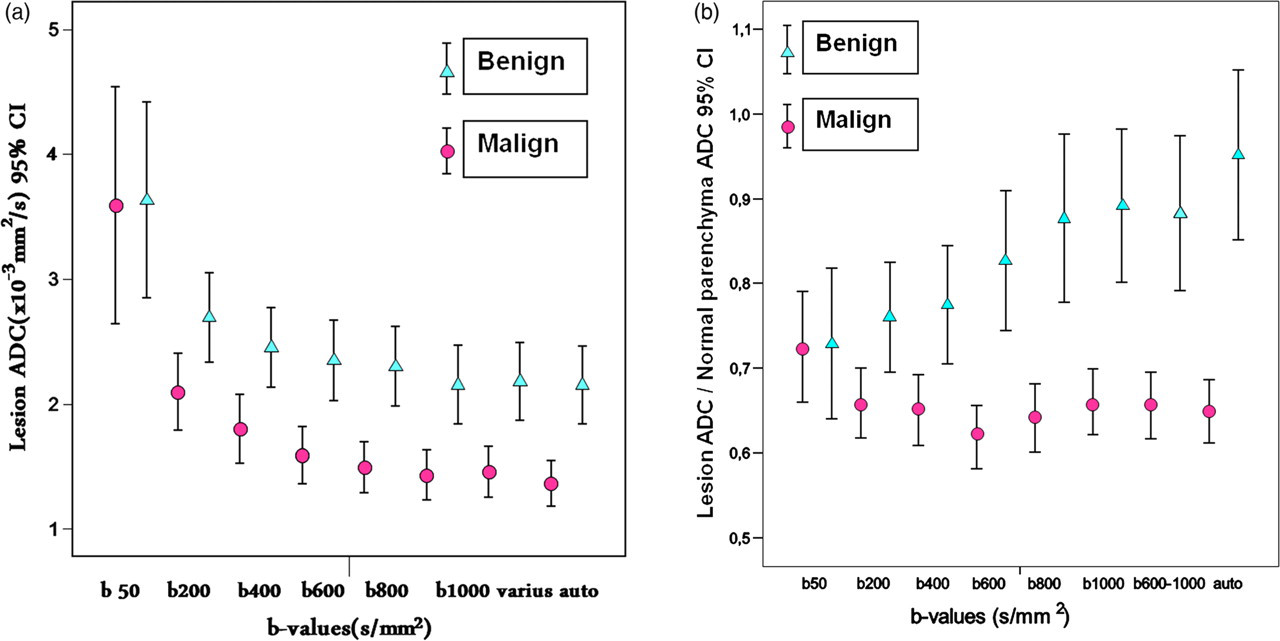
Distribution of lesion apparent diffusion coefficient (ADC) values (a) and lesion ADC/normal parenchyma ADC ratios (b) of benign and malignant renal lesions according to b value. Error bars show the 95% confidence intervals (CIs) of the mean ± standard deviation (SD) of lesion ADC values or ADC ratios. (*) Auto = ADC generated automatically using all b values (0, 50, 200, 400, 600, 800, and 1000 s/mm2). Various = ADC calculated using b values of 0, 600, 800, and 1000 s/mm2
Comparisons of ADC values (×10−3 mm2/s) of malignant and benign renal lesions among different b value combinations
Various = b0, 600, 800, and 1000, Auto = b0, 50, 200, 400, 600, 800, and 1000, NS = Not significiant
ADC (×10−3 mm2/sec)
Mean ± standard deviation (median)
P values were significant <0.05
Comparing different groups
There were no significant differences between the signal intensities of RCC lesions and focal pyelonephritis on DW images at any b value. No significant differences were found between ADC values of RCC lesions and focal pyelonephritis at any b value combination (P > 0.05) (Figs. 4 and 5). Although the mean ADC values of RCC lesions were lower than those of oncocytomas at all b value combinations except b = 0 and 50 s/mm2 and b = 0 and 200 s/mm2, the number of cases were not sufficient for statistical evaluation. The mean signal intensities of RCCs were lower than those of oncocytomas on DW images with b = 0 and 50 s/mm2.
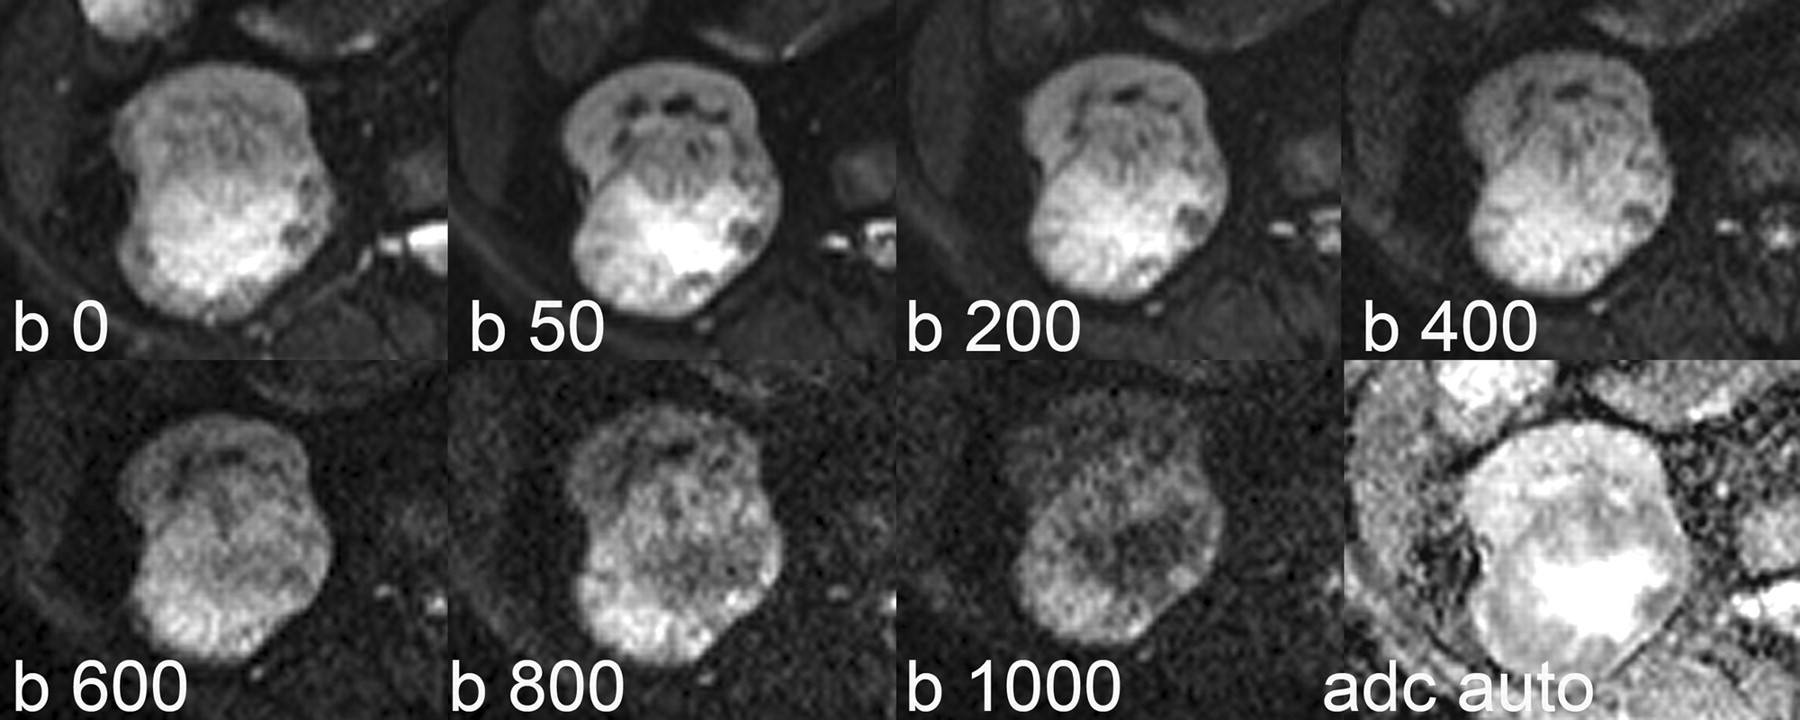
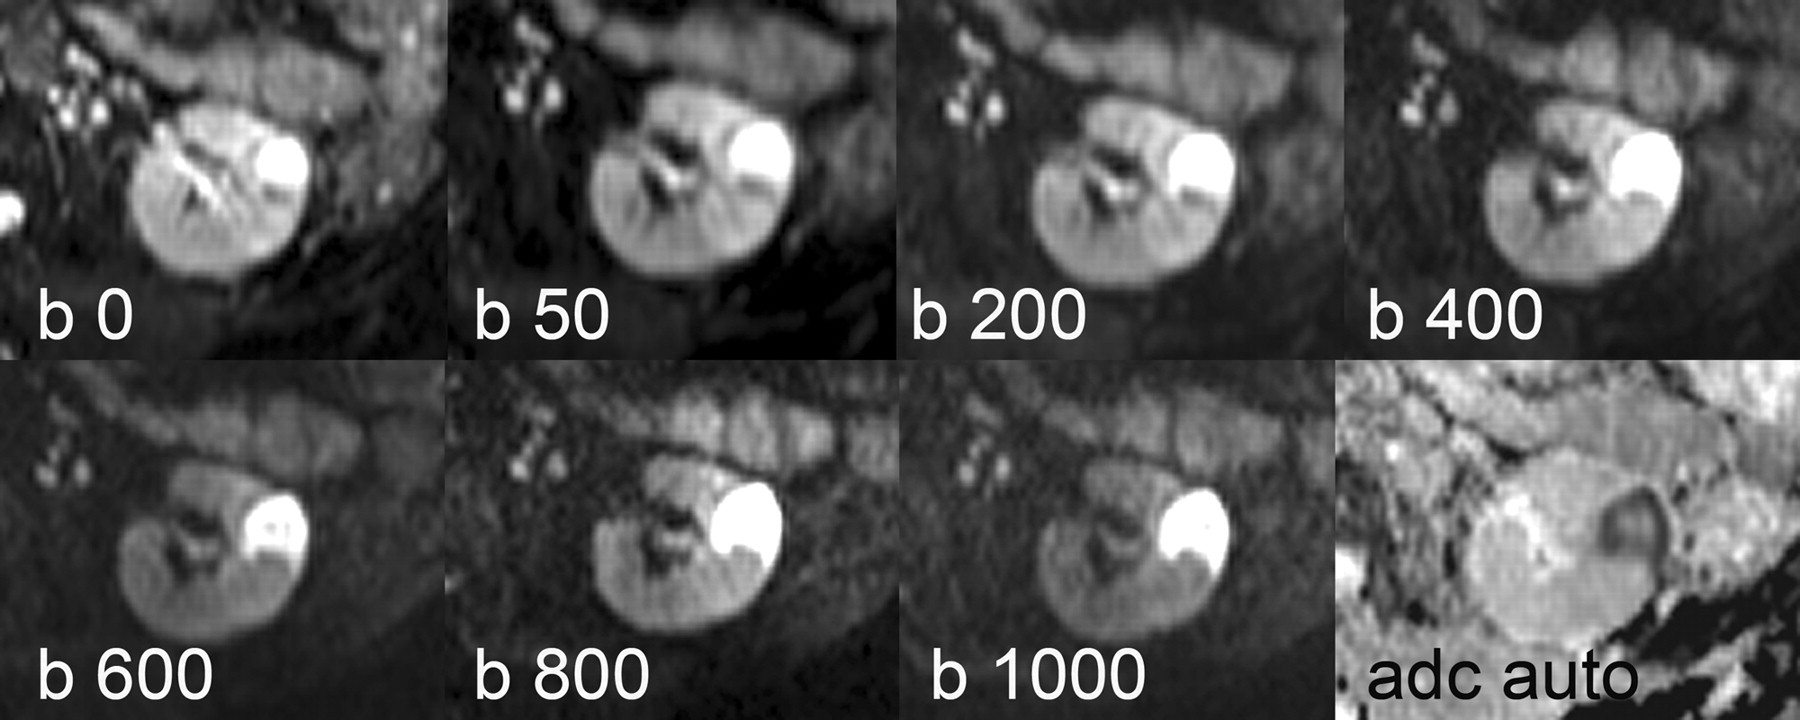
A 75-year-old woman with renal cell carcinoma (clear cell, grade 2) in the right kidney. Signal intensity changes of the lesion were observed on DW images at different b values (0, 50, 200, 400, 600, 800, and 1000 s/mm2) and auto ADC. The lesion showed low signal intensity compared with the normal renal parenchyma on DW images with low b values. In contrast, the lesion showed a high signal intensity at higher b values on DW images
A 64-year-old woman with an abscess in the left kidney. Signal intensity changes of the lesion were observed on DWI with different b values (0, 50, 200, 400, 600, 800, and 1000 s/mm2). Signal intensity of the renal abscess was higher than that of the normal parenchyma on DW images at all b values. The lesion showed peripheral restricted diffusion with high signal intensity on DW images and a low ADC value; this lesion was evaluated as a malignant mass (false-positive case)
ROC analysis and cut-off levels
The results of ROC analysis for comparison of ADCs of benign and malignant lesions are shown in Table 2. ADC values calculated at different b values were highly predictive for distinguishing between benign and malignant lesions, with areas under the ROC curves (AUCs) greater than 0.8. In comparison with ADCs obtained at different b value combinations, the auto ADC (AUC = 0.834) could better distinguish between benign and malignant lesions. The AUC for the ADCs with b values of 0 and 800s/mm2 and with b values of 0 and 1000 s/mm2 were 0.822 and 0.808, respectively (Table 2). A threshold value of 1.35 × 10⁻³ mm2/s permitted this distinction with a sensitivity of 85.2% and specificity of 65.6% at autoADC. Using normal parenchyma ADC values as phantom markers, the lesion/normal parenchyma autoADC ratio (AUC = 0.855) was more effective than the lesion autoADC (AUC = 0.811) for differentiation of benign and malignant lesions (Table 2).
ROC analysis of the ADC values in differentiation of the benign and malignant lesions for each b value combination
*ADC with b0, 600, 800 and 1000
†ADC with b0, 50, 200, 400, 600, 800 and 1000
AUC = area under the curve
Discussion
The results of the present study indicate that DW-MRI with multiple b values are better than DW-MRI with single b values for differentiation between benign and malignant renal lesions with accurate ADC measurements including only the viable solid components of lesions. The use of multiple b values is very useful to evaluate the nature of lesions from the signal intensity of DW images and ADC values. Generally, malignant renal lesions show isointense/low signal intensity compared with normal parenchyma at low b values. The hemorrhagic cysts were relatively hypointense or hyperintense compared with normal renal parenchyma on DWI with all b values. Abscesses were hyperintense on DWIs at all b values and low ADC values (Fig. 5). The signal intensity curves raised a new criterion for detection of malignancies on DWI. If a renal lesion was isointense/hypointense compared with the normal parenchyma at lower b values and hyperintense at higher b values, with lower ADC values together, the lesion should be considered to be malignant (Fig. 4). The overlapping of ADC values between benign and malignant lesions was minimal at ADC values with higher b values and lower standard deviation. The lesion/normal parenchyma ADC ratio showed a lesser degree of overlap between the malignant and benign lesions than the lesion ADC. This ratio may be most predictable and easily obtained. Differentiation between leiomyoma and RCC was not possible based on the signal intensity of DWI and ADC values in our case. Similiar misleading findings is known for uterine leiomyomas in DW imaging (13). There is no reported case in English literature about DWI of renal leiomyomas.
Several previous studies investigated the use of DWI in normal kidneys for assessment of diffuse renal disease, renal artery stenosis, renal infection, urinary obstruction, and renal transplants (8). DWI provides qualitative and quantitative information regarding tissue characteristics without the need for gadolinium administration. Indeed, alternatives to gadolinium-enhanced sequences are required for renal lesion characterization. Proper analysis of these data types requires multiexponential models where signal decays are modelled as weighted sums of two or more exponentials or alternative models, such as stretched exponentials that allow distribution of diffusion coefficients in each voxel. As with other curve-fitting methodologies, reliability to accurately isolate multiple decay coefficients depends on the difference between the true fast ADC and slow ADC values, signal-to-noise ratio (SNR), b value range, and number of b values acquired. Rejection of low-SNR pixels and/or incorporation of SNR weights in the multiexponential fitting routine should be used to mitigate fitting errors (11). The signal intensity of the benign and malignant lesion are crossed around the b 400 s/mm2 level as seen in Fig. 2. This is true also for CNR, because of its relation to the signal intensity (14). Despite these values, significant differences between ADC with b values of 0, 400 and b0, 600 are related to the ADC calculation formula.
Lower b values will generate higher ADC values due to the contribution of intravoxel incoherent motion effects other than diffusion (e.g. perfusion or flow phenomena). To reduce the effects of intravoxel incoherent motion, maximum b values of 800 s/mm2 or greater are suggested whenever possible. A higher b value provides higher diffusion weighting, free from perfusion and flow contamination. In addition, the use of three or more b values provides a more precise ADC fit (2).
The thick, adhesive fluid in the collecting system of the pyonephrotic kidneys has a very high viscosity and cellularity, thus providing a very low ADC and explaining its hyperintensity on DW images and hypointensity on ADC maps, indicating restricted diffusion. MR diffusion imaging showed a very clear cut-off between the ADC values of the renal pelvis in infected and non-infected cases, thus confirming the efficacy of the technique for this differential diagnosis (15).
Zhang et al. (16) reported the use of DW imaging for evaluation of renal masses. In their study, the ADC measurement method involved first placing larger ROIs that fit the entire regions and then segmenting the lesions into necrotic-cystic and solid components on the basis of contrast-enhanced MR imaging findings. The findings of Zhang et al., with the added observation of lower ADCs in the cystic-necrotic portion of the neoplasm compared with ADCs in the simple cyst, on those reported previously. In contrast to Zhang et al. (16), Taouli et al. (17) measured the ADC in the entire lesion as well as in the cystic and solid portions of cystic RCCs; no marked differences were found between the benign cyst and cystic portion of RCCs. In our study ADC with b0, 600, 800, 1000 s/mm2 levels for malignant lesions (1.38 −/+ 0.29 vs. 1.41 −/+ 0.61) and benign lesions (2.26 −/+ 0.28 vs. 2.23 −/+ 0.87) were in concordance with Taouli's studies (17).
The performance of DW imaging was reported to be equivalent to that of the enhancement ratio in the diagnosis of non-fat-containing T1 hyperintense renal lesions; however, it was less sensitive than image subtraction (18). In DW-MRI, parallel imaging, short echo time, and tetrahedral encoding were recommended for optimizing the SNR. In addition, respiratory triggering and antiperistaltic agents were recommended to reduce artifacts (11). The disadvantages of breath-hold imaging include poorer signal-to-noise ratio (SNR), greater sensitivity to distortion and ghosting artifacts, lower spatial resolution (with greater section thickness of 8–10 mm), and a limitation on the number of b values that can be included in the measurement. By comparison, free-breathing, multiple signal acquisition, single-shot spin echo EPI is a versatile technique that can be implemented reasonably well across different vendor MR platforms. Free-breathing DW-MRI may be combined with respiratory triggering, either through navigator or bellows control. When successfully implemented, such techniques result in high-quality images with good anatomical details (19).
DWI has shown promising results for the assessment of focal and diffuse renal disease as well as urinary bladder cancer, with multiple potential applications. The advantages of DWI include the ability to characterise focal renal lesions and the prediction of stage and grade of cancer. However, additional supporting data comparing DWI with contrast-enhanced imaging and pathology are required. The limitation of DWI is the lack of sensitivity and specificity of ADC measurement for the diagnosis of neoplasms because the ADC can be decreased in renal abscesses and falsely elevated in cystic RCCs (8).
Doganay et al. showed that DW-MRI with quantitative ADC measurements can be useful in differentation between benign and malignant renal lesions. High b values (600 and 1000 s/mm2) had the best specificity and sensivity when AML (angiomyolipoma) were excluded (12).
There were some limitations in the present study: the number of benign lesions was small; and artifacts affecting image evaluation, such as respiratory motion artifacts and chemical shift artifacts at low ADC values. The limitation of DW images was lower spatial resolution that resulted in one false-positive case. Due to the limited spatial resolution, the small solid component of cystic RCC was not observed at higher b values. However, at low b values, this solid component was observed at a lower signal intensity compared with the normal parenchyma (Fig. 4). Histopatological analyses were not performed for some benign lesions.
In conclusion, in addition to the ADC value, the signal intensity curve on DW images obtained with multiple b values could be helpful for differentiation between malignant and benign renal lesions. The lesion/normal parenchyma ADC ratio was more effective than those of lesion ADC for differentiation of benign and malignant lesions.