
Abstract
Background
Previous literature demonstrated that the T2* value of the uterine junctional zone was lower than that of peripheral myometrium by using BOLD MR imaging. We expect T2* mapping image may add more information to T2-weighted images of the uterine myometrium.
Purpose
To evaluate whether T2* mapping software would reproduce the result of previous report, and to apply the software to benign uterine diseases.
Material and Methods
Five healthy volunteers and 19 patients clinically suspected of having benign pelvic disease were imaged using a 1.5T MR system. All women were of reproductive age, and all provided informed consent. Sagittal T2* images using a multishot EPI sequence were obtained. T2* values were calculated and color T2* maps reconstructed using a T2* fitting tool.
Results
The uterine zones could be identified in all 24 examinations on the T2* maps. In addition, a thin “4th zone” was seen between the endometrium and the JZ (junctional zone) in 19 of 24 examinations. The T2* value of JZ was significantly lower than that of peripheral myometrium (PM) (P < 0.001). No significant difference in the T2* value of the JZ or of PM was noted between normal uterus and uterus with leiomyomas and/or adenomyosis.
Conclusion
A quantitative T2* map can easily be obtained using the PRIDE software T2* fitting tool, and the software reproduces the result from previous report. T2* value of the junctional zone was lower than that of peripheral myometrium regardless of having benign myometrial diseases.
Uterine myometrium is known to have two different zones on T2-weighted images. The innermost myometrium appears as a band of lower signal intensity (junctional zone), and the peripheral myometrium has higher signal intensity than that of the junctional zone. Little is known about the “mysterious” junctional zone from a structural perspective. Studies have shown morphological differences between the junctional zone and peripheral myometrium; decreased water content and lower T1 and T2 values in the junctional zone (1); a three-fold increase in the percentage of nuclear area in the junctional zone (2); and compact smooth muscle fibers with decreased extracellular space (3). MR imaging depicts the junctional zone even in hysterectomy specimens (1–4), and it is visualized in routine and cine MR imaging after anticholinergic agent injection to suppress uterine peristalsis (5).
Kido et al. recently reported that the T2* value of the junctional zone was lower than that of peripheral myometrium using BOLD MR imaging (6). They considered the low T2* value of the junctional zone was caused by decreased blood perfusion and then subsequently decreased pO2. The result might be one of the important functional characteristics of the junctional zone; however, the role of the junctional zone is not completely understood. Now, the recent development of the software has enabled the production of quantitative MR imaging with T2* relaxometry maps (7). We expect T2* mapping image may add more information to T2-weighted images of the uterine myometrium. Therefore, the purpose of this study was to evaluate whether T2* mapping software would reproduce the result of the previous report, and to apply the software in the evaluation of benign uterine diseases.
Material and Methods
Study population
Five healthy volunteers and 19 patients clinically suspected of having benign pelvic disease were included in this study. All women were of reproductive or premenopausal age (range 20–49 years, mean 35.4 years). Their menstrual phase was not accurately recorded at the time of MR examination. Our ethical committee approved this study, and informed consent was obtained from all women. The patient studies were included in the routine MR pelvic examinations.
Imaging techniques
All MR examinations were performed on a 1.5T unit (Intera Master, Philips Medial Systems, Best, the Netherlands). Sagittal and axial fast spin echo (FSE) T2-weighted images were obtained (TR/TE 4100/85, echo train length of 15) using a SENSE body coil. Next, to calculate the T2* value, five sagittal slices of the uterus were obtained using multishot fast field echo (FFE) imaging with a QD body coil. TR (time to repeat) was 640 msec. The first TE (time to echo) was acquired at 2.3 msec, and following 66 echoes were acquired with an increment of ΔTE = 2.3 msec. Thus, 67 echoes were totally obtained from 2.3–154.1 msec to calculate T2* value. The other imaging parameters were as follows: flip angle 28 degrees; matrix 128 × 128; slice thickness 5 mm with no slice gap; and FOV 28 cm. Images were obtained under free breathing. Of these five sagittal images, one midsagittal image of the uterine body was selected for analysis of T2* value. No anticholinergic agent was used during examination.
Image analysis
The T2* values and T2* maps were calculated using a T2* fitting tool (PRIDE: Philips Research Integrated Development Environment, Philips Medical Systems, Best, the Netherlands). The algorithms were written in Interactive Data Language (IDL), which had been applied to quantitative T2* relaxometry of the liver (7). The T2* fitting tool corrected a main field inhomogeneity and the corrected T2* maps showed reduced influence of the local field variation (7). First, two radiologists (19 and 3 years of experience, respectively, in diagnosing pelvic MR imaging) independently recorded whether each uterine zone (i.e. endometrium, junctional zone, or peripheral myometrium) could be recognized on the T2* map. Disagreement in interpretation was resolved by consensus. Next, in cases where the uterine zones were recognized on the map, one radiologist drew an ROI over the junctional zone, peripheral myometrium, and back muscle to calculate T2* value. When uterine leiomyomas and/or adenomyosis were diagnosed on the T2-weighted images using previously described criteria (8, 9), the ROI was also imposed over the disease. Most of the ROIs included around 50 pixels (range 48–56 pixels). Statistical analysis was performed using Wilcoxon's signed-rank test to compare the T2*values of each anatomical structure. Mann-Whitney U-test was performed to determine whether the T2*values of the junctional zone and/or peripheral myometrium differed between normal uterus and uterus with leiomyoma and/or adenomyosis.
Results
The uterine zones were able to be identified in all 24 examinations on both FSE T2-weighted images and the T2* maps. On the color maps, the red scale indicated relatively lower T2*values than the green scale, and the blue scale was the highest. The map typically demonstrated endometrium as blue, the junctional zone as red, and peripheral myometrium as green (Fig. 1). In addition, a thin green layer was seen between the endometrium and the junctional zone (we named this layer the 4th zone following endometrium, junctional zone, and peripheral myometrium) in 19 of the 24 examinations. In the other five examinations the endometrium was very thin, and we were unable to discriminate the 4th zone from the endometrium.

A 28-year-old woman with normal uterus. (a) Sagittal T2-weighted image (TR/TE 4100/85) shows normal uterine anatomy including endometrium (arrowhead), junctional zone (arrow), and peripheral myometrium. (b) Corresponding color-scaled T2* map demonstrate endometrium as blue, the junctional zone as red, and peripheral myometrium as green. A thin green 4th zone is evident between the endometrium and the junctional zone (arrows) on both maps
The mean T2* values of the junctional zone, peripheral myometrium, and back muscle are summarized in Table 1. The T2* value of the junctional zone was significantly lower than that of peripheral myometrium (44.5 vs. 61.9, respectively; P < 0.001). Back muscle had a lower T2* value than the junctional zone (29.5 vs. 44.5, respectively; P < 0.001).
T2* value of anatomical structures and benign uterine diseases
JZ vs. PM, JZ vs. BM, PM vs. BM: P < 0.001
Leiomyoma vs. JZ: P = 0.008
Leiomyoma vs. PM: P = 0.003
Leiomyoma vs. BM: P = 0.006
SD = standard deviation
Eleven patients were diagnosed with leiomyomas and four were diagnosed with adenomyosis on the basis of FSE T2-weighted images. Of these, two patients had both leiomyomas and adenomyosis. No significant difference in the T2* value of the junctional zone or of peripheral myometrium was noted between normal uterus and uterus with leiomyomas and/or adenomyosis (Table 2). The leiomyomas had a lower T2* value than both normal myometrium and the junctional zone (Fig. 2, Table 1). Adenomyosis tended toward a higher T2* value than both the junctional zone and the leiomyomas (Fig. 2, Table 1); however, the differences were not statistically significant due to the small number of adenomyosis cases (n = 4).
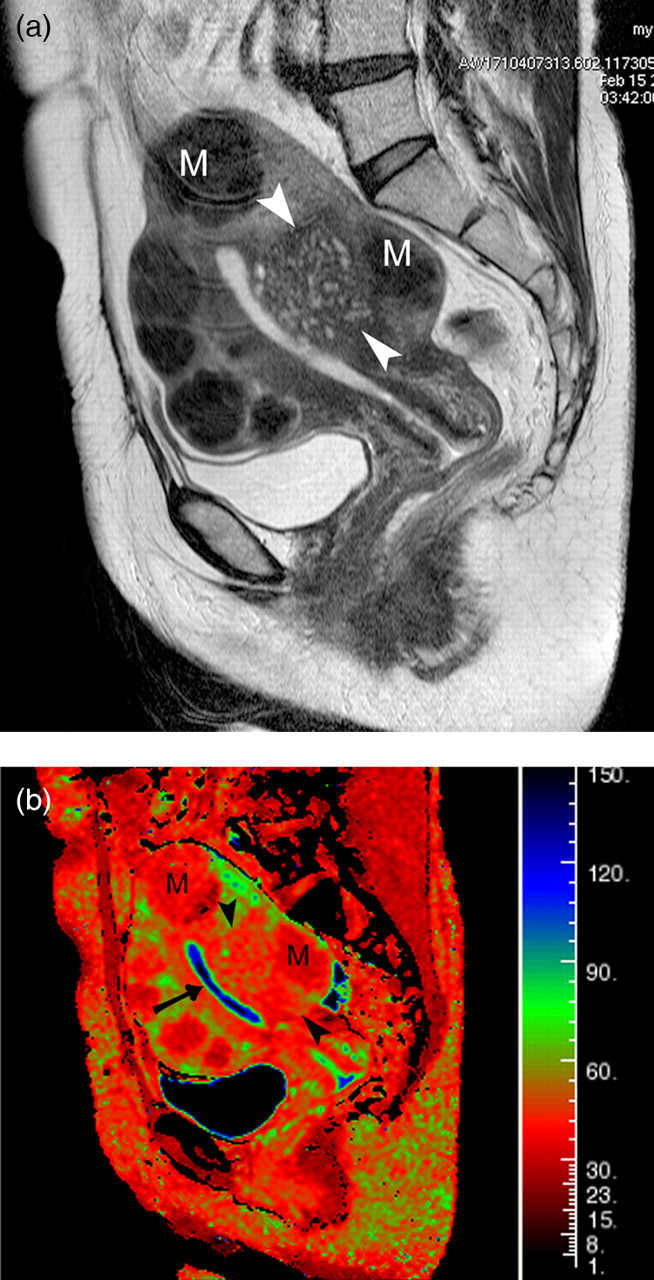
A 49-year-old woman with adenomyosis and multiple leiomyomas. (a) Sagittal T2-weighted image (TR/TE 4100/85) shows adenomyosis in the posterior myometrium (arrowheads). The lesion is seen as an ill-defined hypointense mass with multiple hyperintense foci. In addition, multiple leiomyomas are seen as well-demarcated hypointense masses (M). Corresponding color-scaled T2* maps (b) demonstrate adenomyosis as red with green foci (arrowheads) and leiomyomas as a red mass (M). Note that the normal junctional zone is seen as red in the anterior myometrium, and peripheral myometrium as green. A thin green 4th zone is evident between the endometrium and the junctional zone (arrows) on both maps
T2* value of anatomical structures of normal uterus and uterus with benign diseases
SD = standard deviation
Discussion
In women of reproductive age, uterine zonal anatomy is clearly visible on T2-weighted images. The zonal anatomy usually includes the endometrium (high signal intensity), the junctional zone (low signal intensity), and the peripheral myometrium (intermediate signal intensity). The junctional zone has been investigated since it was described by Hricak et al. in 1983 (10). It is the innermost layer of the uterine myometrium and consists of smooth muscle fibers. As Brosens et al. stated, the junctional zone is not only structurally but also functionally different from peripheral myometrium (11). Kido et al. reported the T2* value of uterine myometrium, the junctional zone, and peripheral myometrium using BOLD MR imaging and their changes during the menstrual cycle (6). They reported T2*values for the junctional zone/peripheral myometrium of 44.1/57.0, 51.2/77.5, and 58.1/83.0 in the menstrual phase, periovulatory phase, and luteal phase, respectively. The T2* values of the junctional zone were significantly lower than those of peripheral myometrium at every phase. Although they used seven different TEs from 23 to 150 msec, the result of the present study with 67 different TEs from 2.3 to 154.3 msec parallel those. Both results indicate that the junctional zone is more sensitive to T2* relaxation than the peripheral myometrium is. As a result, T2* mapping software reproduced the result of the previous report. In our study, the presence of benign myometrial diseases did not influence the T2* value of the junctional zone or of peripheral myometrium.
Kido et al. considered that the low T2* value of the junctional zone was caused by BOLD effect, which was induced by decreased blood perfusion and pO2. (6). According to the cine MR imaging, transient alterations in the uterine zonal appearance have been demonstrated (12, 13). Cine MR imaging displays uterine peristalsis, including wave conduction, within the junctional zone (13). Hence, the consideration was the following; blood squeezing out from the contracted area reduced the blood perfusion, thereby resulting in transient decreases in signal intensity on T2-weighted images (13), and T2*-weighted images (6). We, however, have another hypothesis introducing that the contraction or movement of striated muscle directly causes T2* decay of the junctional zone, and hence less BOLD effect. This may be because on the basis of histological findings, a profuse capillary and venous networks of the endometrium are revealed to drain into the inner myometrium (14). Specifically, the main veins originate under the epithelial surface and run straight to the basal layer where they converge to form a collecting vein in the inner part of the myometrium. In addition, the inner layer of the uterine wall contains more muscle fibers than the outer layer (15). In short, a profuse network of capillaries and veins is present around the smooth muscle fibers in the inner third of the myometrium (14). Therefore, we assume, as same as striated muscle contraction, the wavy conduction of the junctional zone (inner layer of the uterine myometrium) should play an important role in the venous transfer mechanism of the uterus. If venous blood squeezes out from the area, the localized pO2 would be increased and results in no BOLD effect. Interestingly, a postmenopausal uterus has a less prominent venous network in both the endometrium and myometrium (14), which may explain why the junctional zone is unclear in MR images of postmenopausal uterus.
In our study, the T2* color map showed another zone between the endometrium and the junctional zone (4th zone) in 79% of examinations. Although the 4th zone was too thin to calculate a T2* value, the color scale indicated that the T2* value of the 4th zone was lower than that of endometrium and higher than that of the junctional zone. The origin of the 4th zone is unclear. One might expect that the zone is an artifact caused by partial volume effect, and our observation seems to support this observation, as (a) an examination with unclear 4th zone appeared to have been obtained during the menstrual phase because the endometrium was thin and contained a clot (Fig. 3) (16, 17); and (b) five examinations of unclear 4th zone had thin endometrium. The presence of adenomyosis, however, did not obscure the 4th zone and a clear delineated line between the endometrium and the junctional zone could be seen in cases of adenomyosis (Fig. 2). Therefore, the 4th zone may be real rather than an artifact, and may have a close relationship to the endometrium. We have already recognized subendometrial enhancement (SEE) as a thin layer between the endometrium and myometrium, which could be seen in the early phase of dynamic enhanced studies on both 1.5T and 3T units (18, 19). Further studies are required to determine the relationship between SEE and the 4th zone. Yamashita et al. reported that SEE was not always visible, especially in the secretory or menstrual phase of reproductive-age women (18). They speculated that SEE corresponds to a vascularized subendometrial area and may be associated in some way with hormonal status (18). Because the 4th zone showed lower T2* value than that of endometrium, vascularized subendometrial area may be a possible explanation.

A 20-year-old woman with normal uterus. (a) Sagittal T2-weighted image (TR/TE 4100/85) shows normal uterine anatomy including endometrium, junctional zone, and peripheral myometrium. (b) Corresponding color-scaled T2* map demonstrate the junctional zone as red and peripheral myometrium as green. The endometrium and 4th zone are unclear on the T2* map. Note that the endometrium appears thin in the T2-weighted image and a clot is evident in the endometrial cavity (arrow)
The present study has some limitations. First, our sample size was small and menstrual phase was not recorded. Further investigation regarding the influence of the menstrual cycle or menopause is required, with a larger study population. In addition, our study population did not include invasive and non-invasive endometrial carcinoma. We should investigate whether T2* map can estimate the invasion of endometrial malignancy. Second, pathologic confirmation of uterine disease was not obtained in all patients. We do not believe this is a significant limitation, as MR imaging is an accepted and accurate non-invasive method with which to diagnose leiomyomas and adenomyosis.
In conclusion, a quantitative T2* map can easily be obtained using the PRIDE software T2* fitting tool, and the software reproduces the result from a previous report. T2* value of the junctional zone was lower than that of peripheral myometrium regardless of having benign myometrial diseases. Junctional zone was more sensitive to T2* decay than peripheral myometrium was, and T2* relaxometry map might show the physiological discrimination between junctional zone and peripheral myometrium.