




Abstract
Background
Contrast-enhanced ultrasound (CEUS) has gained interest because of its ability to gather vascular information in diverse organs. There is still a subject of debate concerning its value in breast lesions, especially as a differential diagnostic tool.
Purpose
To investigate whether kinetic parameters of CEUS can differentiate between malignant and benign breast lesions.
Material and Methods
We evaluated 75 malignant and 21 benign lesions in the breast or axilla. Contrast harmonic imaging (CHI) US was performed after the injection of a bolus dose of 2.4 mL of Sono Vue® (Bracco, Milano, Italy). The following parameters were calculated for kinetic analysis: initial slope, time to peak enhancement, wash-out ratios W21 and W50 (relative decrease in signal intensity from the peak enhancement to 21 s and 50 s, respectively).
Results
A significant difference was found between the benign and malignant lesions in time-to-peak (P value <0.05) and wash-out ratios W21 (P value <0.001) and W50 (P value <0.001). The mean time-to-peak was 9.3 s for malignant and 14.6 s for benign lesions. The mean signal drop from peak to signal intensity measured at 50 s was 85% for malignant and 66% for benign lesions. There was no difference in absolute values of peak signal intensity and initial slope. The most significant difference between standardized benign and malignant wash-out curves was found at 21 s but statistical significance was reached in the range of 14–50 s.
Conclusion
Real-time CEUS can evolve into a new non-invasive option for differentiate malignant from benign breast lesions.
Breast cancer is the leading cancer among women in developed industrialized countries, both in incidence and mortality (1). Despite the rising incidence with 1% per year since 1970, the mortality in the population of women in general has been slightly decreasing over the last two decades. This fact could be explained, in spite of some controversies (2), by the effect of well-organized screening mammography programs and earlier diagnosis as well as better treatment options. Because of screening mammography and regular controls, the number of advanced cancers has decreased from 30% to 15–20% and mortality in the screening group decreased by 21–45% (3–5). Mammography is currently not only the best screening method but together with ultrasonography and biopsies remains the state-of-the-art method in evaluation of breast tumors (6).
Several other imaging methods have been introduced as valuable diagnostic tools in the examination of the breast. However, despite enthusiastic initial reports, most of these methods have so far been disappointing (7, 8) except for ultrasonography (US) and magnetic resonance imaging (MRI).
Dynamic contrast-enhanced MRI (DCE-MRI) of the breast has been used in several areas of breast cancer management, such as evaluation of the disease extension, prognosis, and follow-up of treatment (9–11). In particular, DCE-MRI allows estimation of both morphological and functional parameters related to malignancy, and the dynamics of contrast enhancement have proved to be as important as lesion morphology for characterization of breast lesions (12).
One of the main characteristics of a malignant lesion is its vascular pattern. It has been discussed in many papers that angiogenesis and vascularization have an important role when evaluating tumor development, growth, or invasion (13, 14).
The vascular assessment of a breast lesion with color and power Doppler modes still remains controversial (15, 16). The limitations of power Doppler in breast tumors regarding vessels size and flow velocity are known, especially since vessels in tumors are in the order of capillaries. There are numerous studies that have been conducted using US contrast agents (microbubbles) as a tool to overcome this limitation. Initially, sonographic contrast agents with microbubbles have been used in general to increase the vascular signal at Doppler ultrasonography, accomplished by increasing the vascular signal and improving the color and power Doppler US assessment for differentiation benign from malignant masses in different organs, included the breast (17–19). Contrast-enhanced ultrasound (CEUS) of the breast is less commonly performed than abdominal CEUS. While the first results with CEUS in the breast were disappointing, improvement in dedicated software by different ultrasound manufacturers together with more stable contrast agents allows the visualization of blood vessels at a resolution of capillary size (20). Few preliminary studies using first and second generation ultrasound contrast agents in differentiating malignant and benign breast lesions are published with contradictory results (21–24).
The aim of this study was to evaluate if the real-time harmonic CEUS imaging could be used to differentiate between benign and malignant breast tumors according to their vascular pattern.
Material and Methods
An approval of the Regional Ethics committee was obtained for this study. All patients were informed about the study and gave their oral consent.
A total of 95 patients (95 women, mean age 55 years, range 29–76 years) with 96 palpable or non-palpable findings in the breast or axilla (75 malignant lesions and 21 benign) were evaluated between March 2007 and September 2009.
The inclusion criteria were: aged 18 years or older with a definite malignant (ACR BI-RADS 5), or benign or probably benign (ACR BI-RADS 2 and 3) lesions, detected primarily either with mammography, ultrasound, or both. This simplified study design was used with the exclusion of BI-RADS 4 lesions, because the main focus was to investigate the differences in CEUS enhancement between benign and malignant lesions. It was not our goal to evaluate CEUS as an adjunct to mammography and ultrasound.
Exclusion criteria were pregnancy or lactation, known allergy to sulfur hexafluoride (contrast agent), or severe cardiopulmonary disease.
Methods/Investigation procedure
The mammography images were performed with analogue equipments (Siemens Mammomat 3000 Nova, Erlangen, Germany; Planmed Sophie, Helsinki, Finland, and GE Senographe 800T, Milwaukee, WI, USA) and full-digital equipments (Sectra MicroDose mammography, Stockholm, Sweden) using the standard three views craniocaudal (CC), mediolateral oblique (MLO), and lateromedial (LM) and some additional when needed (spot compression, magnification, or supplementary views). The fundamental ultrasonography examination in B mode was performed with a Philips iU22 (Philips Medical Systems, Eindhoven, The Netherlands) using a high resolution multifrequency linear probe L17–5 MHz and special modalities SonoCT (real-time compound imaging scanning, crossbeam scanning) and XRES (speckle, noise, and clutter reduction imaging). Scanning with power Doppler was performed in all tumors as a standard procedure, with the intention of getting an adequate and optimal detection of vascularity that then was used as the scan plane for real-time CHI (contrast harmonic imaging) ultrasound.
CEUS was performed with the real-time grey-scale CHI and fundamental imaging (images side by side) ultrasound with the same equipment (Philips iU22, software Vision 2007–2009) using a multifrequency L9-3 MHz linear probe, especially designed for this purpose.
Second generation MB (microbubbles) contrast agent (sulfur hexafluoride, Sono Vue®, Bracco, Milan, Italy) was injected through a 21G catheter via the antecubital vein.
An injection of 2.4 mL of MB was administrated manually as a bolus (2 s) followed by a flush of 10 cc saline solution. The examination was recorded from the start of the bolus and for a 120-s period.
During the contrast harmonic imaging, a low MI of 0.06 was used in all cases, as well as a scanning with minimal compression of the breast, to avoid bursting the MB.
Evaluation of images
Mammograms and ultrasound images were evaluated according to the BI-RADS classification system, which was used primarily for inclusion in the study.
The CEUS studies were saved in the ultrasound hard disc system, and then transferred to a PC for further quantitative analyses with advanced ultrasound quantification software (Q LAB 7.0™, Philips Medical Systems, Seattle, WA, USA). The computer-assisted program, with the help of a “whole tumor ROI” delineating every tumor, allowed acquisition of signal intensity (dB)/time (s) curves. In our study, kinetic curves acquired in the first 50 s after the appearance of contrast, were used for statistical analysis.
In addition, the wash-in and wash-out patterns of the contrast agent were evaluated by quantitative assessment of the kinetic data.
Those prospective image analyses were performed by two experienced radiologists (AS, BS).
Analysis of signal intensity time curves
Initial slope, peak signal intensity, time-to-peak, and wash-out ratio values were calculated from the raw data of time–signal intensity curves, in all 96 cases.
Initial slope defines the upslope of the kinetic curve to peak signal intensity
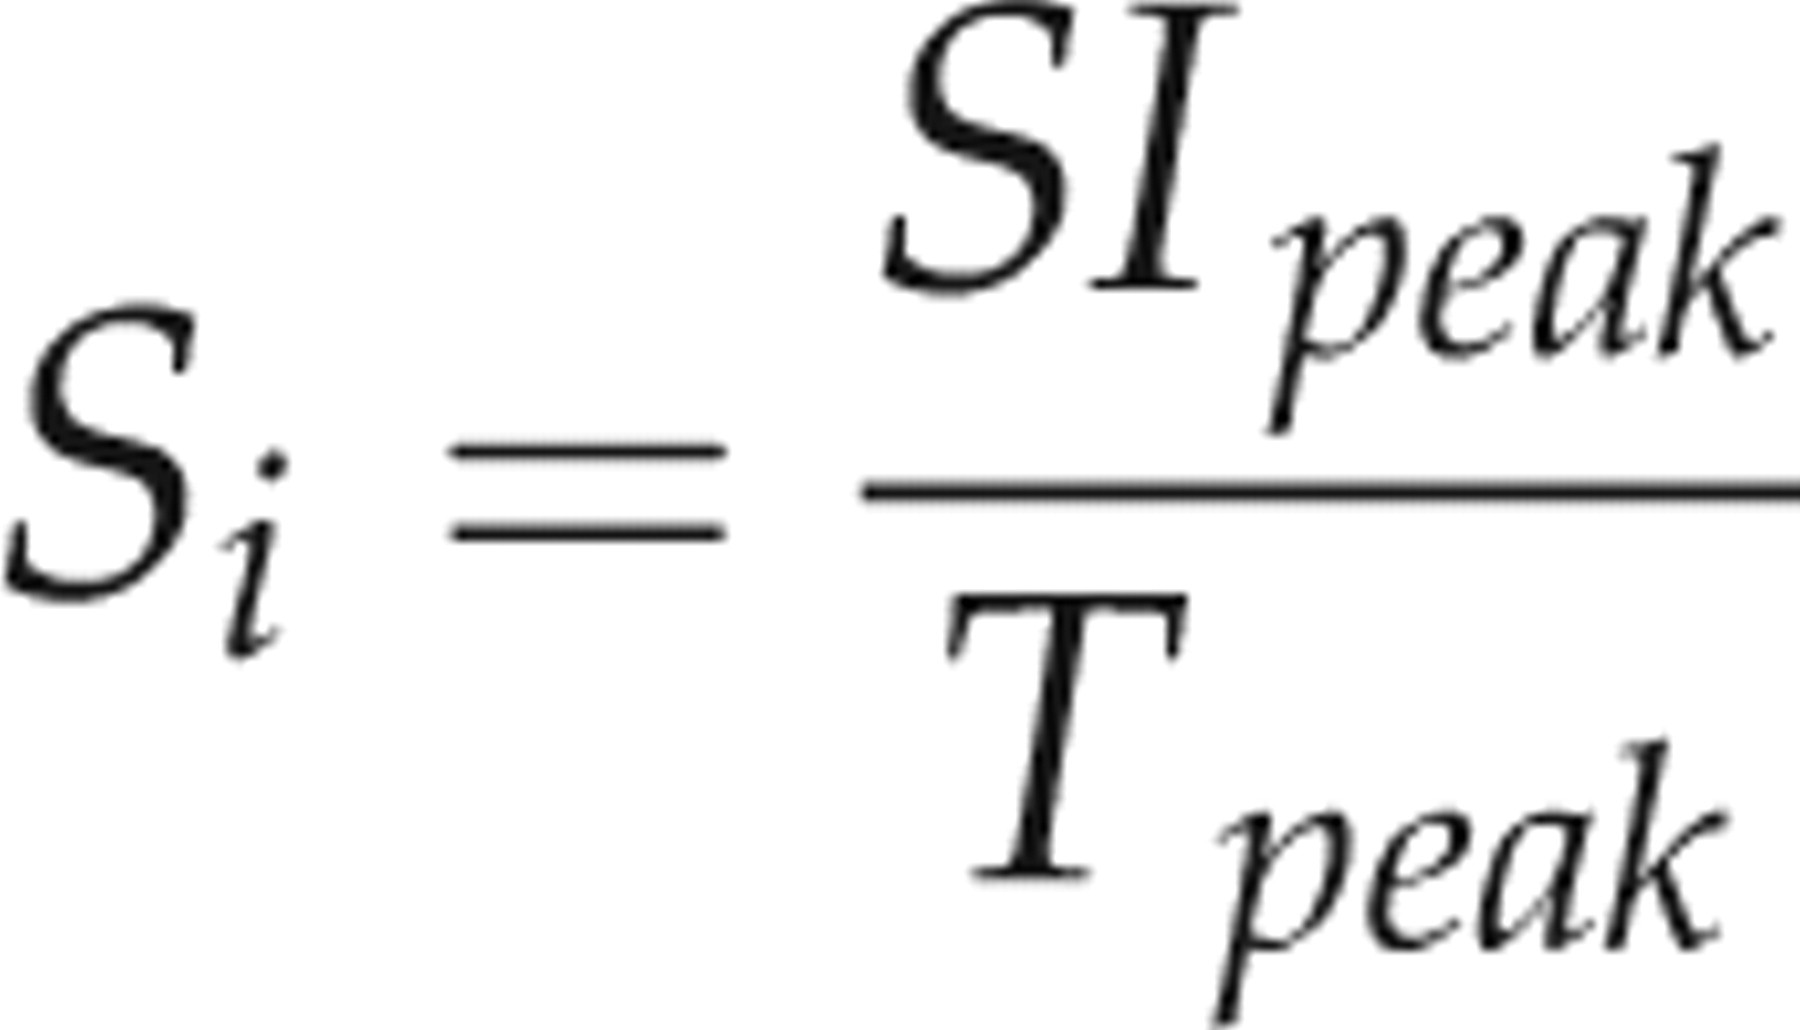
where S i indicates the initial slope, SI peak the maximum intensity, and T peak is time-to-peak. Time to peak signal intensity (time-to-peak) is the time elapsed between the appearance of contrast in the lesion (i.e. start of the curve) and maximum signal intensity value obtained during the time of acquisition.
Wash-out ratio is an established quantitative parameter that is used to describe the downslope of kinetic curves. It gives the relative signal intensity decrease from the peak to the endpoint of the curve

Statistical analysis
Wilcoxon rank-sum test with continuity correction was used to determine which of the kinetic parameters were significantly different between the benign and malignant groups, based on the null hypothesis that both collectives had the same continuous distribution. The mean values and standard deviation were given for all kinetic parameters in malignant and benign lesions.
In order to eliminate the differences in absolute values of signal intensity, kinetic curves were standardized to their peak values, i.e. each signal intensity data point was divided by the peak signal intensity. Comparing standardized curves gives us the possibility to examine solely the dynamics of contrast enhancement. Statistical analysis of standardized time-signal intensity curves was also made with the non-parametric Wilcoxon rank-sum test for independent samples (the test is equivalent to the Mann-Whitney U-test). In the comparison of benign and malignant time-signal intensity curves, P value and Wilcoxon rank-sum statistic (W value) were plotted against time of acquisition to show the trends in statistics graphically. Statistical significance was established at a P value of <0.05.
Receiver-operating characteristic (ROC) curves were drawn for wash-out parameters to demonstrate their diagnostic accuracy in distinguishing between benign and malignant tumors. Areas under the ROC curves and sensitivity/specificity pairs for different cut-off points were also calculated for wash-out ratios.
Data extraction, calculation of parameters, and statistical analysis was performed using the R statistical language and environment for Linux (version 2.10.1). The ROCR package (version 1.0-4) was used for plotting ROC curves and calculation of areas under the curves (AUCs) (25).
Verification of the lesions
Fine needle aspiration biopsies, core biopsies, or surgical excisions were obtained from all findings as the golden standard to correlate imaging scores with. All 75 malignancies and six of the 21 benign lesions were additionally correlated with the histopathology of the surgical specimen.
Results
Lesion parameters
All 96 lesions sizes varied between 4 and 48 mm (mean 18.60 mm). Seventy-five were classified using mammography and ultrasound as definite malignant (ACR BI-RADS 5) with sizes between 4 and 48 mm (mean 18.33 mm, median 16 mm) (57 invasive ductal carcinomas, 4 invasive tubular carcinomas, 12 invasive lobular carcinomas, 1 invasive mucinous carcinoma, and 1 invasive papillary carcinoma). Twenty-one lesions were classified by mammography and ultrasound as benign or probably benign (ACR BI-RADS 2 and 3) with sizes between 8 and 43 mm; mean 18.76 mm and median 15 mm (11 fibroadenomas, 1 intramammary lymph node, 1 axillary lymph node, and 8 benign lesions other than fibroadenoma).
Kinetic parameters
A significant difference was found between the benign and malignant lesions in time-to-peak (Wilcoxon rank-sum statistic W = 422, P value <0.05) and wash-out ratio W50 (W = 1309, P value <0.001). The mean time-to-peak was 9.3 s (SD = 2.46) for malignant lesions and 14.6 s (SD = 8.46) for benign lesions. The mean wash-out ratio was 85% (SD = 0.09) for malignant and 66% (SD = 0.16) for benign lesion, respectively (wash-out ratio of 85% means a signal intensity drop from 100% to 15%, whereas wash-out ratio of 66% indicates that the signal decreased from 100% to 36%, from the peak to the signal intensity measured at 50 s).
There was no statistically significant difference in the absolute values of peak signal intensity (W = 767, P value = 0.85) and initial slope (W = 837, P value = 0.67). The mean values and standard deviation (SD) for peak signal intensity were 20.06 (SD = 22.82) for malignant and 29.53 (SD = 38.53) for benign lesions and for the initial slope were 2.54 (SD = 4.01) for malignant and 3.08 (SD = 4.27) for benign lesions.
The most significant difference between standardized benign and malignant curves was found at 21 s (P value <0.001, Fig. 1), but statistical significance was reached in the range of 14–50 s (Fig. 2).
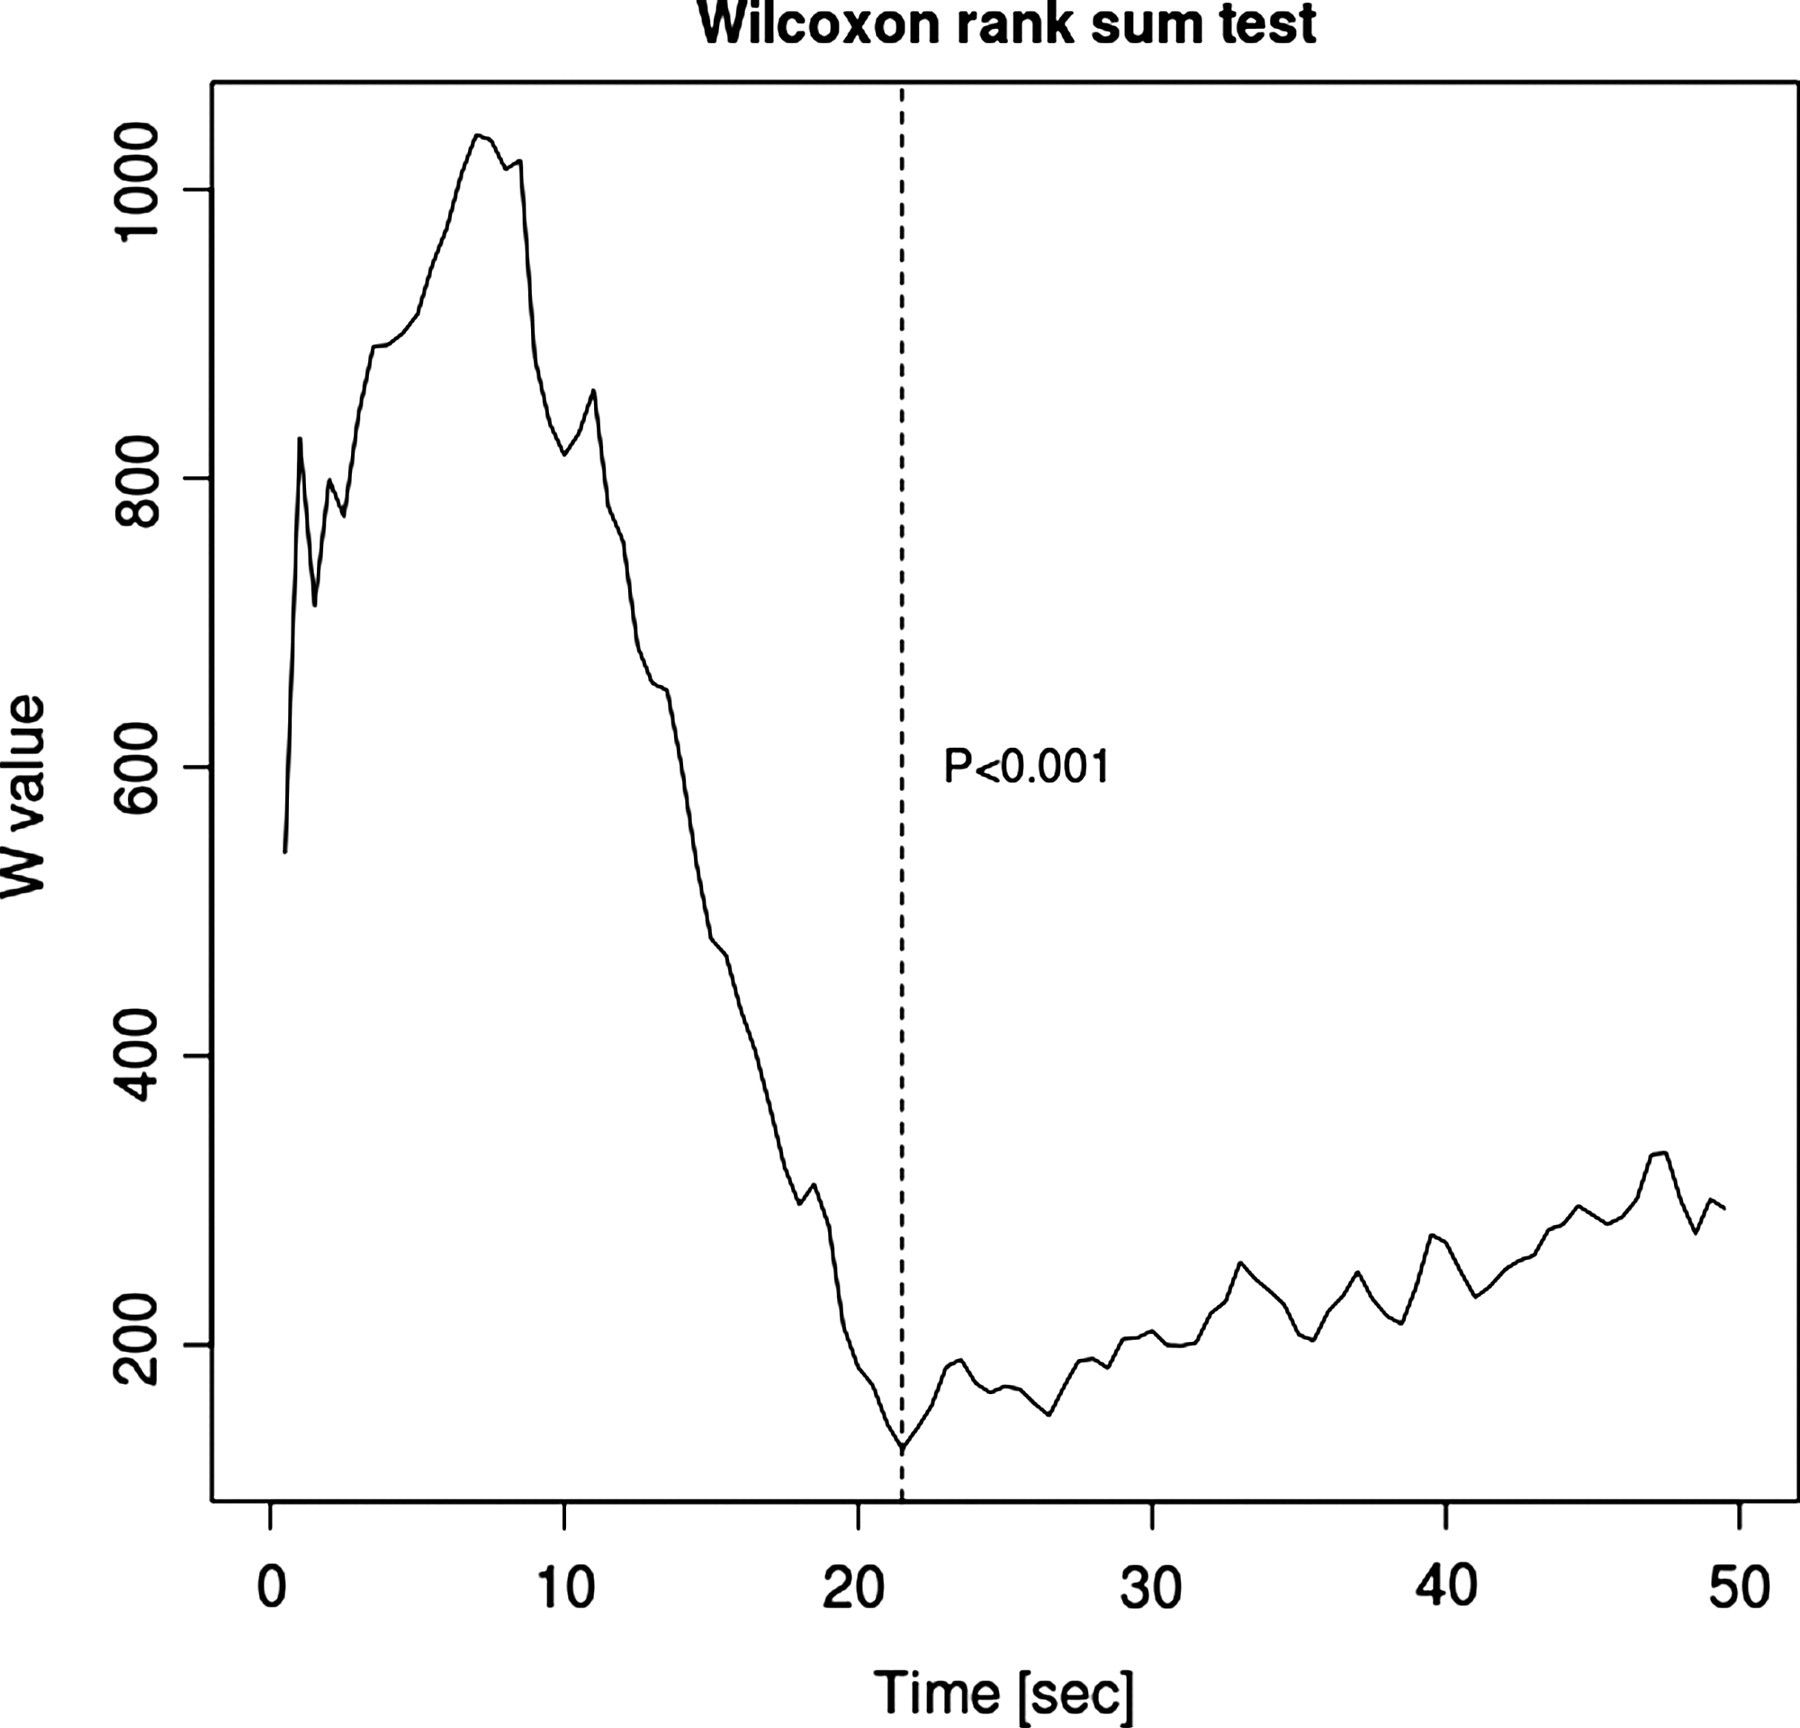
Comparison of benign and malignant time-signal intensity curves standardized to their peak values using Wilcoxon rank-sum test. W-statistic plotted against time of acquisition
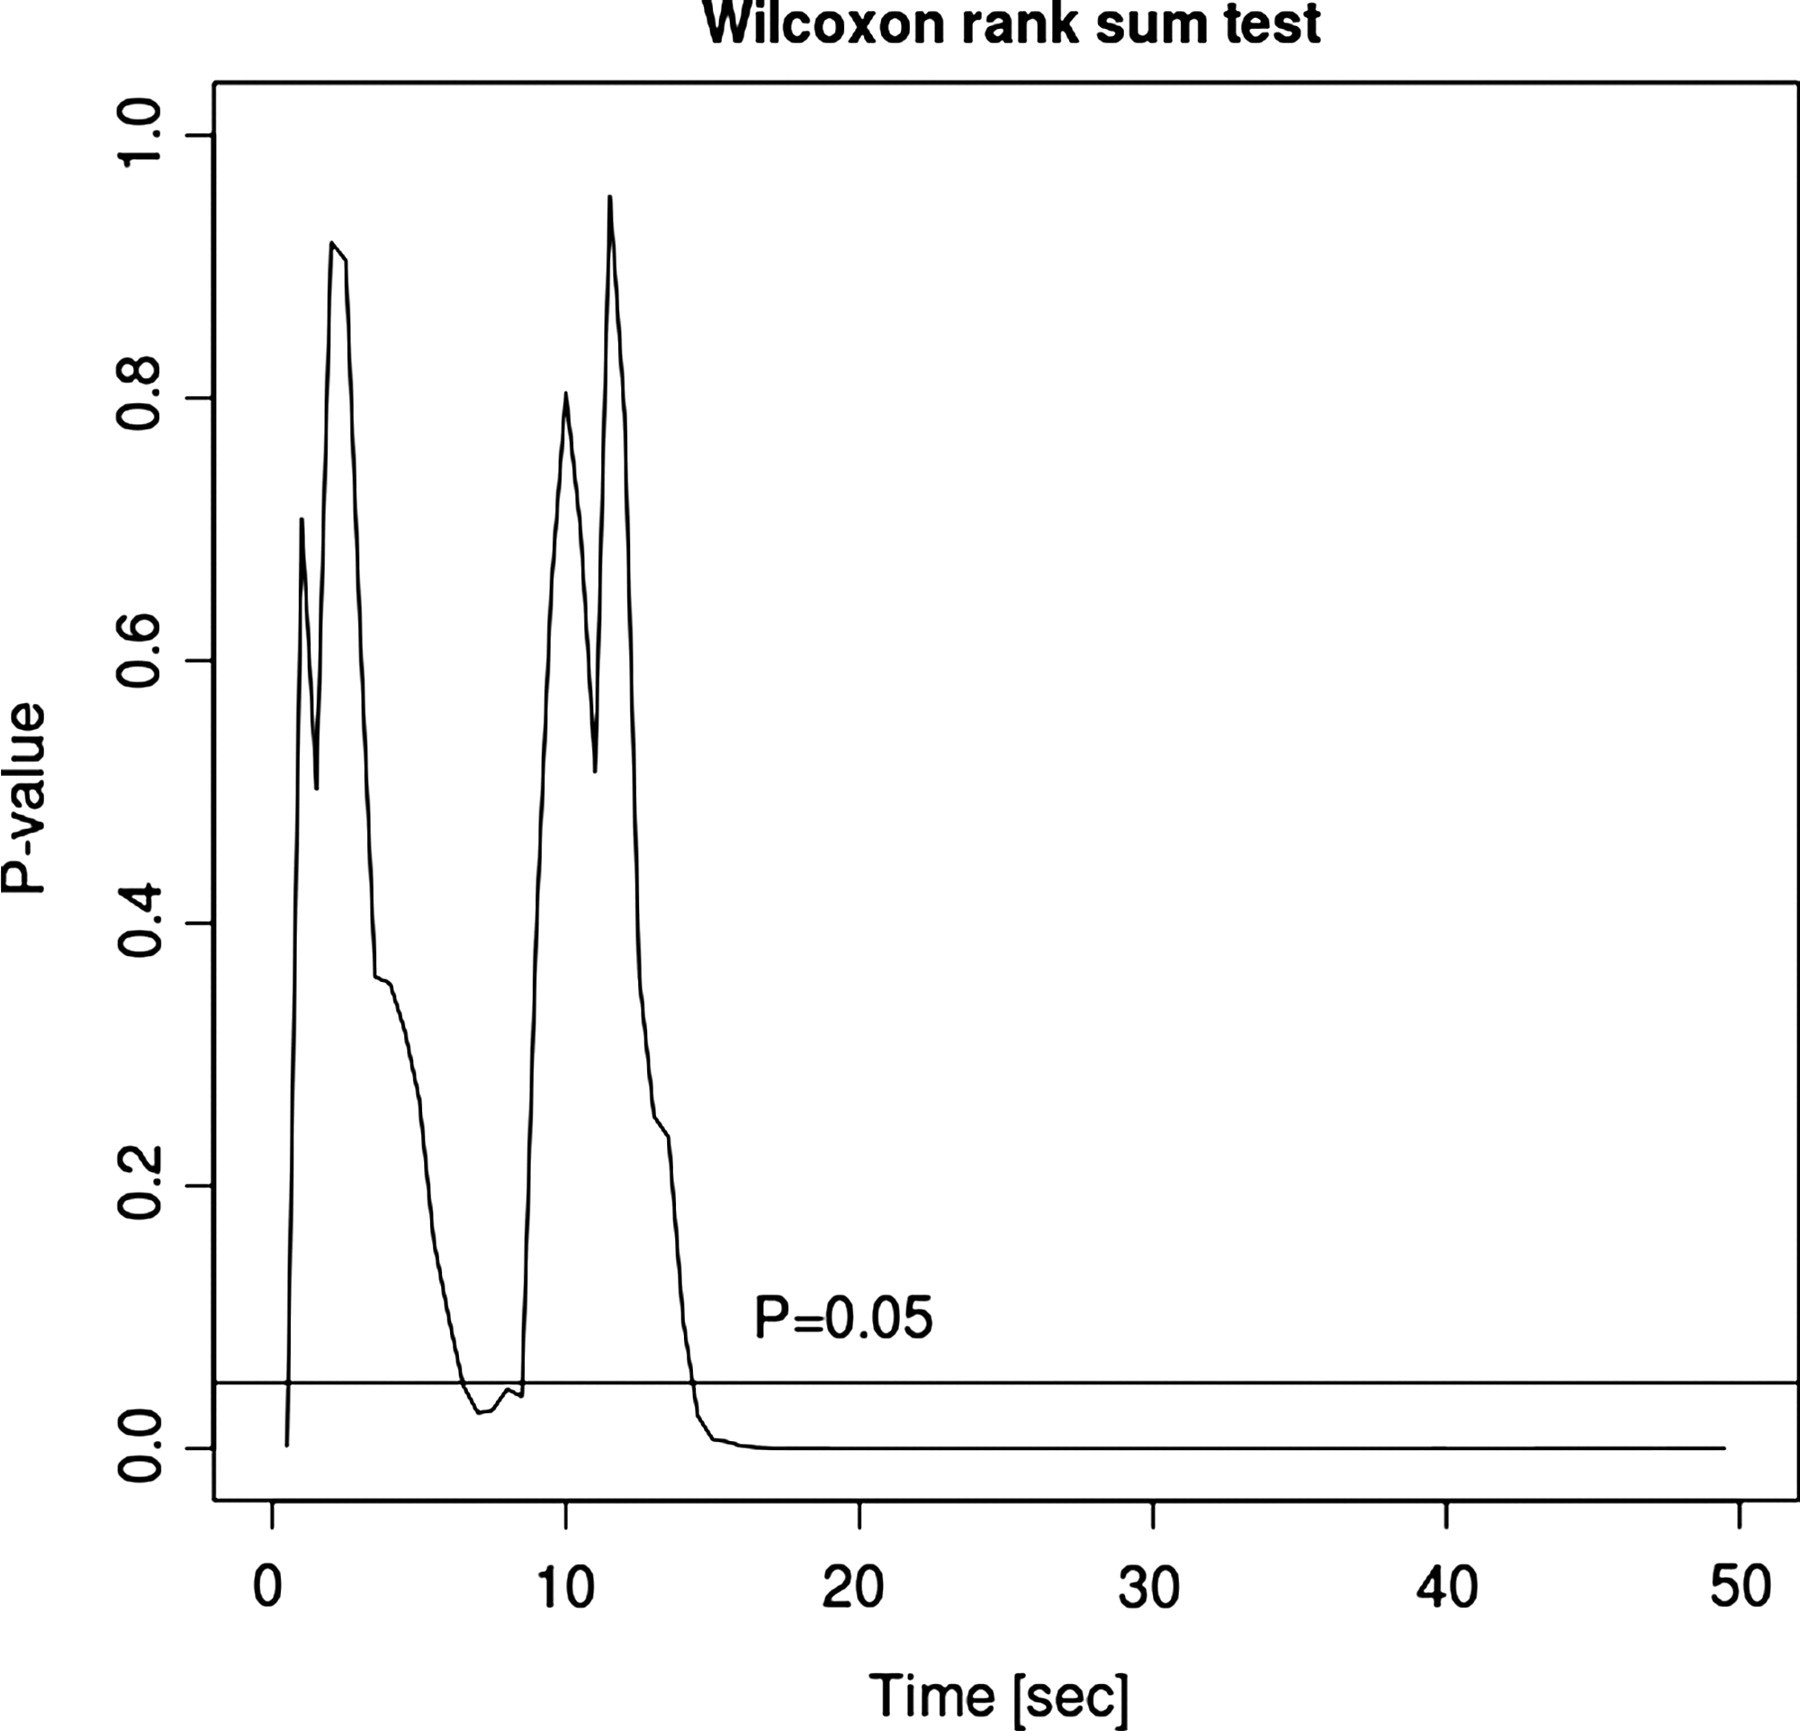
Comparison of benign and malignant time-signal intensity curves standardized to their peak values using Wilcoxon rank-sum test. P value
Because of the significance of this time point, similarly to W50, wash-out ratio was also determined at 21 s
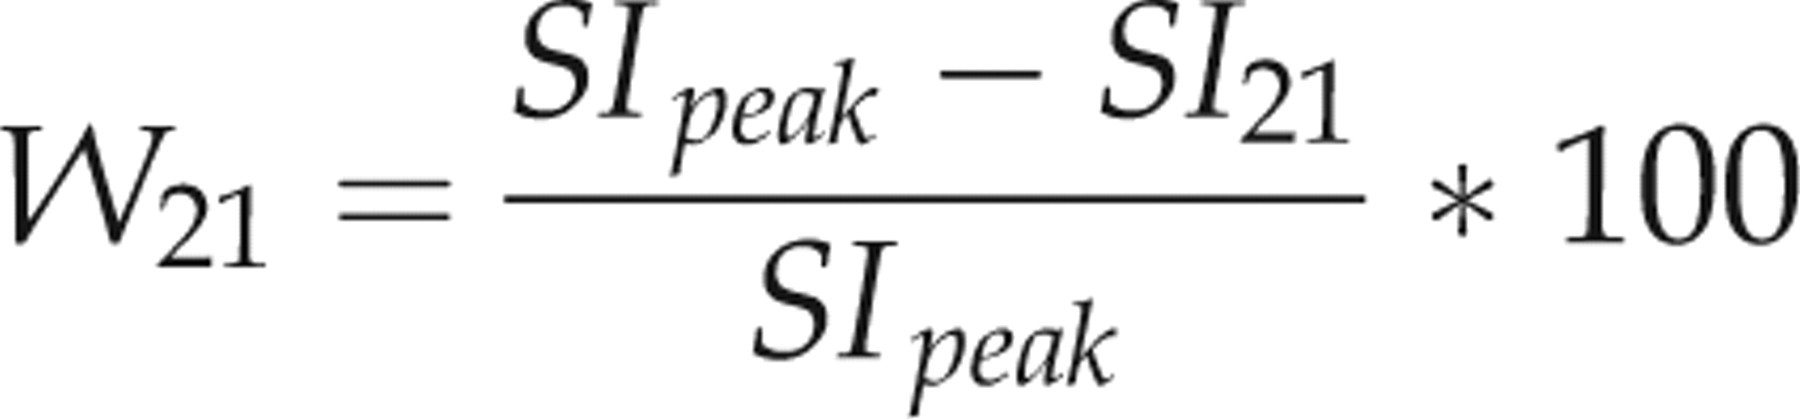
where W 21 is the wash-out ratio, which shows the decrease from the peak (SI peak ) to the signal intensity measured at 21 seconds (SI 21 ). The statistical difference in W21 between benign and malignant groups was confirmed (Wilcoxon rank-sum statistic W = 1444, P value <0.001).
Fig. 3 shows the ROC curves with AUC values for the wash-out ratios W21 and W50.

Receiver-operating characteristic (ROC) curves for two different wash-out ratios W21 and W50 showing diagnostic accuracy in differentiation between benign and malignant breast tumors. The area under the curve (AUC) was 0.9171 for W21 and 0.8308 for W50. Our results indicate that wash-out measured at 21 s has the highest diagnostic accuracy for the diagnosis of breast cancer with CEUS
Discussion
Our study showed that real-time harmonic CEUS as a kinetic tool in the breast can detect significant differences between benign and malignant tumors, when evaluating two main parameters: time-to-peak and wash-out ratio. Peak signal intensity appeared significantly earlier and signal drop from the peak to the intensity measured at 50 s (from the start of the enhancement) was significantly greater in malignant tumors when compared with benign abnormalities. These findings are in accordance with a similar study published by Balleyguier et al. using a material from 58 patients, where they observed very fast contrast enhancement (wash-in) and wash-out was presented immediately after the peak intensity in malignant lesions, whereas benign abnormalities exhibited delayed enhancement and peak intensity was found to be lower (26). Zhao et al. analyzed enhancement kinetics of 76 breast tumors with CEUS and also found that time-to-peak is significantly shorter in malignancies than in benign lesions (23).
Despite our promising result, however, we should keep it in mind that histology and/or cytology are still the most reliable methods to differentiate between malignant and benign lesions and therefore triple assessment should be used in breast tumor diagnosis. There is always a challenge to develop newer imaging methods, preferably minimally or non-invasive techniques, but almost as reliable as the ones mentioned above.
Due to the design of our study it takes only in consideration kinetic features using CEUS in breast tumors, we still regard that it is interesting to compare this study with similar kinetic studies using DCE-MRI. Enhancement kinetics and morphology studies of breast tumors vascularization are popular in the field of DCE-MRI (27, 28).
During the breast tumor evaluation, regardless of their histology, it was found that CEUS and breast DCE-MRI have had certain similarities in the kinetics area (27, 29). These similarities comprise two curve parameters: time-to peak and wash-out ratio.
The analysis of enhancement kinetics is achieved by visually assessing the real-time dynamic images and by measuring the signal intensity in a ROI of the lesions that yield the kinetic curve (time-signal intensity curve).
When evaluating breast cancer (mass-like invasive tumors), both CEUS and DCE-MRI show that there is an earlier intense peak and faster elimination of the contrast media when compared with benign tumors. Actually the wash-out curve in CEUS among this kind of tumor can be compared with DCE-MRI curve type III, where it exhibits a clear decreasing pattern after an initial increase (28). With CEUS, malignant mass-like invasive breast tumors often show early strong contrast enhancement and wash-out phenomenon, in a visually chaotic pattern. This indicates rapid perfusion. On the other hand, slow increase of contrast uptake and wash-out, in a neater visual pattern, is clearly observed in benign lesions (28). In our kinetic study we analyzed the behavior of the contrast agent, in both malignant and benign tumors, during the time course of 50 s. The reason for this is that during the initially visual assessing of the procedure, it was a clear cut-off in both time-to-peak and in the elimination of contrast agent between malignant and benign tumors at early time. Zhao et al. have shown with CEUS that the enhancement velocity or “slope of enhancement” is one of the diagnostic criteria to differentiate cancer from benign lesions as cancer exhibits faster enhancement (23). Many of the tumors in our study showed the same kinetic behavior (Figs. 4 and 5).
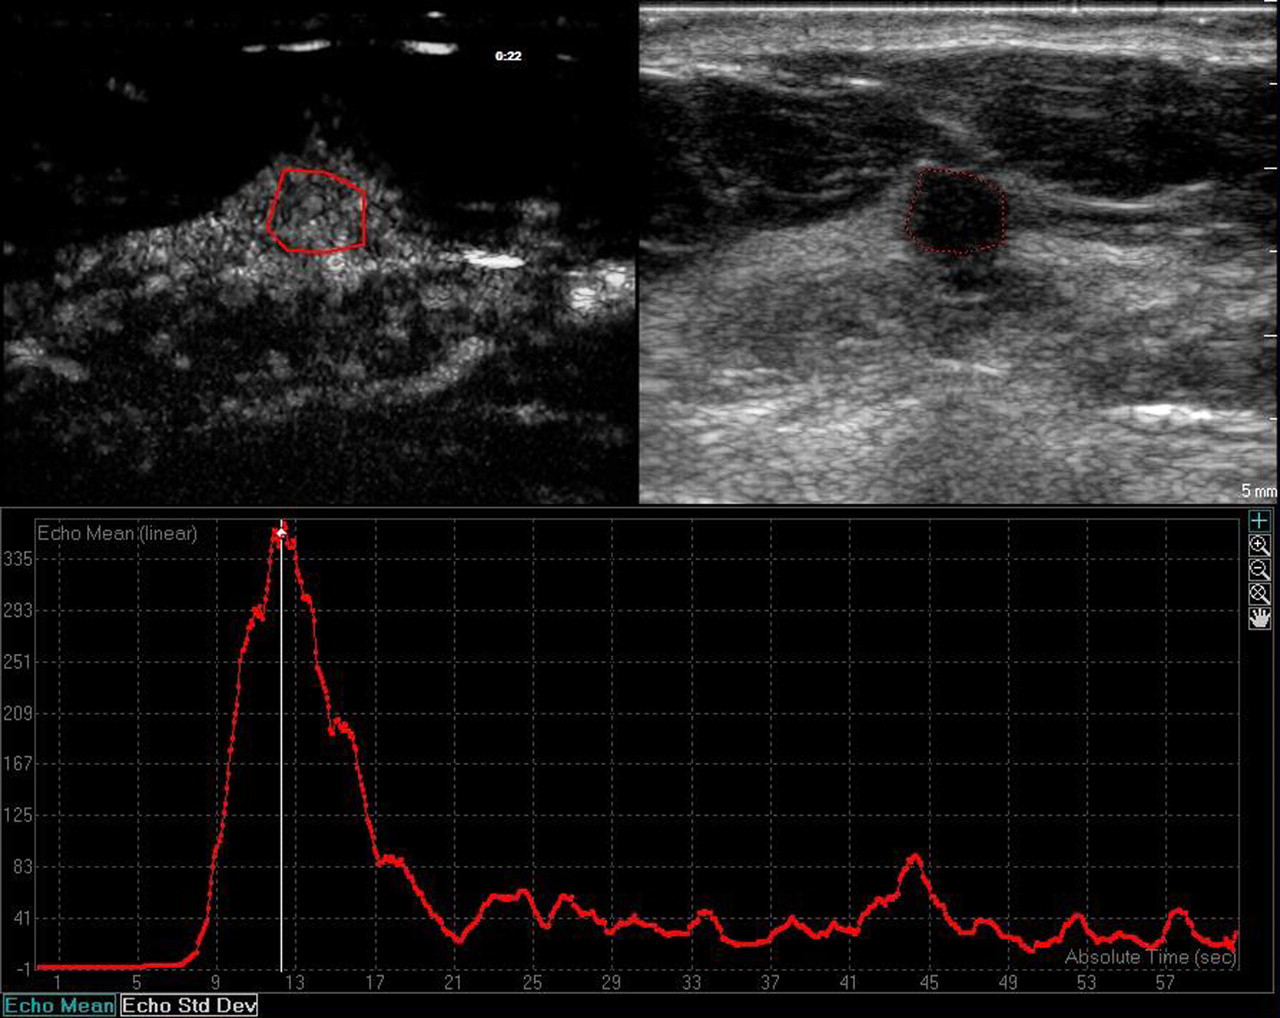
CEUS image of a 7-mm invasive ductal carcinoma, showing enhancement curve with early peak. Time-to-peak measured 12 s, wash-out ratio was 65% at 50 s (W50), and 57% at 21 s (W21)
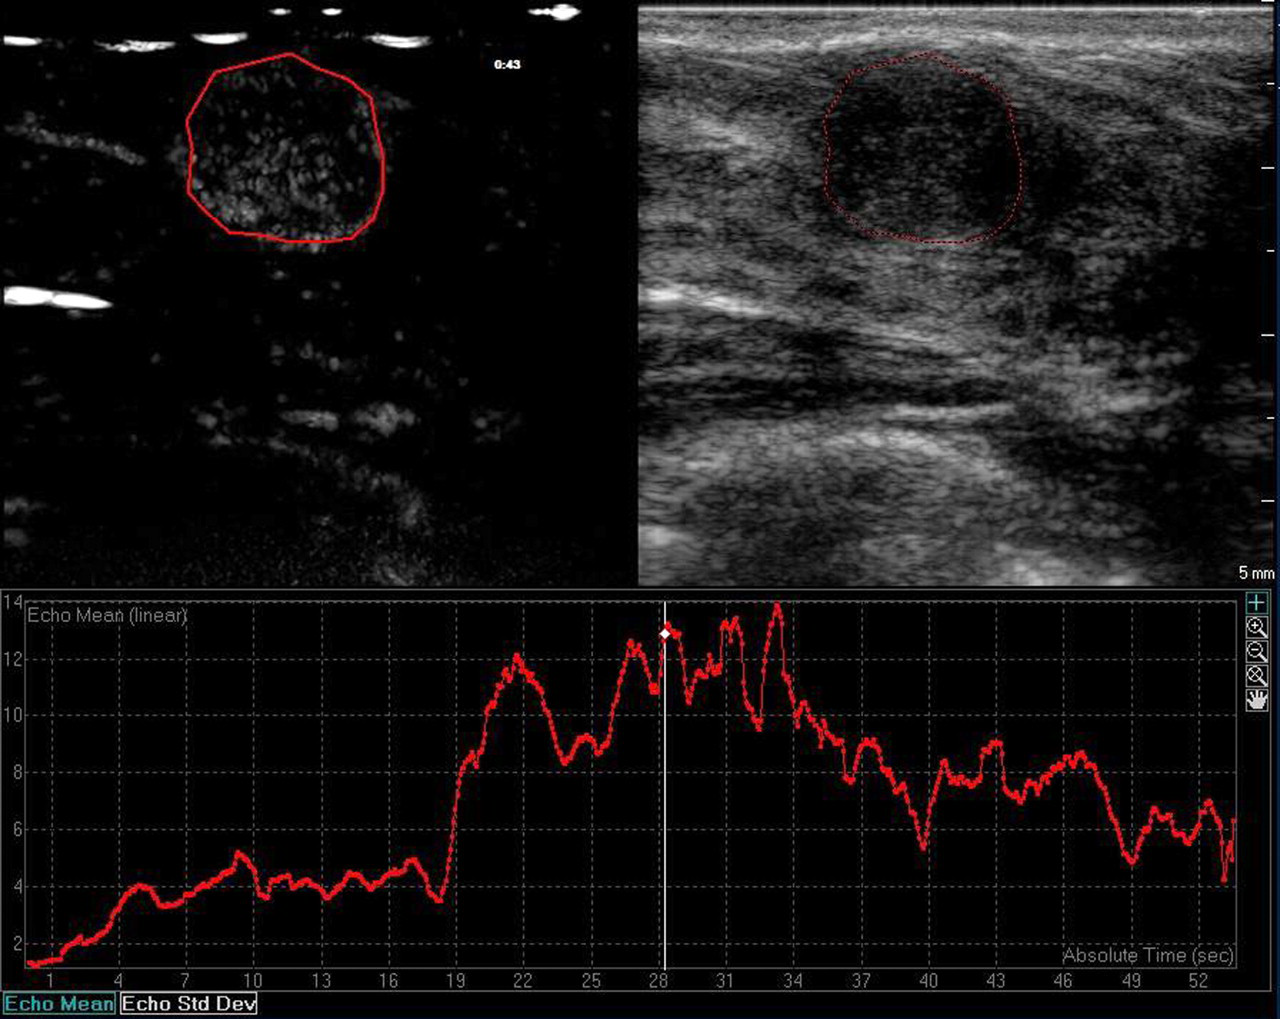
CEUS image of a 12 mm fibroadenoma, enhancement curve with delayed peak and wash-out. The wash-out ratio is much less than 50% at 21 s
A problem that we faced while analyzing these criteria was that even though the slope of enhancement was faster in malignant tumors, the difference between this group and benign tumors was not statistically strong enough. Reasons for this observation might be a limitation of the method or physiological conditions while performing CEUS; some tumors, especially among the benign ones, experienced several ups and downs of signal intensity (Fig. 5). This condition forced us to standardize the curves with the results described above.
Maybe the most useful clinical tool we observed is the fact that after 21 s malignant tumors tend to eliminate more than 50% of the total amount of contrast, while benign tumors tend to eliminates less than 50% (mean values are 69% respective 36% elimination of contrast at 21 s).
The pathophysiology behind the two observed curve parameters remains speculative but the faster enhancement/elimination of contrast media in cancer tumors strongly suggests the presence of a high number of arterio-venous shunts with rapid in/outflow (28, 30). This speculative observation might be used, in the future, to correlate the behavior of the contrast media with the grading of tumors and their prognosis (31).
The clue to understanding all the different behaviors of any contrast agent in a tumor is that we are indirectly watching the process of angiogenesis. Angiogenesis is the formation of new vessels and may be the result of a physiologic (wound healing) or pathologic process (tumor growth) (32).
Another factor is the fact that neo-vessels in and around a tumor differ from normal capillaries. This is proved since their layer is thinner and lacks pericytes and the biochemical constitution of the basal membrane increases its permeability.
Intravenously administered gadolinium-based MR contrast agents are located within the vessels initially but distributed to the interstitial tissue at a later stage. As opposed to this, one of the main characteristics of microbubble contrast agents used in CEUS is that they are purely vascular, and endothelial permeability does not affect the pool of contrast at any time (33). CEUS shows the vascular and neo-vascular net. Even the pool of contrast agent inside the neo-capillaries does not show any diffusion to interstitial space. The initial intravascular phase of contrast kinetics is not affected by vascular permeability therefore it is assumed that it should be similar in both DCE-MRI and CEUS. We can speculate that the better results in MRI in the literature may result from additional effects of permeability or different physical principles of the method. This may explain why the kinetic characteristics observed in our study and described previously occurs during the first 50 s of the incoming contrast agent to the concerned areas.
CEUS might develop to a more cost-effective alternative compared to DCE-MRI in quantifying angiogenesis. This information could complement the diagnostic performance of mammography and ultrasound in the follow-up of patients under neoadjuvant therapy in advanced breast cancer.
Even though we were able to find certain kinetic differences between benign and malignant tumors, there were limitations to our study. First, the study population was chosen on the basis of typically benign and malignant morphological appearance by mammography and ultrasound. Our study adopted this simplified study design, because the focus of this study was on the differences in physiological behavior of benign and malignant breast tumors. We had no intention to determine the diagnostic accuracy of CEUS in mammographically and/or sonographically equivocal pathologies. We believe that the exclusion of BI-RADS 4 lesions has no major effect on the interpretation of our results.
Second, this material is biased by a higher rate of malignant cases with a relatively high average lesion size. It should be kept in mind that a high prevalence of malignancy included may lead to exaggerated false-negative rate and lower false-positive rate.
Third, differences in physiological conditions of patients such as heart rate and body weight might also influence CEUS kinetics, especially the initial slope of contrast enhancement, i.e. reaching peak signal intensity. This should also be looked at in further studies dealing with CEUS enhancement dynamics.
In conclusion, this study suggests that real-time CEUS (using contrast harmonic imaging) can evolve into a new non-invasive option for differentiate malignant from benign breast lesions. Further investigation in a larger population including different ACR BI-RADS lesions, should be performed to corroborate the reliability of the method.