
Abstract
Background
Small bowel peristalsis is a complex of many individual motion elements. Although each element of peristalsis can be measured there is no current global measure of peristalsis.
Purpose
To examine the feasibility of automated computerized assessment of global small bowel motility using simple computational methods.
Material and Methods
Coronal dynamic MR images were obtained from five healthy volunteers who had fasted for 9 h and drunk 1.5 L of water. Images were taken using single breath-hold and ECG triggering. Acquisitions were repeated at 10 and 20 min after an intramuscular injection of hyoscine butylbromide. Parametric maps were generated representing the mean change in signal amplitude (MSA) per voxel for each dynamic acquisition. Two observers independently assessed thresholding for optimal segmentation of small bowel from other sources of signal. Total voxel activity (TVA) for each study was calculated as a sum of MSA per slice and whole examination and TVA profiles were generated.
Results
Independent observations suggest that the automated segmentation method described usefully segments small bowel activity from other signal. Small bowel movement represented as TVA varied three-fold in the five volunteers and was inhibited by anti-muscarinic injection.
Conclusion
It is possible to develop a new measure, based on automated segmentation of mean signal amplitude changes, of small bowel peristalsis using dynamic MR.
Keywords
Barium follow-through and enteroclysis using fluoroscopy have been the principle techniques used in imaging of the small bowel for the last 60 years (1–9). Small bowel follow through examinations provide both anatomical and functional information about small bowel peristalsis. However, quantifying peristaltic activity on fluoroscopic contrast studies is difficult. Normal small bowel function results in complex three-dimensional movements at multiple points in space at any one time (10). Therefore conventional visual analysis is often impractical due to the volume of data. Other functional small bowel studies such as manometry and scintigraphic transit tests are either invasive or carry a burden of ionizing radiation and are limited to research centers (11). In the last decade cross-sectional techniques, such as CT and MRI, have been developed for examining small bowel. To date most research has concentrated on producing anatomical representations of disease (12–14) although more recently there have been a number of reports of physiological applications (10, 15–18). Ultrafast MRI techniques have enabled the measurement of the transit time (19), volume changes and localized peristaltic movement of small bowel (20, 21). These measurements have so far been obtained from localized regions of interest (ROI) using manual segmentation techniques and are particularly time-consuming (15, 16, 22). Typically authors have concentrated on either luminal changes or chyme propagation (23), with measurement of peristaltic contractions over limited segments of bowel. However there is a need for more global measures of small bowel motility. Obesity is a major problem in developed nations and malnutrition afflicts many developing nations. Most pharmaceutical interventions are delivered through the gut with oral preparations. Despite these areas being significant healthcare interests the interaction between small bowel health, ageing and disease, and the delivery of nutrition and enteric drug therapy is poorly understood. Research on a single element of small bowel motility, such as an isolated peristaltic wave, increases our understanding of this localized motion. However, this motion does not represent the complexity of global small bowel motility which needs to be assessed using a technique that includes all elements of motion associated with small bowel (24).
The general aim of this paper is to evaluate a novel approach to measuring global small bowel mechanics in vivo, using an automated computational approach to analyzing dynamic MR data-sets, with the aim of providing a metric of global small bowel activity. The two specific research questions are firstly: is it possible to automatically segment small bowel movement from dynamic MR data-sets? Secondly, can this segmented data be confirmed to be small bowel?
Material and Methods
This was a proof-of-concept study, which aimed to demonstrate a new metric of small bowel peristalsis using dynamic MR. Local research ethics committee approval for the study protocol was obtained.
MR
Five healthy male volunteers (all non-smokers with no previous abdominal operations and no co-morbid medical conditions), age range 32–48 years (median 38.2 years), were enrolled in the study and written consent was obtained. The volunteers fasted for 9 h, after which they drank 1 L of tap water at ambient temperature over 15 min and waited 15 min before acquisition of MR data (16, 25–27). Imaging was performed on a 1.5T MR system (Siemens Avanto, Siemens Medical Solutions, Erlangen, Germany) using two body phased array coils (anterior elements). The volunteers were positioned supine. Coronal images covering the whole abdomen were acquired from the anterior abdominal muscular wall to the posterior border of L3/L4 disc. Images were acquired using a prospectively ECG-triggered (resting heart rate 60–86 bpm) balanced steady-state free precession sequence (TrueFISP) (28, 29) (TE 1.31 ms, TR 3.28 ms, bandwidth 490 Hz/pixel, FOV 40 × 40 cm, Matrix 192 × 144, voxel size 2.1 × 2.7 × 10 mm, flip angle 59°, ET 1, slice thickness 10 mm, trigger delay 112 ms, mean temporal resolution of 1.15 frame/s) using a single 30-s breath-hold. This was repeated 10 times to cover the whole abdomen with approximately 30 s rest between acquisitions. Each abdominal acquisition of 10 slices took approximately 10 min to complete.
At the end of the first acquisition each volunteer was then injected with 20 mg of Hyoscine Butylbromide (Buscopan®) intramuscularly. The dynamic MR acquisition was then repeated at 10 and 20 min after the injection.
Analysis
Images were processed using an in-house program developed in MatLab (Matlab version 7.8, The Mathworks, Natick, MA, USA). It was assumed that the signal, attributable to small bowel peristalsis (including movement in adjacent extra-mural soft tissues), within any given voxel (v) would vary between peaks (maximum signal) and troughs (minimum signal) in successive MR images (i), in a given dynamic MR data-set containing a specified number (n) of images acquired over a period of time (t mri). Change in signal within a voxel was measured as absolute change (the direction of signal, either increase or decrease, were considered equally) and calculated as a mean amplitude (A).
The parametric values for each voxel were calculated as a mean signal amplitude (MSA) as follows (n = number frames in dynamic MR series).

This provides a measure without units. The rationale for using this measure is that as long as the sampling frequency (not fixed temporally but determined by ECG triggers) is high enough then the MSA may be used as an objective measure of bowel motility (Fig. 1).
(a) A single image from a cinematic MR data-set with a parametric map (b) demonstrates a single area of high mean change in signal amplitude corresponding to small bowel peristalsis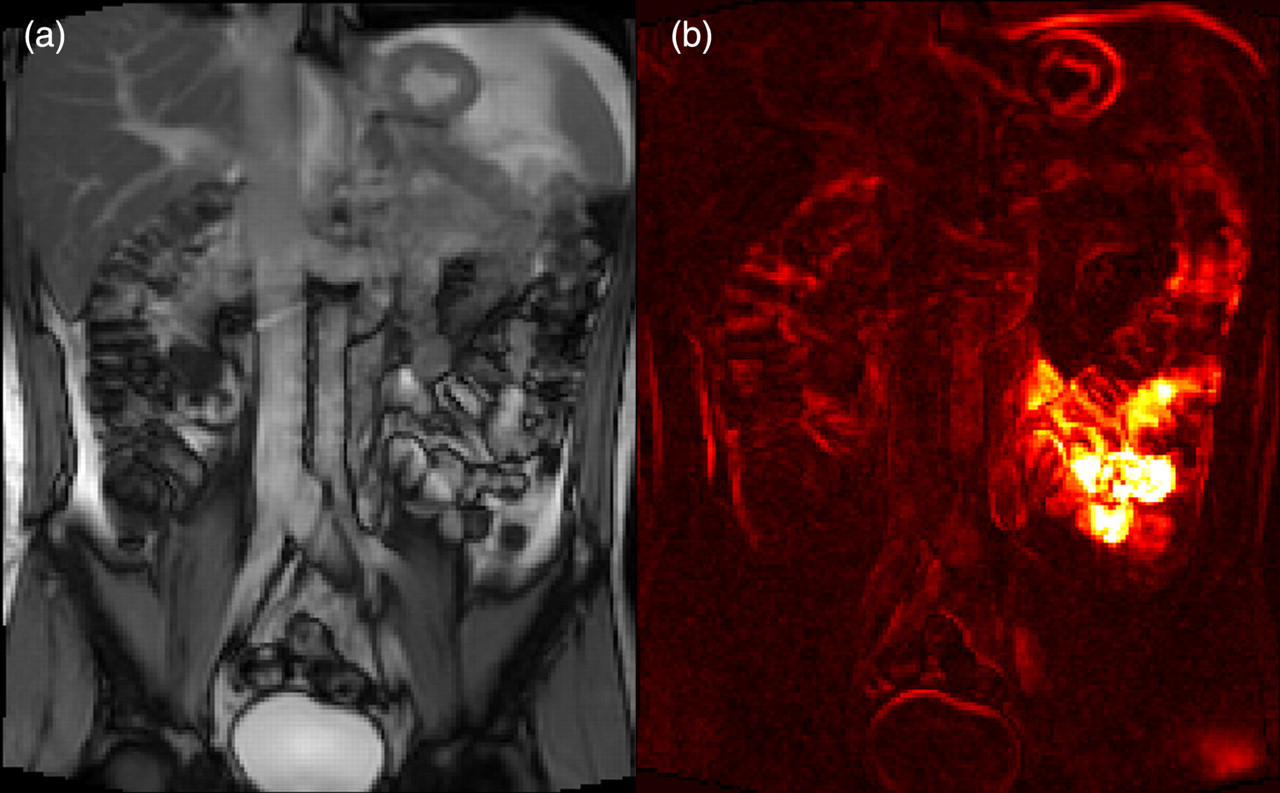
Segmentation
A frequency histogram of MSA was produced and normalized so that the maximal MSA was equal to 10. Segmentation was performed by then discarding the data from the lower end of the histogram at 10% intervals. In other words at threshold 1 the left-hand tail of the histogram representing the lowest 10% quantile was removed. At threshold 2 the lowest 20% quantile was removed and so on. The assumption, at this stage, being that the higher the MSA the more likely it was to reflect small bowel activity and the lower the MSA the more likely that the data was contaminated by other sources of movement (Fig. 2). This segmentation process takes no more than 1 min to load the data, select a threshold, and produce a parametric map.
Screenshot from the MatLab application applying a threshold (level 3 on a normalized scale of 1 to 10) to the dynamic dataset (image on the left) to produce a segmented parametric map of mean change in signal amplitude (image on right)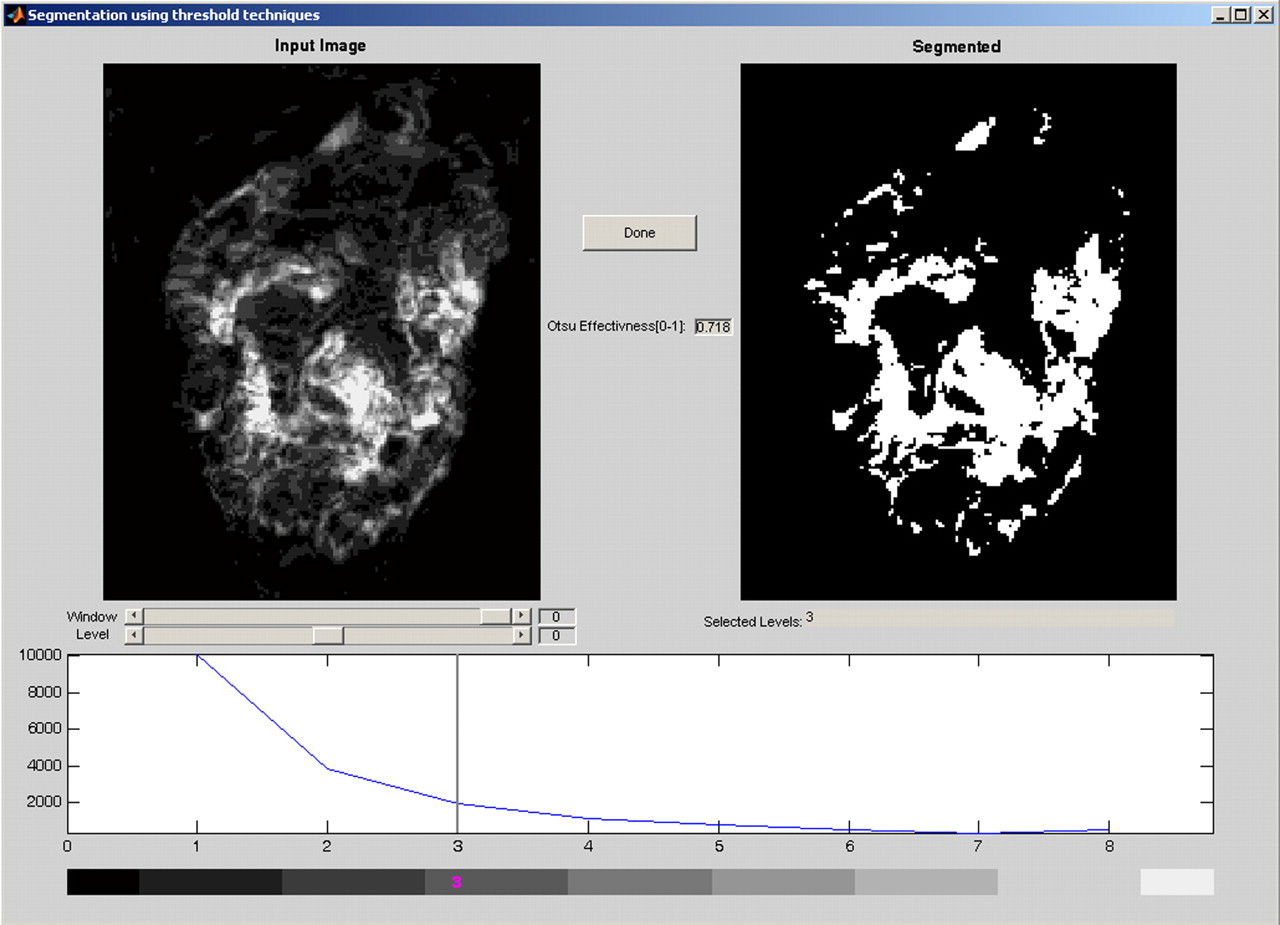
Correlation of parametric maps with small bowel activity
The aim of this part of the study was to determine whether the assumption described above could be supported by subjective assessment by two independent observers. A single, pre-injection, coronal dynamic MR sequence through the mid abdomen was used to generate parametric maps representing MSA. Seven maps were produced at sequential thresholds from 1 to 8 representing progressive discard of the lowest 10% to 80% quantiles of data. Each parametric map was viewed by the two independent observers (two consultant radiologists with 14 and 19 years of radiological experience) alongside a movie (AVI running on a loop) of the original dynamic MR sequence.
A 9 × 9 grid was laid over the cinematic MR sequence and each of the parametric maps. Each cell within the grid was identified by a grid reference. Each observer scored each cell on the grid for how well the parametric map represented small bowel activity in the corresponding cell in the dynamic MR sequence (Fig. 3). The scoring system for the anatomical distribution of small bowel as follows: 0, no signal and no small bowel activity; 1, under-represented; 2, good match; 3, over-represented small bowel activity. Inter-rater agreement was assessed using a weighted Cohen's Kappa coefficient of agreement.
Screenshot demonstrating the correlation of dynamic MR movies with parametric maps. Each cell in the grid was scored independently by two observers who rated the parametric map as under-represented, over-represented, or a good representation of small bowel movement in the corresponding cell of the MR movie
Muscarinic receptor blockade
For this part of the study the parametric maps were generated, as described above, for all coronal slices covering each volunteer abdomen. A threshold was applied at level 3 (for the normalized data) following the analysis in the first part of this study. The sum of the MSA values in all voxels were calculated, and described as the total voxel activity (TVA), for each slice and for all slices combined. Descriptive statistics were performed on each study (MedCalc® version 9.3.0.0).
Results
Correlation of parametric maps with small bowel activity
In the parametric maps generated with the lowest thresholds the maps tended to over-represent small bowel activity. With increasing threshold levels this over representation decreased. This was accompanied by a gradual rise in the number of cells where small bowel was under-represented. At threshold 5 the two curves (of over-represented and under-represented small bowel) crossed each other. The threshold for the maximal number of “good correlation” cells was 3 (Fig. 4).
A frequency polygon demonstrates the relationship between representations of small bowel movement by parametric maps with increasing thresholds. As thresholds rise over-representation of small bowel in the parametric map falls rapidly. In other words the mean change in signal amplitude from sources other than small bowel is reduced by increasing the threshold for segmenting the parametric maps. The cost is that with the higher thresholds comes a loss of data from small bowel as it is increasingly under-represented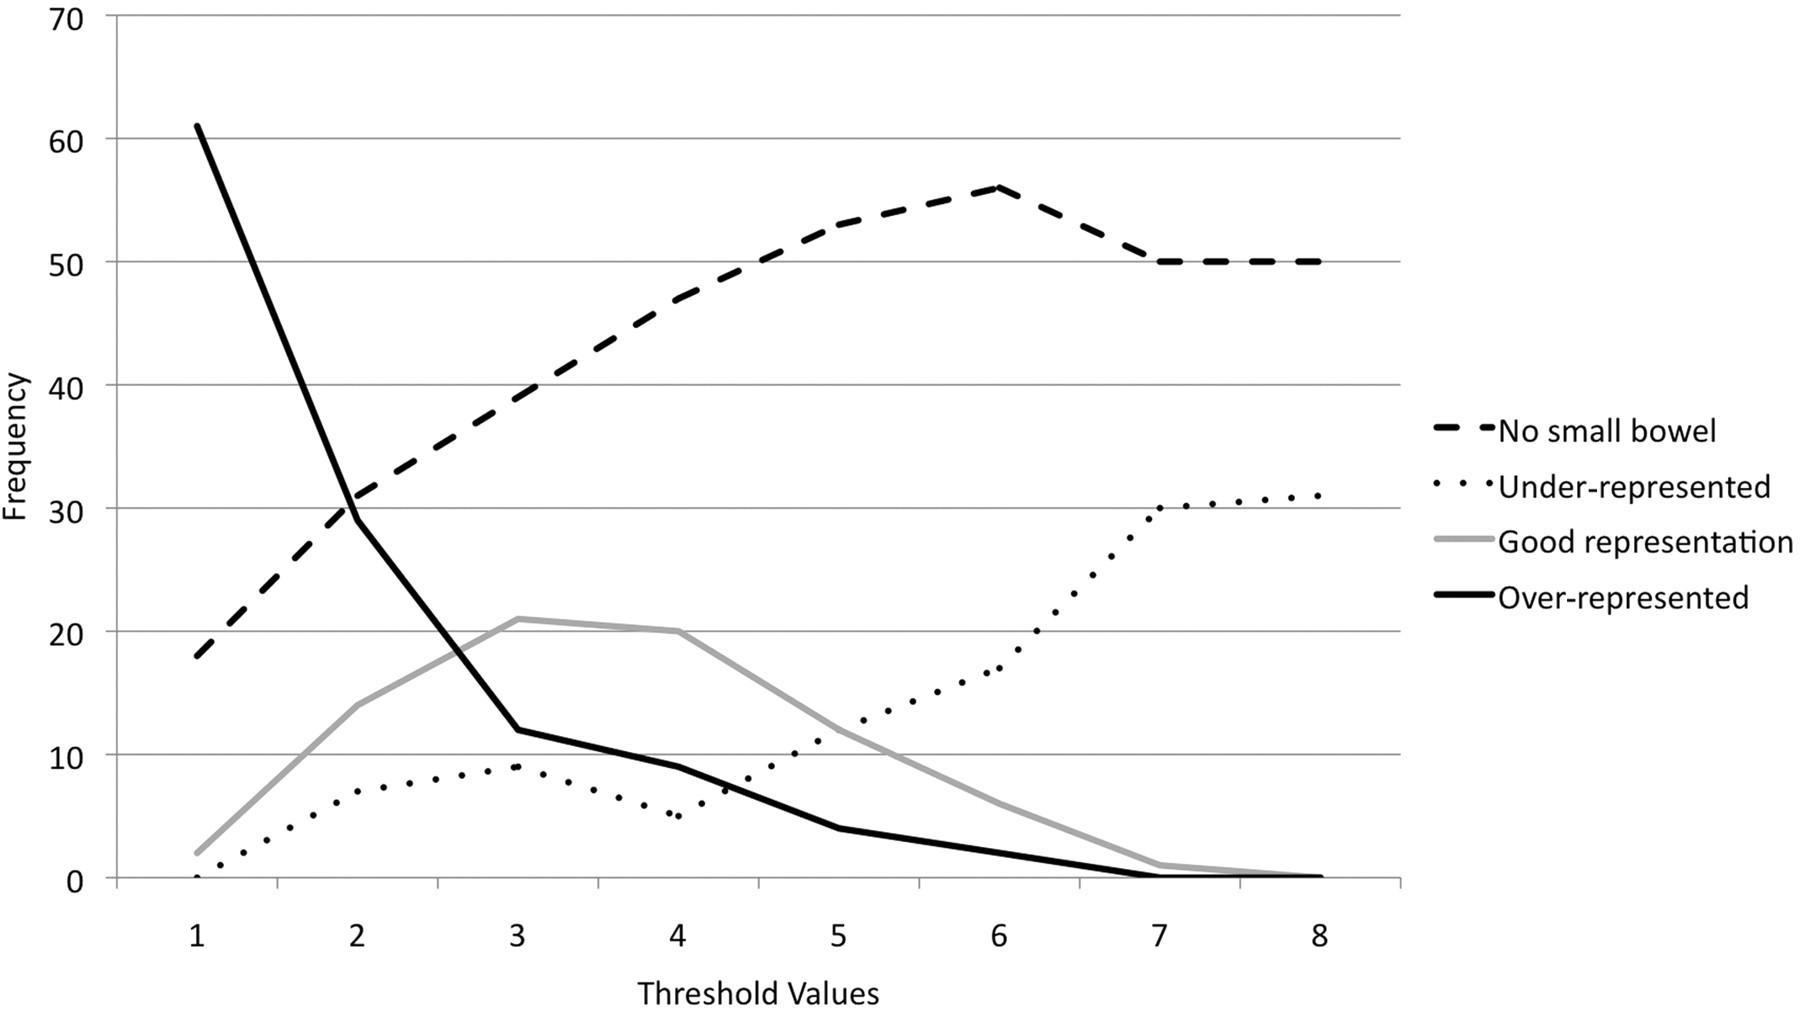
The inter-rater reliability for assessment of the parametric maps was “very good” with a combined weighted kappa coefficient of agreement of κ = 0.868 (95% CI 0.79–0.94). The inter-rater reliability for defining active small bowel on the dynamic MR was “very good” (κ = 0.825, 95% CI 0.7–0.95) (30).
Muscarinic blockade
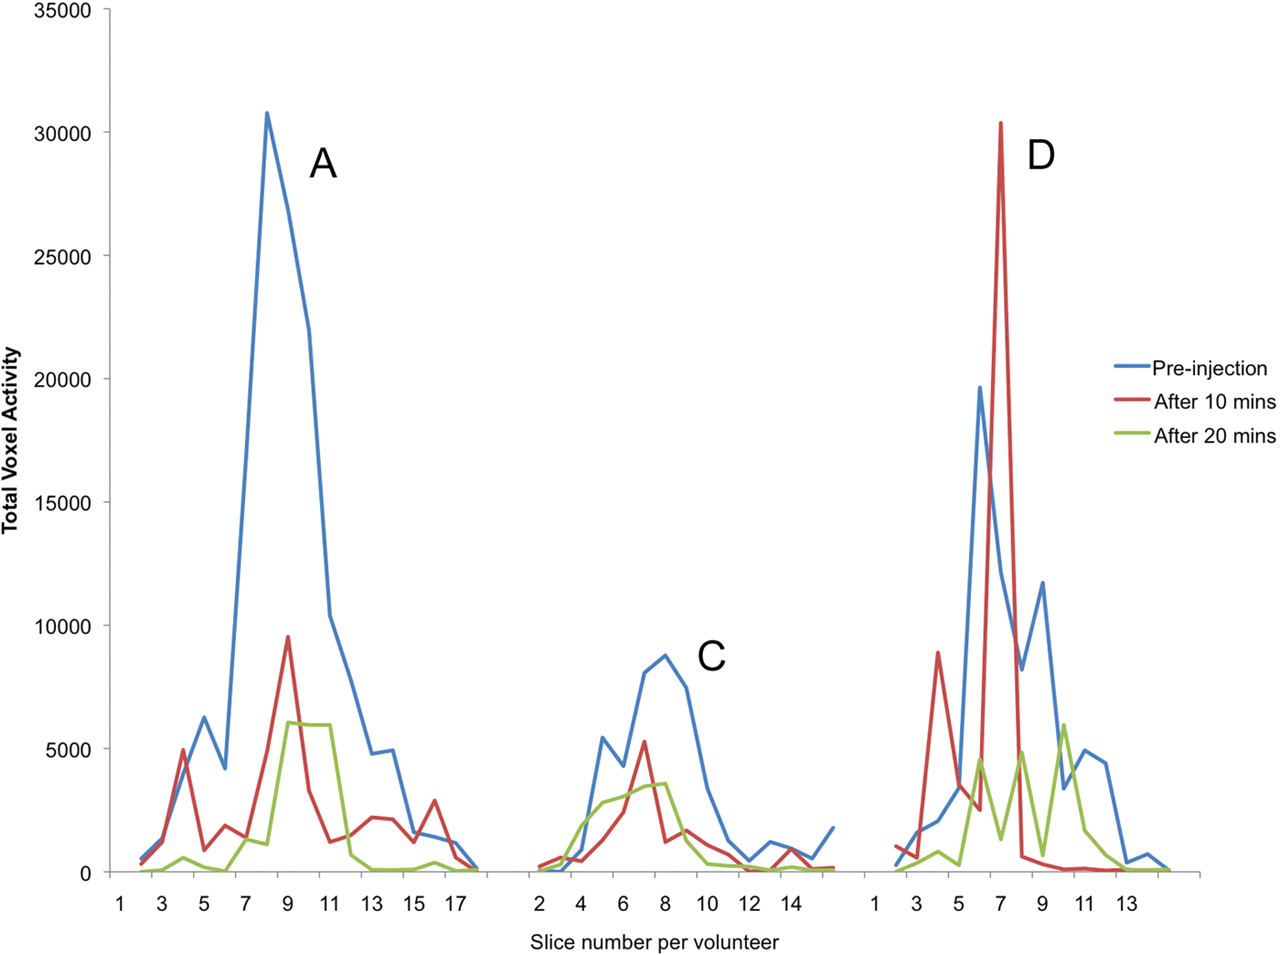
The mean TVA prior to injection with hyoscine was 94,000 (SD 35,000). The fasting TVA varied almost three-fold from 50,000 (SD 3000) to 145,000 (SD 10,000). This fell to a mean of 36,000 (SD 13,000) 10 min after injection and then 33,000 (SD 18,000) 20 min after injection (Table 1). Individual profiles varied, as indicated by the increasing standard deviation with drop in mean TVA at 20 min. Two volunteers demonstrated a recovery in TVA 20 min after injection, one volunteer demonstrated almost no recovery and the other two demonstrated a continued fall in TVA (Fig. 5). When frequency polygons for slice by slice TVA were created they demonstrated marked variability in the profiles of the graphs both at rest an in response to anti-muscarinic blockade (Fig. 6).
Box and whisker plot demonstrating the voxel activity for volunteers A, C, and D before and then 10 and 20 min after intravenous injection of hyoscine. These demonstrate variable suppression and recovery in small bowel activity Frequency polygons demonstrating total voxel activity per coronal slice for three selected volunteers (A, C, and D). The TVA falls substantially in A and remains low after 20 min. In volunteer C the TVA starts low, is reduced further after injection but then increases. The increase occurs as an increase in width, but not amplitude of the curve, indicating that small bowel activity is recovering by increasing the length of active small bowel but not the level of activity per unit length. In volunteer D the TVA curve increases in amplitude but decreases in width after injection suggesting that while there is an overall decrease in activity there is an initial increase in activity in a small length of bowel before this decreases by 20 min Table summarizing the changes in total voxel activity (TVA) as a result of administration of intramscular hyoscine butylbromide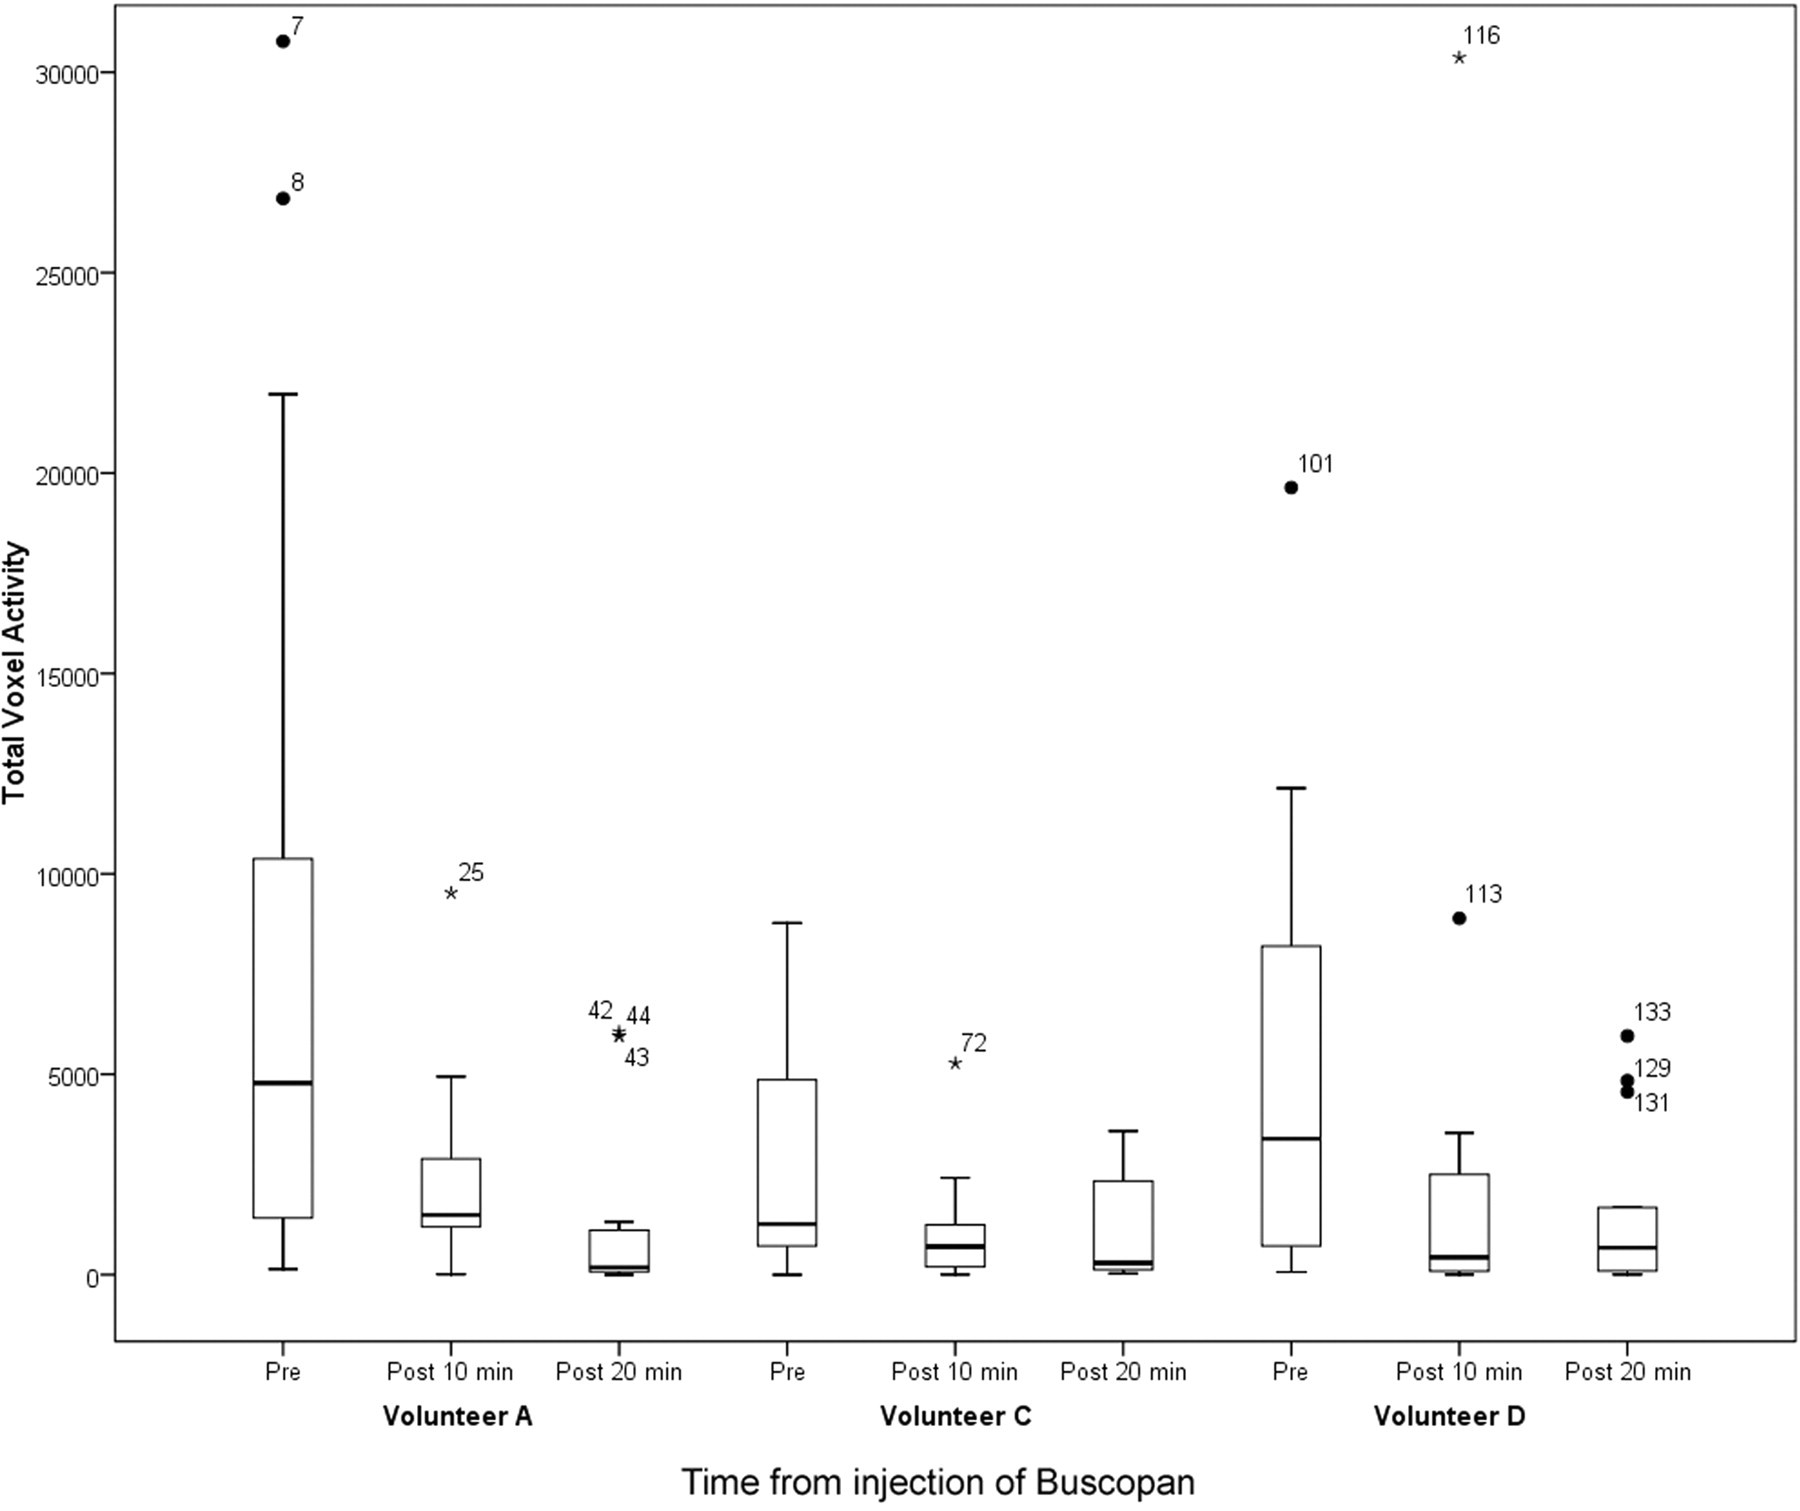
Discussion
The results of this study suggest that this technique may be feasible and the potential applications require some consideration. The technique would provide metrics reflecting global small bowel motility and not localized disease. Individual components of small bowel mechanics such as peristaltic movement of the bowel wall, propulsion of chime, translocation of small bowel loops within the abdomen and pelvis, and movement in associated mesenteric and vascular structures are not considered as individual elements using this technique. All anatomical differentiation is ignored in the calculation of total voxel activity. This is clearly contrary to the method of investigation used to date to study highly selected individual components of small bowel function. However all of these elements form part of the response to the regulation of small bowel function through vagal and sympathetic innervation as well as hormonal control and therefore it is reasonable to argue that summating the effects of all of these elements ensures that the resulting metric is a true reflection of global small bowel activity. This metric has not previously been described and has no corollary in previous physiological studies. The metric has yet to be defined in terms of what constitutes a normal reference range.
One of the first questions to be addressed by the study is whether or not dynamic MR acquisitions of the whole abdomen can be acquired with a sufficient temporal frequency and without contamination of the data from movement in other systems, namely cardiovascular and urological. With cardiac gating this contamination of the dynamic data was controlled but the temporal resolution of dynamic small bowel MR is limited to the resting heart rate of the volunteer or patient. In this study this has decreased the maximal achievable temporal resolution, with the MR parameters used, to a mean of 1.15 frames/s. Given that the mean contraction frequency of small bowel motility is 10.96 per min (SD = ± 2.51/95% CI 6.04–15.88) (16, 31) this should be frequent enough to sample changes due to peristaltic changes without undersampling artefacts. This could be tested by reducing the length of the breath-hold acquisitions and looking for increasing variability in the data. If the data remain stable then this implies that the sampling is adequate. The volunteers in this study had resting heart rates that varied between 60 and 86 bpm. In young, very athletic, volunteers or in patients with bradycardia (e.g. those who are beta blocked) who have much lower resting pulse rates this may not be the case if they have a peristaltic frequency that is at the low end of the normal range.
Further questions about the technique include whether or not moving small bowel might be reliably identified and automatically isolated from other signal changes in the data. The very good inter-rater agreement, with narrow confidence intervals, in assessing the dynamic MR series suggests that the MR sequence used in this study might reliably be used to identify moving small bowel loops. It also appears that automated segmentation is able to isolate small bowel from other signal changes in the data-set (Fig. 4). There are some caveats. The results of the segmentation indicate that with increasing thresholds small bowel activity may be increasingly isolated from other signal changes such as large bowel movement and mesenteric vascular flow but that higher thresholds will segment out some of the small bowel data. This is partly explained by the matrix used to map the data and the criteria for scoring the correlation within each cell (Fig. 3). If even a single pixel was present within a cell that did not correspond to small bowel movement this was marked as an over-representation. This scoring system had the merit of being robust but lends itself to overestimating disparities. For the purpose of this proof of concept study the authors feel that this is an acceptable limitation.
Intra-muscular hyoscine injections were used to cause temporary small bowel paralysis. Any subsequent fall in TVA could then be attributed to the effect of hyoscine therefore supporting the assertion that TVA reflects a function of small bowel motility. The anti-muscarinic effects of the hyoscine injection produced substantial reductions in TVA (mean 62% reduction) in all five volunteers. However hyoscine may not have been the optimal aperistaltic agent to use in this study. It has been reported that paralysis of small bowel movement is more effective with glucagon and that hyoscine may not produce an aperistaltic effect in up to 50% of volunteers (32). The effect of the hyoscine would also have included inhibition of peristalsis in the stomach and colon however, because the periodicity of movement from these locations is unlikely to have contributed to the TVA, the reduction could be attributed to small bowel inhibition alone. This effect proves the concept that automated computational analysis of dynamic MR may be a means of providing a metric of global small bowel mechanical activity (Fig. 5).
The TVA is not simply limited to a mean value for each volunteer. Frequency polygons of slice-by-slice TVA provide semi-quantitative data about small bowel activity. The shape or profile of each polygon represents differences in distribution of small bowel activity. Sharp peaks indicate a lot of activity in a small area and broad-based humps indicate lower level activity involving greater lengths of small bowel (Fig. 6)
The number of volunteers in this study is small. Certainly the number is not large enough to get reliable data on what a normal reference range of small bowel motility might be. However that was not the aim of the study and as a feasibility or proof of concept study the small number is reasonable. Further studies to define a normal reference range are required. In these five healthy volunteers the range of TVA in the fasting state was three-fold from the lowest to the highest. These results, as pilot data, assuming 95% confidence intervals that are 10% on either side of the mean (33), would require a sample size of n = 56 to produce a reasonably accurate picture of the range of TVA in normal individuals. The sample in this study is not only small but is limited in age range and does not include women. Therefore a more appropriate course would be to perform a formal pilot of, for instance, 10 of each gender prior to formal sample size calculations.
Water was used to maximize signal from small bowel lumen and not as an oral contrast agent in the traditional sense. Detailed anatomical delineation of the small bowel lumen is not necessary for this technique indeed optimal luminal contrast enhancement with distension is arguably non-physiological and therefore not appropriate for the aim of this study. It may be that no contrast agent is required at all and indeed further studies describing the normal reference ranges of volunteers starved and after standardized meals will be required to build a complete picture of small bowel motility.
The potential for this technique is substantial. If reference ranges can be established then this will form the basis for the study of the effect systemic disease and ageing on small bowel mechanics. Little is understood about the effect of changes in small bowel motility and the effect that this has on the efficacy of drug absorption. An MR metric of global small bowel motility will allow the study of interactions between diet, ageing, and systemic disease, and the efficacy of pharmacological interventions.
In conclusion, this proof of concept study suggests that in principle it is possible to develop a new measure of small bowel peristalsis using dynamic MR that may lead to automated assessment of global small bowel peristaltic activity.