
Abstract
Background
T1-weighted gradient-echo in-phase and out-of-phase imaging is an essential component of comprehensive abdominal MR exams. It is useful for the study of fat-containing lesions and to identify various disease states related to the presence of fat in the liver.
Purpose
To compare three T1-weighted in-phase and out-of-phase (IP/OP) gradient-echo imaging sequences in an intra-individual fashion, and to determine whether advantages exist for each of these sequences for various patient types.
Material and Methods
One hundred and eighteen consecutive subjects (74 men, 44 women; mean age 53.9 ± 13.8 years) who had MRI examinations containing all three different IP/OP sequences (two-dimensional spoiled gradient-echo [2D-GRE], three-dimensional gradient-echo [3D-GRE], and magnetization-prepared gradient-recall echo [MP-GRE]) were included. Two different reviewers independently and blindly qualitatively evaluated IP/OP sequences to determine image quality, extent of artifacts, lesion detectability and conspicuity, and subjective grading of liver steatosis for the various sequences. Quantitative analysis was also performed. Qualitative and quantitative data were subjected to statistical analysis.
Results
Respiratory ghosting, parallel imaging, and truncation artifacts as well as shading and blurring were more pronounced with 3D-GRE IP/OP imaging. Overall image quality was higher with 2D-GRE (P < 0.05). Detectability of low-fluid content lesions was lower with IP/OP MP-GRE sequences. MP-GRE sequences had the lowest SNRs (P < 0.001). Liver-to-spleen and liver-to-lesion CNRs were significantly lower with 3D-GRE and MP-GR, respectively (P < 0.001). Fat liver indexes showed strongly positive correlation between all sequences.
Conclusion
Currently, 2D-GRE remains the best approach for clinical IP/OP imaging. The good image quality of MP-GRE sequences acquired in a free-breathing manner should recommend its use in patients unable to suspend breathing.
Pre-contrast T1-weighted information is important in abdominal studies (1). A critical modification of T1-weighted imaging is in-phase (IP) and out-of-phase (OP) imaging commonly used to identify various disease states related to the presence of fat in the liver, such as diffuse or focal steatosis (2,3). Signals from water and fat within the same voxel are additive on IP images and subtractive on OP images, allowing depiction of small amounts of fat as areas of low signal intensity. Concurrent acquisition of IP and OP echo times in a single data acquisition using multislice acquisition two-dimensional spoiled gradient echo (2D-GRE) has been available for several years and has become the standard sequence in use (4). In addition to the time sparing of simultaneous acquisition of IP and OP information, the sequence also acquires spatially matched slices, which facilitates evaluation of fat content in small structures such as small masses in the liver or small adrenal masses. Because of these advantages, although it has known limitations (5–7), IP/OP imaging technique has been incorporated in most abdominal protocols. A more recent modification of T1-weighted imaging that has been developed and optimized over recent years is IP/OP three-dimensional gradient echo (3D-GRE) sequences. Main advantages of 3D over 2D acquisitions have been contiguous slices with thinner section acquisitions and higher spatial resolution (8,9), while maintaining comparable image quality (10). Another modification of T1-weighted imaging has been single shot acquisition, generally termed magnetization-prepared gradient-recall echo (MP-GRE). Currently this is the preferred T1-weighted sequence in patients unable to suspend breathing (11–14). Although 3D-GRE IP/OP is in clinical use, to our knowledge its use has not been compared or validated against the standard 2D-GRE IP/OP sequence. Furthermore, no study has evaluated all three versions of rapid T1-weighted IP/OP sequences.
Thus the purpose of this study was to compare three GRE IP/OP imaging techniques in an intra-individual fashion, and to determine whether advantages exist for each of these sequences for various patient types.
Material and Methods
Patients
Institutional review board approval was obtained for this retrospective HIPAA-compliant study with waived informed consent.
The MRI database was searched for consecutive patients who underwent abdominal MRI studies between January 2010 and February 2010. The final study population included 118 consecutive subjects (74 men and 44 women; mean age ± standard deviation 53.9 ± 13.8 years). All subjects underwent a standard protocol including the three IP/OP sequences. The use of MRI was at the discretion of the referring physicians for all examinations.
The primary indications for imaging included: the evaluation of liver lesions (n = 9); screening for possible hepatocellular carcinoma (HCC) or cirrhosis surveillance (n = 54); evaluation of non-liver malignancy including post-surgical surveillance (n = 20); evaluation of renal lesions (n = 5); post-interventional treatment assessment of the liver including HCC evaluation (n = 6); post-liver transplantation surveillance (n = 3); post-interventional treatment assessment of malignancies other than liver (n = 6); evaluation of suspected biliary disease (n = 4); suspected or known pancreatitis (n = 4); evaluation of pancreatic masses (n = 3); evaluation of adrenal incidentalomas (n = 1); undetermined pelvic lesions (n = 1); and hemosiderosis (n = 2).
A total of 130 focal lesions (diameter range 0.5–11 cm) were found in 42 subjects, comprising 41 high fluid content lesions and 89 low fluid content lesions. Seventeen subjects had benign liver lesions (cysts [n = 10], regenerative nodules/low grade dysplastic nodule [n = 1], hemangioma [n = 5] and confluent fibrosis [n = 1]). Twenty-six subjects had malignant liver lesions (metastatic disease [n = 12], HCC [n = 8], post-treatment HCC following radiofrequency/microwave ablation [n = 5], and cholangiocarcinoma [n = 1]). One subject had an undetermined solid liver lesion. In two subjects, two different types of lesions were present (cysts and hemangioma in one, and a hemangioma and an undetermined lesion in another subject). Characterization of detected liver lesions was not part of the study design; this was, however, performed using standard MRI criteria (15).
MRI technique
All MR examinations were performed on 1.5-T MR systems (Avanto, Siemens Medical Solutions, Malvern, PA, USA) using a phased-array torso coil, and subjects underwent the following sequences: a half-Fourier single-shot turbo spin-echo T2-weighted sequence in the transverse and coronal planes, with and without fat suppression, pre-contrast IP/OP 2D and 3D breath-hold dual-echo GRE and 2D MP-GRE T1-weighted sequences in the transverse plane and post-contrast 3D-GRE T1-weighted sequences in the transverse plane. Post-contrast imaging was performed with power-injected (Medrad, Pittsburgh, PA, USA) bolus of 0.05 mmol/kg gadolinium chelate (MultiHance ®, Bracco Diagnostics, Princeton, NJ, USA) at 2 mL/s followed by a bolus 20 mL of saline flush in all subjects. The design for this current study was retrospective, as these sequences were not employed for the primary purpose of this study. The primary intention of employing 3D-GRE and MP-GRE together with 2D-GRE for a relatively short period was to assess ease of use by the technologist and tolerability by patients, and for general acceptability of image quality in the spectrum of patients imaged for abdominal diseases. The acquisition of sequences was at the discretion of the imaging technologist.
All subjects underwent a 2D T1-weighted spoiled gradient echo and a 3D gradient echo IP/OP dual echo sequences, in this order, followed by two separate IP and OP MP-GRE sequences. The MP-GRE acquisition was performed in a free-breathing manner without trigger and navigation techniques. The 2D and 3D GRE sequences were standard software of the system. The MP-GRE sequence was a work-in-progress sequence designed by the MR research team of manufacturer to the specifications of the principle investigator.
The motion-insensitive sequence, MP-GRE, used in this study was a 2D magnetization-prepared turbo-FLASH sequence, which begins with a 180° non-selective inversion pulse to initially prepare the longitudinal magnetization with T1 contrast. This is followed by a rapid train of low flip-angle slice-selective excitation pulses and gradient echo readouts, with the center of k-space being acquired a time TI (inversion time) after the inversion pulse. All of the phase-encoding lines for a given slice are acquired after a single inversion pulse with total echo-train duration of about 1 s, which is sufficiently short to avoid respiratory motion artifacts. Due to the fact that the inversion pulse is non-selective the sequence is not strictly a single-shot technique from a magnetization relaxation perspective, although because of the short readout duration it does behave like a single shot sequence in terms of motion artifacts. With MP-GRE, contrast is developed by applying a non-selective 180° inversion pulse before rapid GRE acquisition. The contrast characteristics of this sequence depend on, among other parameters, the effective TI and on the length of the magnetization recovery period. With the 3D-GRE sequences, contrast is developed in the same way as that of traditional 2D-GRE sequences and depends on the combination of the TR and the flip angle. The IP/OP 3D-GRE sequence is a 3D incoherent or spoiled steady state gradient-echo pulse sequence. Because the sequence is 3D the slices are contiguous (partition encoding) and interleaving is not possible, so the TR is on the order of 5 ms and the flip angle is approximately 10°. Within each TR two gradient echoes are acquired, one at the first opposed-phase echo time and one at the first in-phase echo time. In order to provide good “India ink” artifact on the opposed phase echo fat suppression is not utilized. We used parameters optimized by the vendor to maximize image quality on those differently designed sequences. Detailed parameters of IP/OP sequences are displayed in Table 1.
Detailed imaging parameters of 2D-GRE*, 3D-GRE†, and MP-GRE‡
*Two-dimensional spoiled gradient recalled echo is acquired as a dual echo acquisition
†Three-dimensional gradient recalled echo is acquired as a dual echo acquisition
‡Magnetization prepared gradient recalled echo are acquired as two separate two-dimensional acquisitions
§Echo spacing is defined as the time between two successive readouts
**Parallel imaging factor was GRAPPA (generalized autocalibrating partially parallel acquisitions)
††Time between applying the inversion pulse for each individual partition
TE, echo time; ES, echo spacing; TR, repetition time; TI, inversion time; all displayed in milliseconds (msec)
The order of the acquisitions was not expected to affect the comparison of the pre-contrast MR images.
Image analyses
Qualitative analyses
IP/OP sequences of all subjects were independently and retrospectively evaluated on a workstation by two experienced body radiologists (VH and RC with 5 years and 7 years of experience in abdominal MRI, respectively) to determine image quality, extent of artifacts, lesion detectability, and conspicuity, for the various sequences. For each data-set, both readers scored eight parameters of image quality. To avoid potential biases that could result from comparing different IP and OP sequences, the readings were separated between IP and OP sequences, i.e. session 1 comprised the IP sequences, whereas session 2 consisted of the analyses of OP sequences. A third session comparing IP and OP images was performed to evaluate liver steatosis. Prior to conducting the evaluation the two readers underwent a training data-set consisting of 10 subjects, and agreed on the interpretations and the scores for each of the evaluated parameters. This training data-set was not included in the study. The reviewers were blinded to the parameters of the sequences that they reviewed.
The reviewers graded images for the presence of artifacts (respiratory ghosting, spatial misregistration, pixel graininess, parallel imaging residual artifacts, and truncation artifacts as well as shading and blurring) using a 4-point scale: 1, severe; 2, moderate; 3, mild; and 4, minimal to absent.
Spatial misregistration was defined as non-conformity of slice position in each sequence and between sequences. Wraparound artifact at or near the center of the image as a result of parallel image acquisition (16,17) was described as parallel imaging residual artifacts. Shading was considered present when a gradation of non-uniformity of signal intensity was present across the image, predominantly along the phase encoding. Blurring was graded according to the definition and sharpness of liver, pancreas, and vessels edges.
Overall image quality was graded with a 5-point scale (1, poor; 2, fair; 3, good; 4, very good; and 5, excellent). The presence of spatial misregistration was not considered in the evaluation of overall image quality.
Confidence level of lesion detectability was performed and rated with a 5-point scale (1, not detected; 2, uncertain; 3, possible; 4, probable; and 5, definite). Lesions with confidence levels graded as 4 or 5 were defined as confidently detected. Lesion conspicuity was assessed by using the following considerations: overall evaluation of lesion visibility, margination and extent; and was rated with a 5-point scale (1, poor; 2, fair; 3, good; 4, very good; and 5, excellent). Both reviewers enumerated and evaluated for conspicuity lesions larger than 5 mm on both sets of images.
Sequences in which the scores used for the qualitative evaluation higher than 3 were considered as diagnostic.
Liver steatosis was suggested based on characteristic signal features (2,3), recognized as regions of liver that demonstrated a decrease in SI on OP images compared to IP images. The difference between IP and OP images was graded on a 4-point scale, ranging from 0 (IP SI equals OP SI), 1 (IP SI mildly greater than OP SI, and SI of the liver converges with the SI of the spleen), 2 (IP SI moderately greater than OP SI, with liver SI lower than SI of the spleen), and 3 (IP SI markedly greater than OP SI, with liver SI lower than SI of the spleen).
Quantitative analyses
All quantitative measurements were performed by the same reviewer. The mean SI of the liver (left and right lobes), spleen, pancreas, and renal cortex, and the standard deviation of the background noise (N) were obtained on all sequences using region of interest (ROI) measurements. ROI measurements were placed on homogeneous regions, devoid of vessels, lesions, and artifacts, and each SI value was measured twice, and the mean was calculated and used for the study. The ROIs were placed at anatomically matched or comparable locations on paired sequences by using a co-registration tool available on the PACS workstation. Measurements in MP-GRE sequences were placed in comparable slice positions as performed with 2D-GRE and 3D-GRE. Background noise measurements were performed from the entire region anterior to the anterior abdominal wall. The ROIs were placed in a similar position in every subject. ROIs were measured to be of the maximal size.
In subjects with more than one lesion, SI was obtained from the three largest lesions in the most homogeneous region. The region of interest was drawn to encompass as much of the lesion as possible. Only lesions more than 1 cm in diameter were included for quantitative evaluation in order to exclude any inaccuracies in signal intensity measurements that may have resulted from partial volume effect.
Signal-to-noise ratio (SNR) of the liver, spleen, pancreas, and renal cortex; and liver-to-spleen and liver-to-lesion contrast-to-noise ratio (CNR) were then calculated for 2D-GRE, 3D-GRE, and MP-GRE sequences as follows: SNR = SI/N; liver-to-spleen CNR = |(liver SI – spleen SI)/N|; liver-to-lesion CNR = |(liver SI – lesion SI)/N|. While the noise is spatially inhomogeneous due to both parallel imaging and also image normalization filters, by placing the ROIs in the same location on all images for a given subject, any spatial variation in the noise is the same for all sequences. Although the method has shortcomings, this may be sufficient for the purpose used in this study and is common practice. Furthermore, for sequences with parallel imaging with an acceleration factor of R = 2 (2D- and 3D-GRE sequences), this will result in a minimum decrease of the original SNR (18).
Since different sequences with different designs were compared using diverse parameters adjusted by the vendor, the purpose of the SNR and CNR measurements was not to provide absolute quantification of SNR and CNR, but rather to compare the various sequences in an attempt to explain imaging findings in the qualitative analysis for each of the three IP/OP techniques with parameters designed to maximize the quality of each sequence.
Quantitative measurements of the liver fat index were obtained in all subjects, and calculated as follows: [SI (IP)-SI (OP)]/SI (IP) (19).
The index of relative SI loss on OP was considered to be a reasonable measurement of liver fat on the basis of the known effect of fat on SI values, but was not considered to be a direct measurement of liver fat content.
Liver fat indexes calculations were compared between all sequences.
Statistical analyses
To assess inter-observer variability in image interpretation, weighted kappa statistics were used to measure the extent of agreement between the two interpreters (20). The statistical significance of the data from the qualitative analysis for image quality, lesion confidence and conspicuity, and visual grading of liver steatosis was compared using the Friedman two-way analysis of variance by ranks. Multiple-comparisons test was used as the post-hoc test. McNemar test was used to evaluate the statistical significance of lesion detection.
The SNRs of each organ were determined for each sequence and liver-to-spleen and liver-to-lesion CNRs were compared using ANOVA for correlated samples. If there were statistically significant differences among the sequences, post-hoc analysis was performed using the Tukey test for multiple comparisons.
Pearson correlation and regression analysis were used to evaluate the relationship between liver fat indexes measurements of the three IP/OP sequences. F-test was also used to perform analysis of variance.
In all cases, values of P < 0.05 were considered to be a statistically significant difference. All the statistical analyses were performed with MedCalc for Windows, version 11.3.0.0 (MedCalc Software, Mariakerke, Belgium).
Results
Kappa values for agreement between the two reviewers for the independent qualitative data analyses ranged from 0.42 to 1.0. In no case was a significant difference in rating observed between the readers. The average scores of all the qualitative parameters evaluated, including artifacts and overall image quality in 2D-GRE, 3D-GRE and MP-GRE acquisitions were considered in the diagnostic range, between good and excellent, and are displayed in Table 2. Respiratory ghosting was more pronounced in 3D-GRE compared with 2D-GRE, statistically significant on IP images (P < 0.05) although clearly in the diagnostic range. There were no significant differences between free breathing IP and OP MP-GRE and breath-hold 3D-GRE sequences. Spatial misregistration was only observed with MP-GRE images (P < 0.05). Pixel graininess was more apparent on MP-GRE compared with the other sequences (P < 0.05). Parallel imaging and truncation artifacts were also statistically more evident in 3D-GRE compared with 2D-GRE, and were minimal to absent in MP-GRE sequences. The degrees of shading and blurring were significantly higher on the 3D-GRE sequences (P < 0.05). Overall image quality achieved the highest scores with IP and OP 2D-GRE sequences (P < 0.05), nevertheless ratings for all sequences ranged between good and very good (Fig. 1).
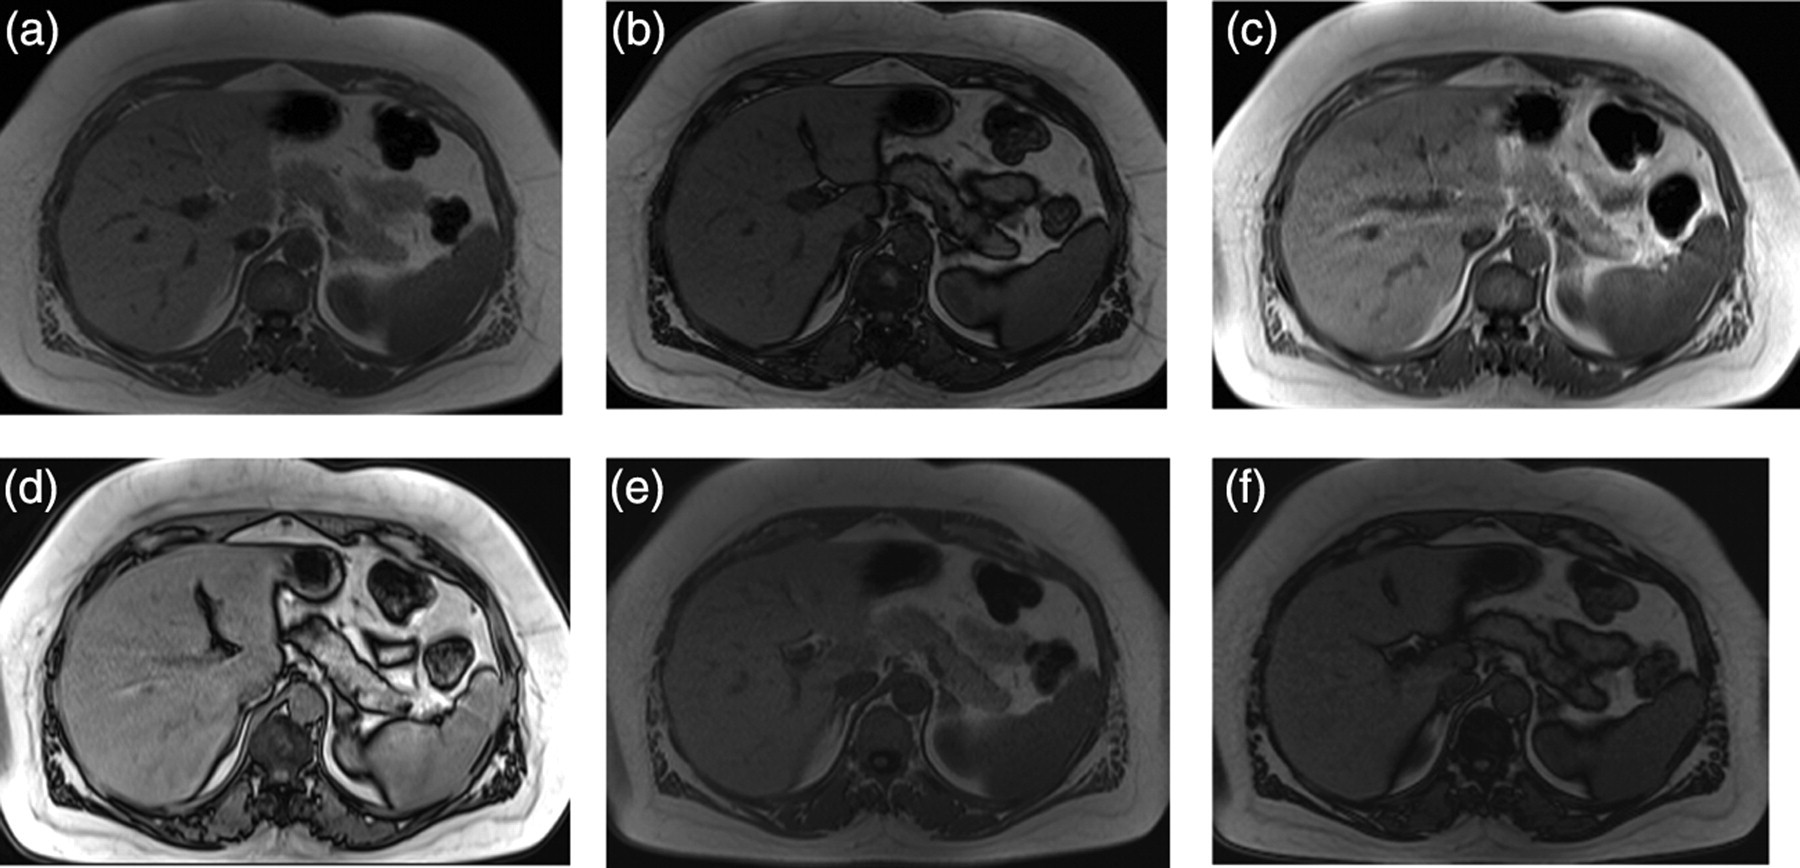
A 60-year-old woman with a history of breast cancer. T1-weighted in-phase (IP)/out-of-phase (OP) 2D-SGE (a, b), IP/OP 3D-GRE (c, d), IP/OP MP-GRE (e, f). All techniques demonstrate adequate IP/OP characteristics and image quality; nevertheless, 3D-GRE images exhibit more imaging artifacts. Moderate blurring, more pronounced on IP images, and parallel imaging residual artifacts are present in 3D-GRE images (arrows c, d). Note also that MP-GRE images (e, f) display excellent image quality, similar to 2D-SGE, despite being acquired in a free-breathing approach, recommending their use in patients unable to suspend respiration
Results of the qualitative analysis between 2D-GRE*, 3D-GRE†, and MP-GRE‡
*Two-dimensional spoiled gradient recalled echo
†Three-dimensional gradient recalled echo
‡Magnetization prepared gradient recalled echo
§Results were considered statistically significant if P <0.05
Qualitative data is expressed as mean ± standard deviation
NS, not significant; PIRA, parallel imaging residual artifacts; NA, not applicable
There were no significant differences between detectability, confidence, and conspicuity between sequences for benign high fluid content lesions. Regarding low fluid content lesions, the confidence level of detection was significantly lower with IP/OP MP-GRE compared with IP/OP 2D-GRE and IP/OP 3D-GRE (P < 0.05). The conspicuity of solid liver lesions was significantly higher with 2D-GRE compared with 3D-GRE (P < 0.05) (Table 3).
Assessment of liver lesion detectability, confidence, and conspicuity with 2D-GRE*, 3D-GRE†, and MP-GRE‡ sequences
*Two-dimensional spoiled gradient echo
†Three-dimensional gradient recalled echo
‡Magnetization prepared gradient recalled echo
McNemar test was used for statistical analysis for comparison of detectability
Friedman test was used for statistical analysis for comparison of confidence and conspicuity of lesions
Results were considered statistically significant if P <0.05
Detectability is expressed as total (Reviewer 1 + 2) number of lesions/number (percentage) of lesions graded 4 or 5 by subjective confidence
Confidence and conspicuity are expresses as mean values
Hepatic steatosis was visually recognized in 22 subjects. There were no differences in the number of subjects identified as having steatotic livers by the visual assessment of 2D-GRE, 3D-GRE, and MP-GRE images, except for one reviewer that did not consider one case of mild steatosis with MP-GRE. Lesser visual grading of liver steatosis was observed on MP-GRE compared to 2D-GRE and 3D-GRE (P < 0.05) (Fig. 2).
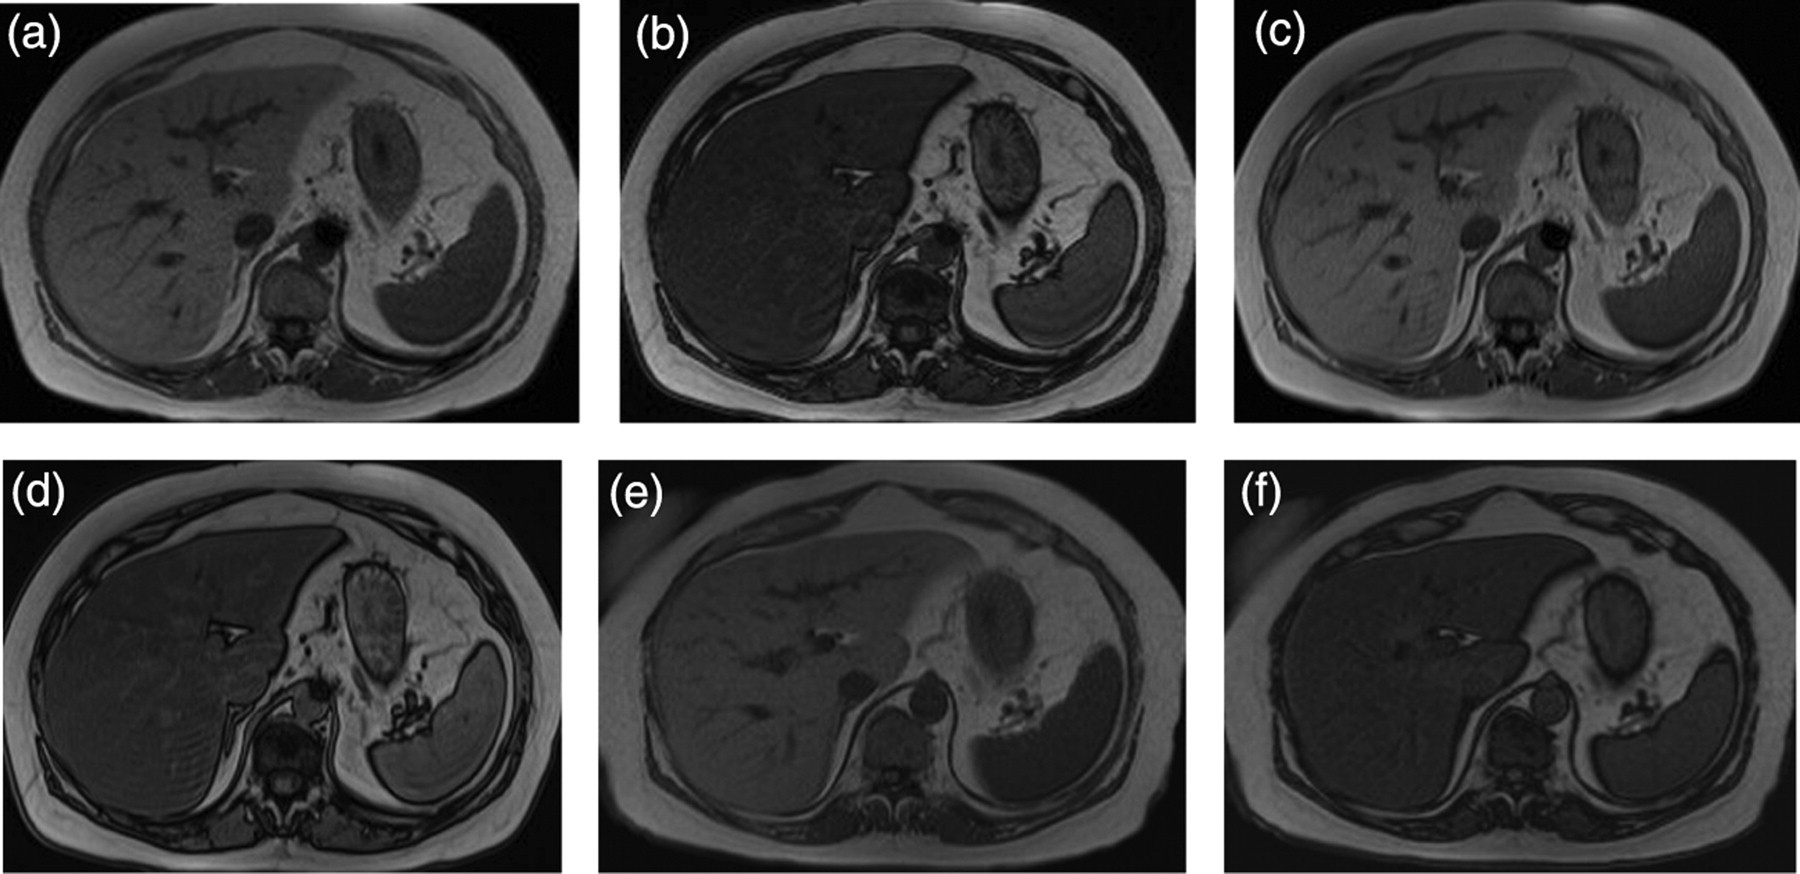
A 55-year-old man with suspected biliary disease. T1-weighted in-phase (IP)/out-of-phase (OP) 2D-GRE (a, b), OP 3D-GRE (c, d) and OP MP-GRE (e, f). Decrease in signal intensity (SI) on OP images is appreciated in all IP/OP imaging techniques. Using the spleen as comparator both 2D-GRE (b) and 3D-GRE (c) OP images demonstrate liver SI modestly lower than the SI of the spleen, and subjectively graded as a moderate fatty infiltration. OP MP-GRE images show that the SI of the liver converges with the SI of the spleen and graded as mild fatty infiltration of the liver. The nature of inversion recovery sequences, combined with the slightly different longitudinal relaxation times of the spleen and liver may account for this difference, suggesting that comparison of the liver and the spleen in OP images may be less reliable with MP-GRE sequences. Note the truncation artifact in the posterior liver and spleen on both the 2D-GRE and 3D-GRE sequences, which absent on the MP-GRE sequence
SNR values of liver and pancreas were found to be significantly higher with 2D-GRE. MP-GRE sequences demonstrated the lowest SNRs (P < 0.001). Liver-to-spleen CNRs were lower with 3D-GRE sequences, statistically significant on IP images (P < 0.001). Liver-to-lesion CNRs were significantly higher with 2D-GRE (P < 0.05), except for OP images which were comparable between 2D-GRE and 3D-GRE (Table 4).
Results of the quantitative analyses between 2D-GRE*, 3D-GRE†, and MP-GRE‡ sequences
*Two-dimensional spoiled gradient recalled echo
†Three-dimensional gradient recalled echo
‡Magnetization prepared gradient recalled echo
§Results were considered statistically significant if P <0.05
Quantitative data are expressed as mean ± standard deviation
NS, not significant
Pearson correlation coefficient of the calculated liver fat indexes of 2D-GRE vs. 3D-GRE (r = 0.96 [P < 0.0001, 95% CI 0.94–0.97]), 2D-GRE vs. MP-GRE (r = 0.91; [P < 0.0001, 95% CI 0.87–0.93]) and 3D-GRE vs. MP-GRE (r = 0.91; [P < 0.0001, 95% CI 0.86–0.93]) for all subjects was strongly positively correlated. Effects of both the intercept and slope were statistically significant between 2D-GRE vs. 3D-GRE (slope, 0.91 [P < 0.0001, 95% CI 0.86–0.96]; intercept, 0.02 [P < 0.0001, 95% CI 0.01–0.02]), 2D-GRE vs. MP-GRE (slope, 0.79 [P < 0.0001, 95% CI 0.71–0.84]; intercept, 0.14 [P < 0.0001, 95% CI 0.13–0.15]) and 3D-GRE vs. MP-GRE (slope, 0.81 (P < 0.0001, 95% CI 0.74–0.88]; intercept, 0.12 [P < 0.0001, 95% CI 0.11–0.13]) (Fig. 3). The significance level for the analysis of variance (F-test) was small (P < 0.001) for all comparisons.
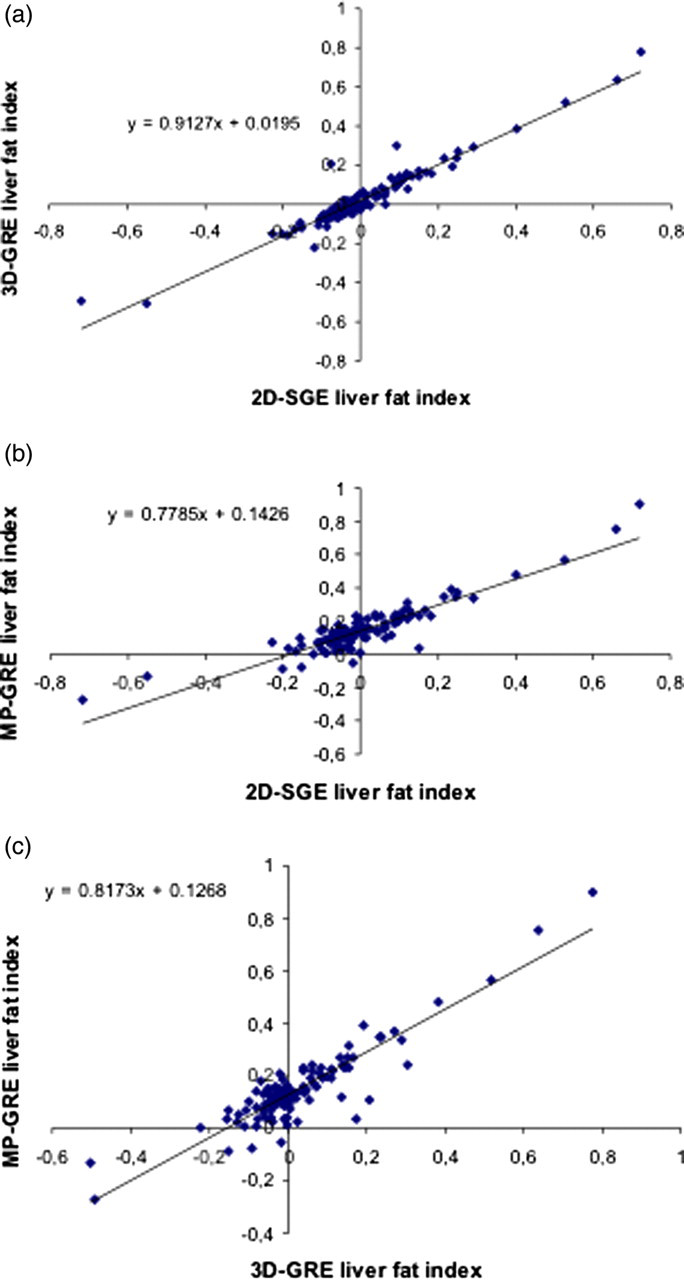
Scatterplot of liver fat indexes obtained with 2D-GRE, 3D-GRE, and MP-GRE sequences. Each point in the scatterplot represents the values of two variables for a given observation. There is a strongly positive correlation between calculated liver fat indexes of 2D-GRE vs. 3D-GRE (r = 0.96, P <0.001) (a), 2D-GRE vs. MP-GRE (r = 0.91, P < 0.001) (b), and 3D-GRE vs. MP-GRE (r = 0.91, P < 0.001) (c). We conclude that there is a possible association between liver fat indexes calculated on 2D-GRE, 3D-GRE, and MP-GRE
Discussion
A major strength of MRI is the consistently evolving capacity of the modality to generate new types of information. Development frequently outpaces the ability to evaluate the impact of these innovations in clinical practice. One example of this is that IP/OP 3D-GRE has not been evaluated against the traditional 2D-GRE to date despite its availability for at least 2 years. The same certainly can be said for IP/OP MP-GRE recently developed to overcome a shortcoming in MR imaging, which has been the assessment of the presence of fat with IP/OP imaging in patients unable to suspend respiration. This current study was intended to evaluate all three rapid IP/OP T1-weighted techniques against each other using parameters optimized by the vendor. Our rationale to employ the original parameters for the different sequences was to potentiate the best clinical image quality for each type of IP/OP technique. Altering parameters in order to compensate any differences between sequences or in another words trying to make a more “fair” comparison would not maximize image quality for each IP/OP technique, which in our perspective would not allow the comparison in their theoretically full potential. One previous report from Kim MJ et al. (10) comparing the image quality between an IP and OP 2D-GRE sequence with a fat-suppressed 3D-GRE, found no significant differences in image quality between sequences. Although 3D-GRE provides improved spatial resolution with contiguous and thinner slices and higher signal-to-noise ratio (21), our study showed higher image quality of IP/OP 2D-GRE and IP/OP MP-GRE compared with IP/OP 3D-GRE. Our opinion for the higher image quality of MP-GRE, when compared to earlier reports (11–14,22), may be related to recent hardware developments and software optimization (23). This is especially important since this sequence is acquired in a free-breathing manner allowing IP/OP technique in patients unable to cooperate with breath-hold issues. Respiratory triggering and navigation are routinely used in abdominal studies for T2-weighted imaging. These techniques are most effective and useful for long TR imaging (typically T2-weighted imaging) where the normal variations in the respiratory cycle will not significantly affect the signal. Also, the triggering and navigation techniques in common use tend to greatly disturb the steady state magnetization characteristically achieved with T1-weighted imaging, which can explain their ineffectiveness with volumetric 2D- and 3D-spoiled GRE T1-weighted imaging.
Possible explanations for lower overall image quality of 3D-GRE include lesser T1-weighting expressed by the lower liver-to-spleen CNRs and more severe respiratory ghosting artifact as well as parallel imaging residual artifacts and truncation artifacts, although ultimately image quality was still considered within the diagnostic range. It should be noted, however, that the acceleration factor used was identical to that employed with the 2D-GRE. MP-GRE sequences have a lower SNR, which is reflected in the two averages and no use of parallel imaging acceleration.
Although 3D-GRE sequences provided better spatial resolution, there was increased image blurring, and in combination with slightly greater motion sensitivity, may have aggravated the ratings for the presence of motion artifacts. The subjects studied, however, represented a diverse range of compliance and cooperation that would be most reflective of actual clinical practice generalized to all centers.
All three sequences detected the same number of high fluid content lesions, with significant differences found only for low fluid content lesions. Interestingly, the higher spatial resolution of 3D-GRE did not result in a higher number of detected lesions compared to 2D-GRE, which may be explained by the fact that only lesions with more than 5 mm of diameter were evaluated. Significantly higher conspicuity was observed in 2D-GRE for low fluid content lesions, which may be related to the higher liver-to-lesion CNRs and lesser vulnerability to image artifacts observed with 2D-GRE sequence. This differs from previous reports where comparisons were made between 2D-GRE and 3D-GRE sequences (10), although these prior studies did not employ IP/OP 3D-GRE. MP-GRE detected fewer low fluid content lesions in both IP and OP sequences compared with multislice 2D-GRE and 3D-GRE. Possible explanations for the fewer number of lesions detected with MP-GRE include the significantly higher pixel graininess due to the intrinsic lower SNR of the sequence (11), the significantly lower liver-to-lesion CNR and the single-shot nature of the sequence, acquired in a free-breathing approach, with expected gaps and spatial misregistration.
In our study, the detectability of low fluid content lesions on OP sequences was lower than with IP equivalent. This finding is congruent with earlier reports in the literature (24,25) and likely reflects that in the presence of fatty liver, liver-to-lesion CNR is diminished on OP, and may be heightened on IP sequences, since most lesions are mildly or moderately low in signal intensity on T1-weighted sequences. In our study, 10 subjects with liver lesions had concomitant steatosis, based on calculated liver fat indexes and visual inspection.
OP images showed consistently higher rankings regarding overall image quality compared with IP images. This finding has not been previously described in the literature. It may be related to the better edge definition of the OP images given by the cancellation artifact along the contour of the organs, which might result in slightly lesser perception of respiratory motion and blurring of the abdominal structures.
Differences in the qualitative grading of the extent of fatty infiltration suggest greater visualization of fat content on 2D-GRE and 3D-GRE sequences. The scoring system used a visual signal comparison between the liver and the spleen. The nature of inversion recovery sequences, combined with the slightly different longitudinal relaxation times of the spleen and liver may in part explain this difference, suggesting that comparison to spleen may be less reliable in MP-GRE sequences. The estimation of liver steatosis, either by the fat index or by the visual scoring of the signal drop in OP should not be considered a direct measurement of liver fat content. The calculated liver fat indexes in steatotic and non-steatotic livers had a strongly positive correlation between sequences with slopes not equal to 1, suggesting a systematic difference in liver fat index calculations. This is likely due to the intrinsic differences in the parenchyma contrast between the different sequences. These findings suggest that liver fat index calculations are not exchangeable between sequences. Prospective studies comparing the three IP/OP imaging techniques against a standard of reference for assessment of liver fat content are advised, in order to validate the accuracy and reproducibility of liver fat content estimation in different types of sequences.
There are some limitations of our study. One limitation includes the retrospective design of the study. Another limitation is that different techniques were evaluated. Our overall intention was to compare the image quality of different IP/OP sequence types, each with the theoretically optimized parameters for maximizing image quality. Another limitation is that different levels of optimization are anticipated. The 2D version of IP/OP is a well-established and optimized sequence with several years in clinical practice, whereas IP/OP 3D and 2D MP-GRE are relatively new techniques. A further limitation is that we used different slice thickness for the 2D-GRE and MP-GRE and for the 3D-GRE acquisitions. This ought to have improved the visualization of ultra-small lesions (<5 mm) at 3D-GRE, however this was not specifically investigated. An additional limitation is that no accurate standard for liver fat content was used. Nevertheless our intention was to evaluate IP/OP 3D-GRE and MP-GRE sequences, with comparison to the IP/OP sequence that is common usage, and accepted as a reliable tool, a dual-echo 2D-GRE and to assess an eventual correlation between fat index calculations between these techniques.
In conclusion, with current stage of development, traditional 2D-GRE is still the best approach to IP/OP imaging when respiratory motion is not a factor and high resolution is not essential. The good image quality of MP-GRE sequences acquired in a free-breathing manner should recommend its use in patients unable to suspend breathing.