
Abstract
Background
Up to about one-quarter of patients treated with neoadjuvant chemotherapy do not adequately respond to the given treatment. By a differentiation between responders and non-responders ineffective toxic therapies can be prevented.
Purpose
To retrospectively test if FDG-PET/CT is able to early differentiate between breast cancer lesions with pathological complete response (pCR) and lesions without pathological complete response (npCR) after two cycles of neoadjuvant chemotherapy (NACT).
Material and Methods
In this retrospective study 26 breast cancer patients (mean age, 46.9 years ± 9.9 years) underwent a pre-therapeutic FDG-PET/CT scan and a subsequent FDG-PET/CT after the second cycle of NACT. Histopathology of resected specimen served as the reference standard. Maximum standardized uptake values (SUVmax) of cancer lesions before and after the second cycle of NACT were measured. Two evaluation algorithms were used: (a) pCR: Sinn Score 3 and 4, npCR: Sinn Score 0–2; (b) pCR: Sinn Score 4, npCR: Sinn Score 0–3. The absolute and relative decline of the SUVmax (ΔSUVmax, ΔSUVmax(%))was calculated. Differences of the SUVmax as well as of the SUVmax decline between pCR lesions and npCR lesions were tested for statistical significance P < 0.05. To identify the optimal cut-off value of ΔSUVmax(%) to differentiate between pCR lesions and npCR lesions a receiver-operating curve (ROC) analysis was performed.
Results
Using evaluation algorithm A the ΔSUVmax was 13.5 (pCR group) and 3.9 (npCR group) (P = 0.006); the ΔSUVmax(%) was 79% and 47%, respectively (P = 0.001). On ROC analysis an optimal cut-off ΔSUVmax(%) of 66% was found. Using evaluation algorithm B the ΔSUVmax was 17.5 (pCR group) and 4.9 (npCR group) (P = 0.013); the ΔSUVmax(%) was 89% and 51%, respectively (P = 0.003). On ROC analysis an optimal cut-off ΔSUVmax(%) of 88% was found.
Conclusion
FDG-PET/CT may be able to early differentiate between pCR and npCR of primary breast cancer lesions after two cycles of NACT.
Neoadjuvant chemotherapy (NACT) consists of a combination of chemotherapy, endocrine therapy and targeted therapy and presents a commonly applied approach in the therapy of (locally advanced) primary breast cancer lesions (1–4). Nowadays NACT is performed in order to reduce the tumor mass preoperatively to ensure breast-conserving surgery (1–3). Up to about one-quarter of patients treated in a neoadjuvant setting do not adequately respond to common NACT regimens (3). By an early-as-possible differentiation between responders and non-responders ineffective toxic therapies with side-effects such as nausea, alopecia, hematological toxicity, neurotoxicity, or cardiotoxicity can be prevented, costs can be saved and therapeutic concepts can be changed (3, 5–8). This neoadjuvant strategy translates into a prolonged survival of breast cancer patients (5, 9). It is therefore crucial to assess the response to NACT as early as possible. Physical examination, however, is often unreliable to assess the therapeutic response (2). Morphologic imaging methods like mammography, breast ultrasound as well as breast magnetic resonance imaging (MRI) suffer from only limited sensitivity for the evaluation of therapeutic response, which is pronounced by their reliance on changes in physical tumor volume (2, 7, 10–13). The image-based measurement of tumor size as an indicator of clinical response is often different from the true histopathological extent of disease (4, 9). Morphological methods, for example, may not reliably distinguish between fibrotic scar tissue and viable tumor cells; the accuracy is hampered by the well-known delay between chemotherapy response and tumor shrinkage (7). In addition it may be difficult to differentiate between viable tumor cells and not tumor-associated changes such as inflammatory reactions or edema (9, 14–16). Thus, many authors conclude that conventional anatomical imaging modalities have limited accuracy in predicting therapy response at an early stage of treatment (7, 17–19). These disadvantages can be overcome by functional imaging techniques such as 18F-fluoro-deoxyglucose positron emission tomography/computed tomography (FDG-PET/CT), which can detect subclinical alterations in tumor physiology and biochemistry due to efficient therapy non-invasively (5, 20, 21). It has been shown that the decrease of intratumoral glucose metabolism is positively correlated with pathological response (9, 22–24). There are several studies published in the recent literature that indicate the superior diagnostic value of FDG-PET/(CT) for the evaluation of a NACT assessment in breast cancer patients (7–9, 22).
The aims of our study were: (a) to determine whether FDG-PET/CT is able to reliably predict a pathological complete response (pCR) in breast cancer patients according to the histopathological semiquantitative scoring system developed by Sinn et al. (1) at an early time point after two cycles of NACT; (b) to assess whether FDG PET/CT is able to differentiate pCR from patients with non-pathological complete tumor response (npCR); and (c) to determine the optimal cut-off for the relative decline of the maximum standardized uptake value (ΔSUVmax(%)) for this differentiation.
Material and Methods
Between September 2008 and July 2010 26 female breast cancer patients (mean age 46.9 years; range 28.3–75.4 years; standard deviation [SD], 9.9 years) underwent a pre-therapeutic FDG-PET/CT scan and a subsequent FDG-PET/CT scan of the breasts after the second cycle of NACT. Histopathology of resected specimen after the end of NACT (at the time of definite surgical treatment) served as the reference standard to differentiate between pCR and npCR lesions (1). In this study two evaluation algorithms were used: (a) evaluation algorithm A: pCR: score 3 and 4 according to Sinn, npCR: score 0–2 according to Sinn (25); and (b) evaluation algorithm B: pCR: score 4 according to Sinn, npCR: score 0–3 according to Sinn.
For a detailed overview over the histopathological subtype, the T stage, the N stage, the regression score according to Sinn, the neoadjuvant agents in use as well as the grading and expression of receptors (Table 1). The study was performed in accordance with the regulations of the local ethics committee and federal laws.
Histopathological subtypes, T and N stage, regression scores, neoadjuvant drugs in use, as well as histopathological grading and expression of receptors of breast cancer lesions
B, Bevacizumab; CP, Carboplatin; CY, Cyclophosphamide; D, Docetaxel; DOX, Doxorubicin; E, Epirubicin; ER, estrogen receptor; HER2/neu, human epidermal growth factor receptor 2; IDC, infiltrating ductal carcinoma; ILC, infiltrating lobular carcinoma; IMPC, infiltrating micro-papillar carcinoma; ITLC, infiltrating tubula-lobular carcinoma; L, Lapatinib; Le, Letrozol; NACT, neoadjuvant chemotherapy; P, Paclitaxel; pCR A, pathologic complete response according to evaluation algorithm A; pCR B, pathologic complete response according to evaluation algorithm B; PgR, progesterone receptor; Sinn score, Pathologic regression score according to Sinn; T pre/post NACT, tumor stadium prior/after NACT; TRA, Trastuzumab; Z, Zoledronic acid
Whole-body FDG-PET/CT
Before treatment all examinations were performed as full-dose, contrast-enhanced, whole-body FDG-PET/CT scans. All patients had to fast for a minimum of 6 h before FDG injection. Before FDG injection the blood glucose level was ensured to be at a level below 150 mg/dL. An intravenous application of 270 ± 40 MBq of FDG (210–360 MBq) was performed. A total of 1000 mL of a water-based oral contrast agent was applied for bowel marking during the 1 h FDG uptake time (26). Imaging was started 60 min after the intravenous application of FDG beginning with the CT scan, followed by the PET scan, covering an area from the skull base to the upper thighs. Eleven patients were scanned on a dual-slice biograph™ PET/CT (Siemens Molecular Imaging; Hoffmann Estates, IL, USA) and 16 patients were scanned on a mCT™ PET/CT system (Siemens Molecular Imaging; Hoffman Estates, IL, USA) after application of intravenous contrast material. Procedural and technical data for both scanners were: (a) dual-slice biograph™ PET/CT: CT: 100 mA/s; 130 kV; 140 mL iodinated intravenous contrast material (Xenetix 300™; Guerbet, Sulzbach, Germany); contrast material injection by an automated injector (XD 5500™; Ulrich Medical Systems, Ulm, Germany); biphasic injection technique (flow rate of 3 mL/s for the first 90 mL and 1.5 mL/s for the following 50 mL); start delay, 50 s; slice thickness, 5 mm; increment, 2.4 mm. PET: mode: 3D; emission time: 3.5 min per bed position; image reconstruction: iterative algorithms (FORE and AWOSEM, non-linear); 2 iterations; 8 subsets; filter: FWHM 5.0 mm; scatter correction; (b) mCT™, 210 mA/s; 120 kV; automatic dose modulation (CareDose™); 100 mL iodinated intravenous contrast material (Xenetix 300™, Guerbet, Sulzbach, Germany); contrast material injection by an automated injector (Stellant™ D CT Injection System, Medrad, Düsseldorf, Germany); monophasic injection technique (flow rate of 2 mL/s); start delay, 70 s; slice thickness, 5 mm; increment, 5.0 mm. PET: mode, 3D; emission time, 2.0 min per bed position; image reconstruction: iterative algorithms (FORE and AWOSEM, non-linear); 4 iterations; 8 subsets; filter: FWHM 4.0 mm; scatter correction.
Twelve days (range 1–28 days; SD 6 days) after the end of the second cycle of NACT 22 patients underwent a low dose FDG-PET/CT of the breasts using the following PET/CT parameters: PET parameters: same as in full dose protocol; CT parameters: dual-slice biograph™ PET/CT: CT, 15 mA/s; 110 kV; slice thickness, 5 mm; increment, 2.4 mm; mCT™, 15 mA/s; 120 kV; slice thickness, 5 mm; increment, 5.0 mm. Four patients were examined with a full dose PET/CT on the mCT™ PET/CT system (Siemens Molecular Imaging; Hoffman Estates, IL, USA).
Image analysis
An AW Suite™ 5.5.3e Volume viewer plus™ Workstation (GE Healthcare, Munich, Germany) was used for image evaluation. This workstation was connected to a picture archiving and communication system (PACS) workstation (GE Healthcare, Munich, Germany). The FDG-PET/CT data were analyzed by a radiologist and a nuclear medicine physician (each with more than 5 years of experience in reading FDG-PET/CT scans). The maximal standardized uptake value (SUVmax) of the breast cancer was determined before NACT and after two cycles of NACT by a region of interest (ROI) measurement using the toolbox of the Volume viewer plus™ Workstation (GE Healthcare, Munich, Germany).
Gold standard
Histopathological findings after completion of NACT served as the gold standard. According to the guidelines of the German Society of Senology histopathological work-up of resected specimens was performed (27). The tumor regression grade was determined according to the score of Sinn, a common classification system in the evaluation of tumor response and the estimation prognoses in patients undergoing NACT (28) (AGO (Arbeitsgemeinschaft Gynäkologische Onkologie = committee of gynecological oncology). Histopathological regressive changes after NACT were classified semi-quantitatively according to Sinn: 0 = no effect, 1 = resorption and tumor sclerosis, 2 = minimal residual invasive tumor (<0.5 cm), 3 = residual non-invasive tumor only, 4 = no tumor detectable (1). A Sinn score of 4 was assumed if no vital invasive, intraductal, intravascular, or lymphonodal tumor cells in the completely embedded area of tumor sclerosis or at least 15 standard paraffin blocks of larger areas of tumor sclerosis were detected.
Statistical analysis
SUVmax of all breast cancer lesions were measured before NACT and after the second cycle of NACT. If there was a patient with a multifocal or multicentric mammarian lesion the lesion with the highest SUVmax was measured. According to histopathology all lesions were judged as pCR or npCR lesions.
The following tests were performed (each for evaluation algorithms A and B):
Minimum, maximum, mean SUVmax as well as standard deviations (SD) for both the pCR and the npCR group. SUVmax measurements before and after NACT were tested for statistical significance between both groups using the Mann-Whitney-U-test (P < 0.05); The absolute and relative decline of the SUVmax (ΔSUVmax, ΔSUVmax(%)) between the time point before therapy and after the second cycle of NACT were calculated both in the pCR group and in the npCR group. ΔSUVmax(%) was calculated as follows: ΔSUVmax(%)= 100x (SUVmax before NACT – SUVmax after NACT) / SUVmax before NACT. The amount of the decline of the SUVmax and ΔSUVmax(%) was tested for statistically significant differences between the pCR and the npCR group using the Mann-Whitney-U-test (P < 0.05); A receiver-operating curve (ROC) analysis was performed to determine the optimal ΔSUVmax(%) to differentiate between pCR and npCR lesions.
Results
According to the semiquantitative histopathological scoring system from 0 to 4, two patients showed a tumor regression score of 0 (Fig. 1), 10 patients had a score of 1, six patients had a score of 2, four patients had a score of 3, and four patients had a score of 4 (Fig. 2). Therefore, eight lesions in four patients were classified as pCR, whereas 18 lesions in 22 patients were classified as npCR lesions. The SUVmax in the pre-therapeutic FDG-PET/CT scan of all lesions together was 9.7 (range 1.3–32.8; SD 7.9). The FDG-PET/CT scan after two cycles of NACT of all lesions showed a mean SUVmax of 2.9 (range 1.0–12.4; SD 2.3). The mean ΔSUVmax was 6.8 (range 0.0–30.9; SD, 7.6). The mean ΔSUVmax(%) was 57% (range 7–94%; SD 27%)
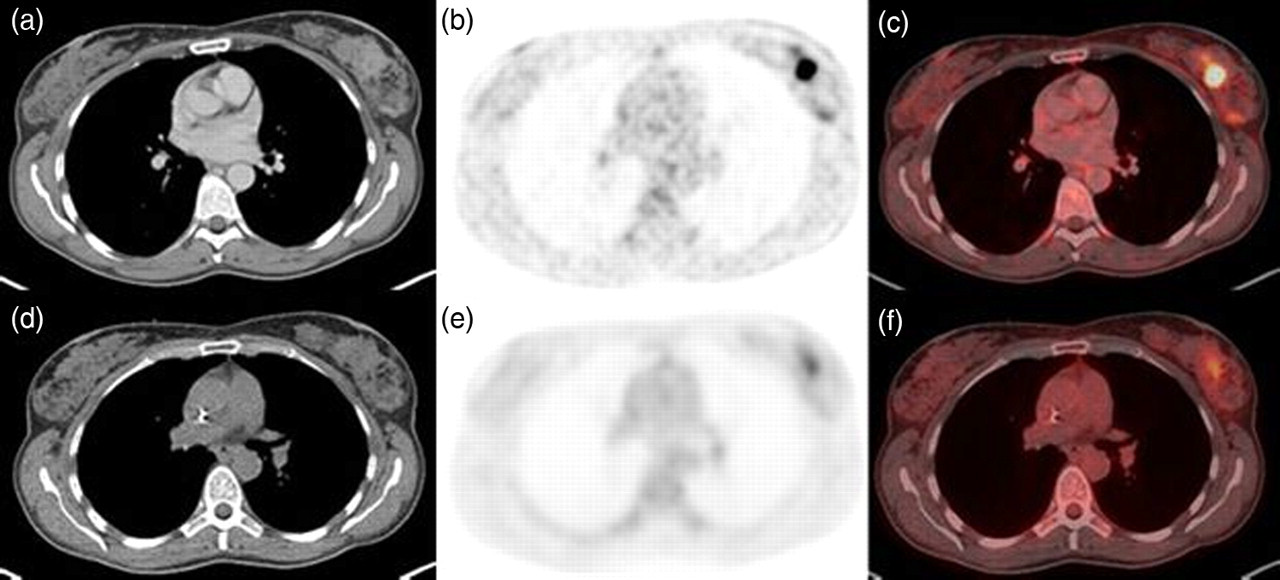
A 48-year-old woman suffering from a micropapillar breast cancer in the left breast before (axial CT [a], FDG-PET [b], and fused FDG-PET/CT [c], SUVmax 10.6) and after NACT (axial CT [d], FDG-PET [e], and fused FDG-PET/CT [f], SUVmax 3.7). There was a relevant decrease of the ΔSUVmax of 6.9 (ΔSUVmax(%): 65.1%); the tumor regression score according to Sinn was 0

A 44-year-old woman suffering from an infiltrating ductal carcinoma in the left breast (cT2 pN1 M0) before NACT (axial CT [a], FDG-PET [b], fused FDG-PET/CT [c], SUVmax 23.9) and after the second cycle of NACT (axial CT [d], FDG-PET [e], fused FDG-PET/CT [f], SUVmax 2.1). There was a ΔSUVmax of 21.8 (ΔSUVmax(%): 91.2%) the tumor regression score according to Sinn was 4 (= pathological complete response)
For evaluation algorithms A and B the following results were acquired:
Evaluation algorithm A:
The mean SUVmax of the pCR lesions in the pre-therapeutic FDG-PET/CT scan was 15.9 (range 3.0–32.8; SD 9.6). The mean SUVmax of the npCR lesions in the pre-therapeutic FDG-PET/CT scan was 7.0 (range 1.3–19.4; SD 5.3). This difference was statistically significant (P = 0.008) (Fig. 3); The mean SUVmax of the pCR lesions in the FDG-PET/CT scan after the second cycle of NACT was 2.4 (range 1.3–6.6; SD 1.7). The mean SUVmax of the npCR lesions in the FDG-PET/CT scan after the second cycle of NACT was 3.1 (range 1.0–12.4; SD 2.6). This difference was not statistically significant (P = 0.374) (Fig. 3); The absolute decline of the SUVmax between the time point before and after the second cycle of NACT of the pCR lesions was 13.5 (range 1.0–30.9; SD 9.3). The absolute decline of the SUVmax between the time point before and after the second cycle of NACT of the npCR lesions was 3.9 (range 0.0–15.9; SD 4.4). This difference was statistically significant (P = 0.006) (Fig. 3). The relative decline of the SUVmax% between the time point before and after the second cycle of NACT of the pCR lesions was 79% (range 33–94%; SD 20%). The relative decline of the SUVmax% between the time point before and after the second cycle of NACT of the npCR lesions was 47% (range 7–83%; SD 23%). This difference was statistically significant (P = 0.001) (Fig. 3); The ROC analysis showed a ΔSUVmax(%) of 66% to be the best threshold to differentiate pCR and npCR after two cycles of NACT. At this level of ΔSUVmax(%) the sensitivity, specificity, the NPV, PPV, and accuracy was 88%, 89%, 94%, 88%, and 92%, respectively. Evaluation algorithm B:
The mean SUVmax of the pCR lesions in the pre-therapeutic FDG-PET/CT scan was 19.2 (range 9.2–32.8; SD 11.2). The mean SUVmax of the npCR lesions in the pre-therapeutic FDG-PET/CT scan was 8.0 (range 1.3–23.9; SD 5.9). This difference was statistically significant (P = 0.023) (Fig. 4); The mean SUVmax of the pCR lesions in the FDG-PET/CT scan after the second cycle of NACT was 1.7 (range 1.3–2.1; SD 0.4). The mean SUVmax of the npCR lesions in the FDG-PET/CT scan after the second cycle of NACT was 3.1 (range, 1.0–12.4; SD 2.5). This difference was not statistically significant (P = 0.126) (Fig. 4); The absolute decline of the SUVmax between the time point before and after the second cycle of NACT of the pCR lesions was 17.5 (range 9.6–30.9; SD 10.9). The absolute decline of the SUVmax between the time point before and after the second cycle of NACT of the npCR lesions was 4.9 (range 0.0–15.9; SD 5.1). This difference was statistically significant (P = 0.013) (Fig.4); The relative decline of the SUVmax% between the time point before and after the second cycle of NACT of the pCR lesions was 89% (range 84–94%; SD 4%). The relative decline of the SUVmax% between the time point before and after the second cycle of NACT of the npCR lesions was 51% (range 7–88%; SD 25%). This difference was statistically significant (P = 0.003) (Fig. 4); The ROC analysis showed a ΔSUVmax(%) of 88% to be the best threshold to differentiate pCR and npCR after two cycles of NACT. At this level of ΔSUVmax(%) sensitivity, specificity, the NPV, PPV, and the accuracy was 75%, 100%, 95%, 75%, and 92%, respectively.
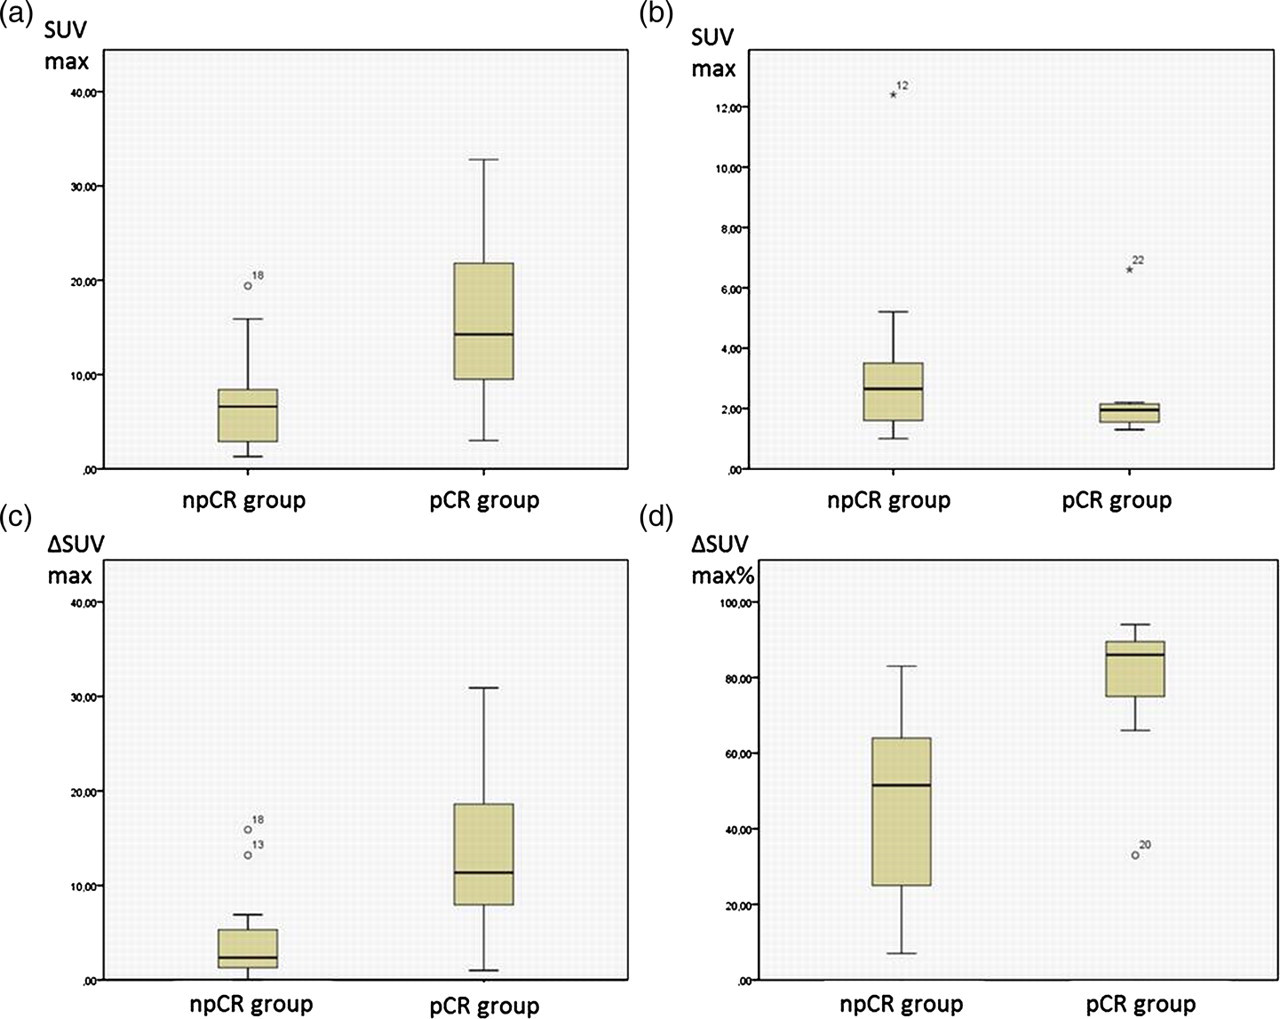
Evaluation algorithm A: Differences of the SUVmax of pCR and npCR lesions did show a statistically significant difference before (a, P = 0.008) and no statistically significant difference after the second cycle of NACT (b, P = 0.374). The absolute decrease of the SUVmax of pCR lesions, however, was statistically significantly higher than that of npCR lesions (c, P = 0.006). The relative decrease (ΔSUVmax(%)) was also statistically significantly higher in the pCR group compared to the npCR group (d, P = 0.001)
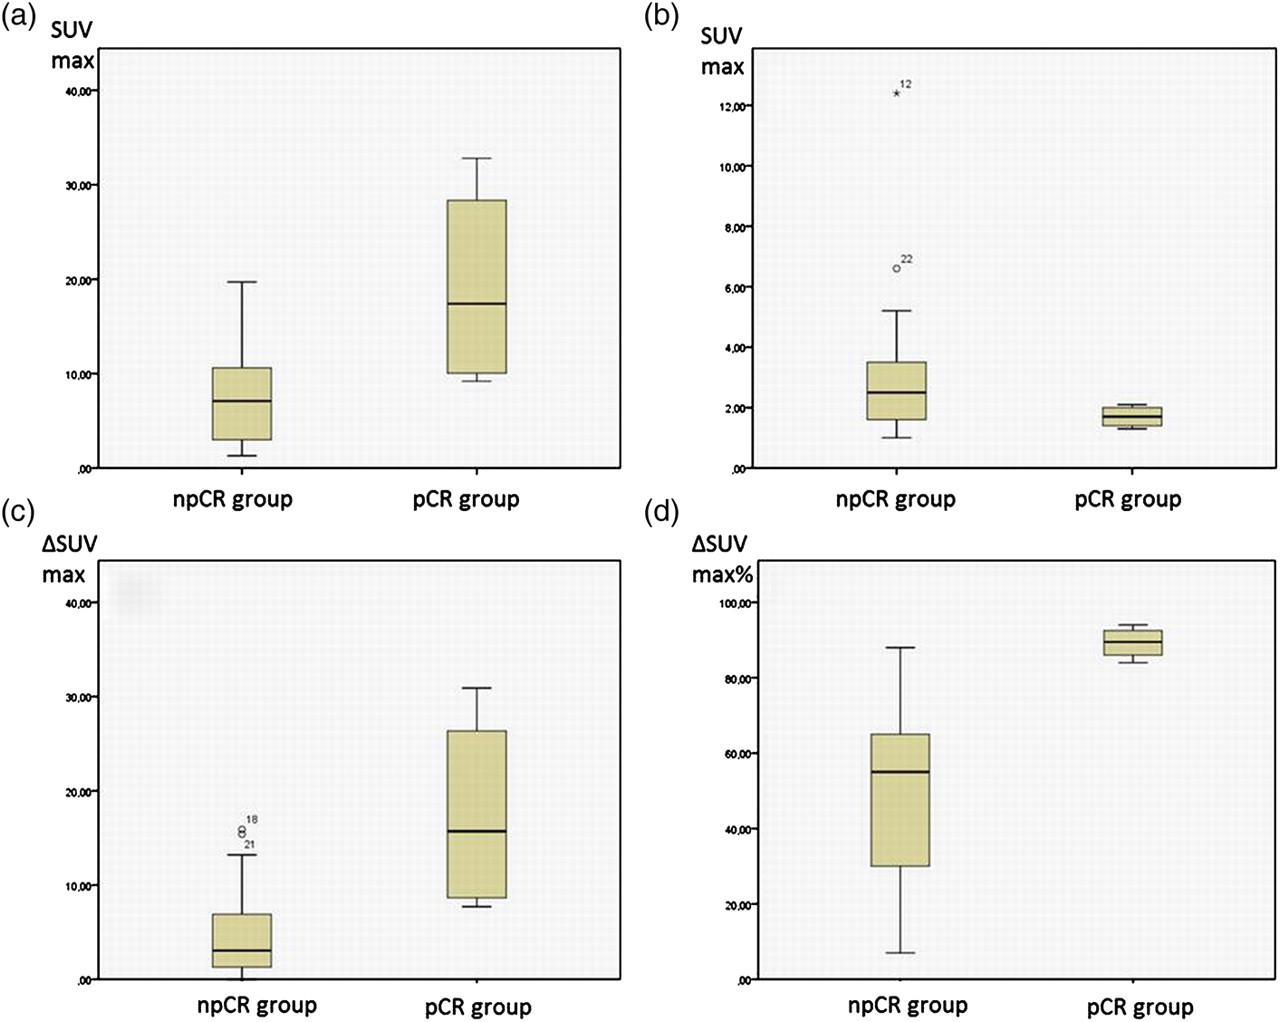
Evaluation algorithm B: Differences of the SUVmax of pCR and npCR lesions did show a statistically significant difference before (a, P = 0.023) and no statistically significant difference after the second cycle of NACT (b, P = 0.127). The absolute decrease of the SUVmax of pCR lesions was statistically significantly higher than that of npCR lesions (c, P = 0.013). The relative decrease (ΔSUVmax(%)) was also statistically significantly higher in the pCR group compared to the npCR group (d, P = 0.003)
Discussion
The analysis of these initial data indicates that FDG-PET/CT may be able to non-invasively predict an early pathological complete treatment response after two cycles of NACT and thus may enable the physician to discriminate those lesions from lesions without a non-pathological complete treatment response. This may have an impact on determining further therapeutic strategies and estimating the patients' prognosis.
Especially in locally advanced primary breast cancer NACT represents a common therapeutic regimen before subsequent surgical treatment (1–4). NACT has different therapeutic advantages: The risk of operative tumor cell spread can be reduced (2); moreover, tumor growth spurt after surgical resection is prevented and cytotoxic agents are delivered to the tumor with intact vessels (2). By the early initiation of a systemic therapy occult micrometastases can be treated as soon as possible (2, 3). A breast-conserving therapy may be an option even in locally advanced lesions or lesions with a sub-optimal localization (2). One crucial disadvantage is the fact that the response assessment of NACT is based on histopathology samples after completion of the NACT regimen (3, 29). It is well-known from the literature that NACT fails in a relevant proportion of patients (30). Groheux et al. published a pCR rate after NACT of only 13–26% of patients what is similar to our study (3). It would be a further optimization of NACT regimen if the therapeutic response could be monitored at an early stage of therapy in order to possibly change or abort the systemic treatment strategy. Our data indicate that FDG-PET/CT may be an accurate, non-invasive tool to early predict those patients with pCR after NACT.
For therapy response prediction by FDG-PET/CT only the FDG-PET information was evaluated in this study while the CT information was used to localize the lesions within the breast. Functional information alone was used for therapy response assessment due to the well-known low accuracy of morphological data for early assessment of treatment response (5, 7, 31). Former studies demonstrated that responders and non-responders to chemotherapy already show significantly different SUV values on the baseline scan, with responders showing higher SUV values than non-responders (32); but the reliability and accuracy of this criterion for the prediction of response to NACT is unknown. Sequential PET/CT studies on therapy control, after NACT have shown, that response assessment after the first cycle of NACT goes along with a low accuracy for predicting response, whereas therapy control after several cycles has been shown to go along with a high accuracy, while at the same time toxic side-effects and cost-intensive NACT in a relevant number of non-responding patients also have to be taken into account in these long-intervallic studies (3, 10, 24, 22, 33). Rousseau et al. determined the optimal timing after the second NACT cycle (10). Accordingly, in our study the time point for therapy control after the second cycle of NACT was chosen to reach the best compromise between accuracy and therapy control at an early stage.
Though there are many studies that investigated a therapeutic response to NACT in breast cancer patients on FDG-PET/(CT) before, the parameters (e.g. scan time points, inclusion criteria, investigation protocol, reference standard) differ considerably (3, 5, 7, 8, 10, 11, 22, 24, 32–34). There are some studies published that differentiate treatment results into pCR and npCR (23, 33–35); this differentiation together with the axillary lymph node status is of paramount importance as it strongly correlates with treatment success and the chance for disease-free survival (3, 23, 36, 37). While these studies used a simple two-tired scoring systems (pCR vs. residual disease) or the Miller and Payne grading system (38) as a reference standard, in the present study the Sinn score was chosen to evaluate the response to NACT. We chose the Sinn score because it is the current scoring model for the response assessment to NACT according to the guidelines of the German society of Senology (1). The semi-quantitative scoring system from 0 to 4 is more time-consuming, but, from our point of view, allows a more precise correlation of radiological and pathological responses to NACT than the commonly used two-tired scoring system. Furthermore we think that the Sinn scoring system for the correlation of pathological response grades and imaging data is superior to the Miller and Payne grading system (38) because it considers the presence of pure residual in-situ disease.
In this study algorithm A considers especially the pathological point of view by summarizing score 3 and 4 according to Sinn in one group of pathological response, because the pathological definition of complete pathological response is fulfilled in these two scores with no detectable tumor (score 4) and residual non-invasive tumor (DCIS) (score 3). From the clinical point of view algorithm B is to prefer to determine pCR because the patients' outcome has been reported to significantly differ between Sinn scores 3 and 4: Patients with residual DCIS (ypTis ypN0) showed an impaired disease free survival (DFS) and a trend towards worse overall survival (OS) when compared to patients with ypT0 ypN0 (39).
The results of this study indicate that absolute SUVmax measurements after NACT are not reliable to predict a pCR, but the amount of decrease of the SUVmax may be able to distinguish between pCR and npCR lesions. Based on these results FDG-PET/CT may allow for a relatively accurate differentiation between pCR and npCR lesions. Dependent on the preferred Sinn score definition of pCR (Algorithms A vs. B), we propose a cut-off of 66 and 88 ΔSUVmax(%) for the differentiation between responders and non-responders resulting in a sensitivity, specificity, NPV, PPV, and accuracy of 88%, 89%, 94%, 88%, and 92% and 75%, 100%, 95%, 75%, and 92%, respectively. The threshold for this differentiation has been addressed in numerous studies and subsequently a variety of different cut-offs for ΔSUV from 40% to 88% have been announced (7, 10, 24). One explanation for this variety might be the heterogeneity of the definitions of pathological response that were used as a reference standard. Further, the tumor histology, grading, and steroid receptor status of the included patients, like in our study, may not have been accounted for and may thus have influenced the ΔSUV evaluation; as demonstrated for the steroid receptor status in a recent study (40). These factors are important prognostic markers in breast cancer and at the same time influence the tumor 18F-FDG uptake (41). It is well-known that IDCs show a considerably higher SUV than ILCs, as analogously higher grade tumors and steroid receptor negative tumors are more 18F-FDG avid compared to lower grade and steroid receptor positive tumors (41, 42). We found an accumulation of all four ILC patients in the group of non-responders; but the small size of our cohort did not allow for a sub-analysis. We did not find any statistically significant differences for the allocation to the non-responders and responders group in dependency to the steroid receptor status, nor did we find a significant difference in the mean baseline SUVmax between steroid receptor positive and negative tumors (data not shown).
This study has limitations: the study suffers from its retrospective character and included only a limited number of patients. Different tumor stages as well as histopathological tumor sub-entities and different chemotherapeutic regimens were not specifically considered, so this study has to be rated as initial data work-up. This study only considers complete pathological response, so the group of npCR covers all other possibilities from no effect of treatment (score 0) until minimal residual invasive tumor (<0.5 cm) (score 2) (algorithm A) or residual non-invasive tumor only (score 3) (algorithm B). From a clinical point of view this has to be examined in further subgroups within a larger study population. A larger, prospective trial with separate tumor subgroups, classified into different histopathological tumor entities and T stages may more accurately determine therapy response markers compared to this initial trial. A last limitation not only of this study but the PET/CT method might be the lower accuracy of SUVmax measurements and subsequently the limited reliability evaluation of the pre- to post-therapeutical SUVmax regression rate in tumors that are only faintly 18F-FDG avid on the baseline scans. Consequently, the early assessment of response to NACT using PET/CT might be limited to considerably 18F-FDG avid tumors and future studies have to address this topic. Nevertheless the results indicate the possible diagnostic value of FDG-PET/CT to early detect a pCR or npCR following NACT.
In conclusion, FDG-PET/CT may be an accurate tool for early predicting pCR to NACT. By adding FDG-PET/CT to the standardized work-up of breast cancer patients treated in a neoadjuvant concept a pCR may be predicted in the early treatment cycle; thus patients with insufficient response to treatment may early be triaged to alternative concepts.