
Abstract
Background
Imaging the perfusion of contrast media in breast tumors may allow improved diagnosing and treating breast cancer.
Purpose
To compare the perfusion curve f (t) characteristics of contrast-enhanced ultrasonography in benign and malignant breast tumors.
Material and Methods
Patients with breast tumors (n = 87) were evaluated with contrast-enhanced ultrasonography and the perfusion curve f (t) parameters were calculated using Sonoliver® software to compare analysis (tumor) and reference (normal) tissue areas. Differences between breast and breast tumors were assessed.
Results
Compared to benign tumors, malignant tumors had faster enhancement time and a shorter mean transit time (all P values < 0.05). The intensity of the signal was also greater for malignant compared with benign tumors.
Conclusion
Perfusion curve f (t) parameter measurements can distinguish differences in vascular flow between malignant and benign breast tumors and may provide a new quantitative indicator of breast tumor.
Angiogenesis is required for solid tumor growth and is among one of the earlier developments that differentiate normal and malignant tissue (1–3). Tumor vasculature is structurally and functionally different than normal vasculature (4). Typically, tumor vessels are small, tortuous, and lack muscle. Angiogenesis has been shown to be an independent predictor of malignant disease (5). The altered blood flow in cancer tumors is evident by contrast-enhanced ultrasonography due to its ability to image perfusion (6).
Ultrasonography imaging is one of the most commonly used clinical imaging methods and is being developed for diagnosis of breast cancer as well for monitoring treatment effects and evaluating completeness of tumor resection (7–9). The main advantages of this method are the minimal health risk associated with patient exposure to ultrasonic energy, real-time capability. A recent advance in ultrasonography imaging has been the development of microbubble contrast agents. Microbubbles are subcapillary-sized gas-filled spheres (2–3 μm in size) that pass freely though the microcirculation and have a circulatory lifetime in the order of minutes (10). Gaseous microbubbles result in a large acoustical impedance and compressibility differences between the intravascular microbubbles and the surrounding blood resulting in increased contrast. This results in improved ultrasound sensitivity to blood flows in small vessels such as those associated with tumor vasculature (10,11).
SonoLiver® software, (TomTec Imaging Systems, Munich, Germany) facilitates the analysis of contrast-enhanced, dynamic vascular perfusion ultrasonography. Briefly, it provides automatic motion compensation by finding the optimal geometrical transformation for aligning a floating image with respect to a reference image. Through this software, the time-intensity curve related to perfusion can be obtained and used to analyze quantitatively perfusion characteristics of blood within a tumor which is difficult with ultrasonography alone. The software was originally designed for diagnosing focal liver masses. Here, we investigated whether the SonoLiver® software could be used to improve the analysis of breast tumors, and possibly help distinguish the difference between malignant and benign lesions. This study compared the dynamic perfusion curves f (t) of benign and malignant breast tumors.
Material and Methods
This was a retrospective study that investigated the use of contrast-enhanced ultrasonography for the diagnosis of breast cancer. Patients that underwent surgery between April 2010 and April 2011 at our hospital were enrolled in the trial. The study was approved by Shaanxi Tumor Hospital Institutional Review Board and patients gave their informed consent.
Study subjects
Eligible patients had breast tumors that were not able to be definitively diagnosed by 2D ultrasound. Patients were excluded from the study if the tumor was too large to allow the selection of a references area for comparison. Tumors were postoperatively diagnosed by pathology and the imaging analysis was blinded to the pathological results.
Study design
The ultrasound imaging examination was carried out approximately 1 week prior to surgery and was performed by the same physician. The area of analysis was manually selected by the physician and was the tumor region with high vascular density and a clear image.
Philips iU22 color Doppler ultrasonic diagnostic apparatus and L9-3 probe were used (Universal Diagnostic Solutions, Oceanside, CA, USA). Pulse-inversion harmonic imaging (contrast /general) was employed and the mechanical index was set at 0.06. The ultrasound contrast agent was SonoVue® (Bracco, Milan, Italy) and the analysis software was Sonoliver.
The patients were injected via a catheter in the superficial vein of the forearm with 2.4 mL of SonoVue® contrast agent (59 mg in 5 mL of normal saline), followed rapidly by an injection of 5 mL of normal saline. The tumor location, size, morphology, border, internal echo, and distribution of blood flow were first observed using color Doppler ultrasound before the instrument was switched to contrast/ general mode. The real-time enhanced images of lesions and surrounding breast tissue were observed continuously and recorded for 3 min by a synchronized whole-course DVD video and stored as a DICOM file.
The imaging data was analyzed by selecting a region of interest (analysis area). The analysis area was set to be about 25 mm2 of the tumor, and the reference area was a similar depth of the surrounding breast parenchyma. The time variable was calculated starting at the time of injection of the contrast agent. The Sonoliver® software plotted the dynamic perfusion curves of the analysis and reference area automatically and carried out the fitting analysis for the original data according to the function (see Table 1 for additional description):
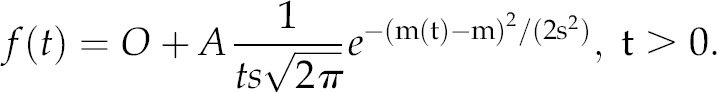
List of terms
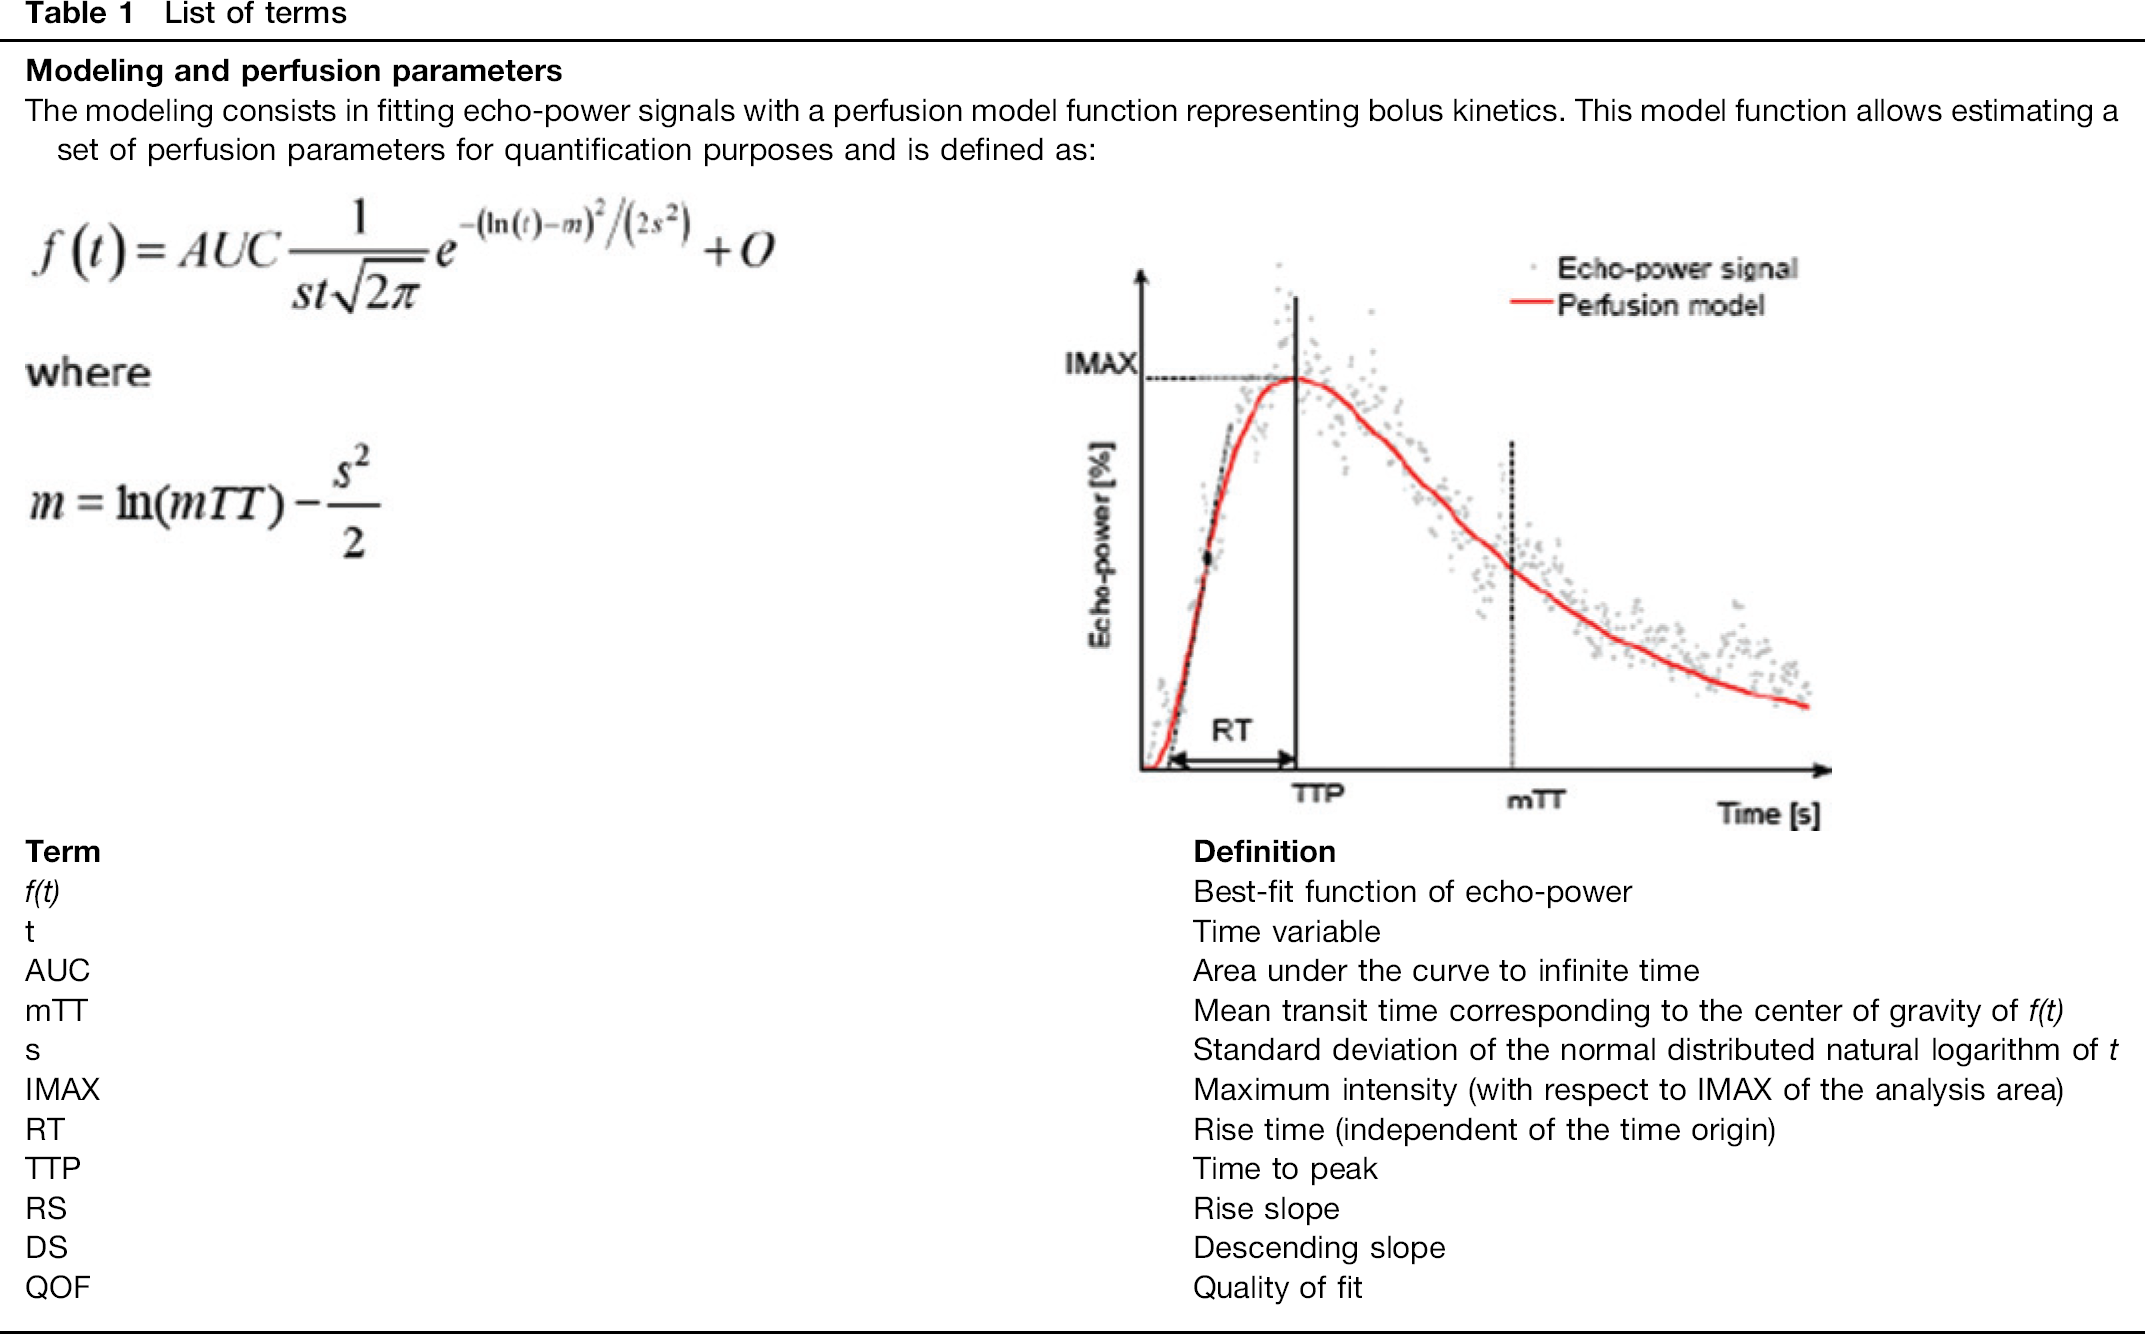
The corresponding parameters were obtained: maximal intensity (IMAX; in this study, the IMAX of the reference area was set to be 100%, and the IMAX of the analysis area was the ratio of the IMAX of the analysis area to that of the reference area), rise time (RT), time to peak (TTP), mean transit time (mTT), rise slope (RS), descending slope (DS), and quality of fit (QOF) (see Table 1 for definition of terms).
Statistical analysis
Statistical analyses were performed using SPSS 17.0 statistics software (SPSS Inc, Chicago, IL, USA). Subjects’ demographics and clinical characteristics were summarized as mean ± standard deviations (SDs) in continuous variables and n (%) for categorical variables. Differences in demographics and clinical characteristics between tumor types were compared using two-sample t-test for continuous variables and Mann-Whitney U test if the data were not normally distributed. Perfusion parameters were presented as mean ± standard error of the mean (SEM). Mann-Whitney U test was used to compare between tumor types as the perfusion parameter values were not normally distributed.
Results
Patient baseline demographics and disease characteristics
Eighty-seven patients with breast tumors were enrolled in the study of which 57 (all women) had malignant and 30 had benign tumors. The average age between the different tumor groups were similar (benign 43.1 ± 12.0 vs. malignant 46.0 ± 10.9; P = 0.258). The tumor size was larger for patients with cancer (diameter: 0.8 ∼ 4.6 cm with an average of 1.95 ± 0.96 cm) vs. those with benign tumors (diameter: 0.7 ∼ 2.7 cm with an average of 1.25 ± 0.59 cm) (P < 0.001). The most common types of benign tumors were breast fibroma (63.3% [19/30]), fibroadenoma with adenosis (23.3% [7/30]), and intraductal papilloma (13.3% [4/30]). The most common types of malignant tumors were infiltrating ductal carcinoma (82.5% [47/57]), ductal carcinoma in situ (7% [4/57]), infiltrating lobular carcinoma (7% [4/57]), and intraductal carcinoma (3.5% [2/57]).
Imaging results
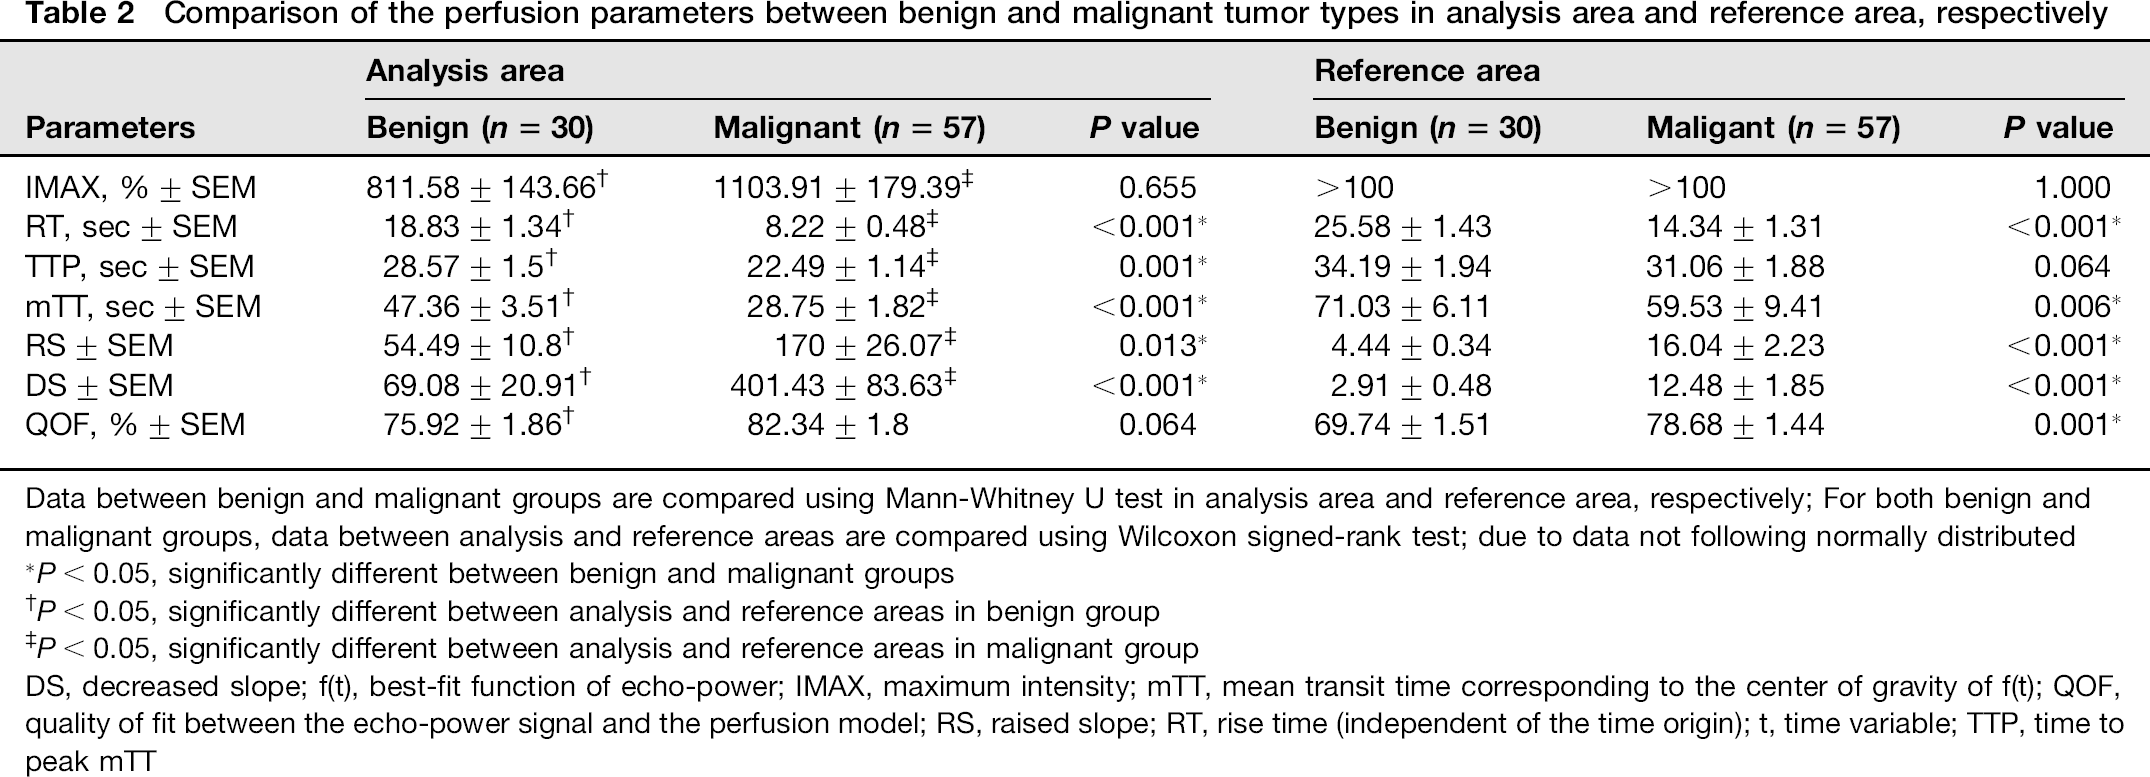
Among the best-fit function of echo power (f [t]) parameters, the QOF between the echo-power signal and the perfusion model for the malignant tumors were similar and were >75% (P = 0.064) (Table 2). The QOF for benign lesions differed between the two models with the analysis area fit being 75.9% and reference area 69.7% (P = 0.001). The echo power for malignant breast tumors rose and fell rapidly (Table 2, Fig. 1) while that for benign tumors had slower rise and fall times (Table 2, Fig. 2) For the benign tumors, the ascending branch was slightly flat and the descending branch was flat.
Comparison of the perfusion parameters between benign and malignant tumor types in analysis area and reference area, respectively
Data between benign and malignant groups are compared using Mann-Whitney U test in analysis area and reference area, respectively; For both benign and malignant groups, data between analysis and reference areas are compared using Wilcoxon signed-rank test; due to data not following normally distributed
P < 0.05, significantly different between benign and malignant groups
P < 0.05, significantly different between analysis and reference areas in benign group
P < 0.05, significantly different between analysis and reference areas in malignant group
DS, decreased slope; f(t), best-fit function of echo-power;
Contrast-enhanced ultrasound images and dynamic perfusion images of invasive ductal carcinoma. (a) Ultrasound images, the area within the blue line is the motion compensation area, the area within the green line is the region of interest for the analysis area, the area within the year line is the region of interest for the reference area; (b) Color-coded display of the dynamic perfusion model diagram; (c) Dynamic perfusion curves of the reference area and the analysis area, the thin line is the original perfusion curve, and the thick line is the perfusion curve after fitting; (d) Dynamic perfusion curve obtained by subtracting the reference area from the analysis area
Contrast-enhanced ultrasound images and dynamic perfusion images of breast fibroadenoma. (a) Ultrasound images, the area within the blue line is the motion compensation area, the area within the green line is the region of interest for the analysis area, the area within the year line is the region of interest for the reference area; (b) Color-coded display of the dynamic perfusion model diagram; (c) Dynamic perfusion curves of the reference area and the analysis area, the thin line is the original perfusion curve, and the thick line is the perfusion curve after fitting; (d) Dynamic perfusion curve obtained by subtracting the reference area from the analysis area
Excluding IMAX and QOF, the perfusion parameters of the analysis area significantly differed between the benign and malignant groups (all P values < 0.05) (Table 2). For the reference area, perfusion parameters were also significantly different except for IMAX and TTP (all P values < 0.05). For the benign group, the perfusion parameters differed between the analysis and reference areas; the analysis area had higher IMAX, RS, DS, and QOF but lower RT, TTP, and mTT compared with the reference area (all P values < 0.05) (Table 2). In the malignant group, excluding QOF, the perfusion parameters differed between the analysis and reference area, with IMAX, RS, and DS being higher and RT and mTT being lower compared with the reference area (all P values < 0.05).
Discussion
Several prior studies have found that contrast-enhanced ultrasound can differentiate between malignant and benign tumors (12–15). However, the specificity was not optimal for clinical diagnostic use. Although, the use of microbubbles increased the ability to distinguish between the two tumor types, the findings were only semi-quantitative and there was still a need to improve specificity (12,13). To improve the quantitative aspect of this technique, we used Tom Tex SonoLiver software to quantitatively measure the perfusion curve f (t). We chose analysis and reference areas that were similar in depth and had good curve fitting between the two areas as indicated by the QOF being >70%. IMAX was relative to the reference area, and the time variable for RF, TTP, and MTT was from the time of injection which is important for collecting real-time parameters such as very rapid enhancement (13).
In this study, there were significant differences in imaging parameters between benign and malignant tumors. Compared to benign tumors, malignant tumors had a more rapid enhancement time and a shorter mean transit time (all P values < 0.05). The intensity of the signal was also greater for malignant compared with benign tumors. These findings are consistent with others that found malignant tumors had a more rapid enhancement and decline compared to benign tumors (12–15).
Malignant breast tumors have high microvascular density, arteriovenous shunts, and small tortuous vessels that lack a muscular layer (16). The rapid rise and fall (shorter RT, TTP, and mTTP) likely reflects these morphological differences resulting in more rapid flow of micro-bubbles through the malignant tumors as compared to the more normal vasculature of a benign mass (15,17). The rapid fall may also result from arteriovenous shunting due to incomplete or inappropriate blood vessel formation. RS and DS in the malignant group were significantly greater than those in the benign group, reflecting faster changes in the flow rate and velocity of microbubbles entering the malignant tumor vascular bed, consistent with malignant tumors, usually having a rich blood supply and larger number of feeding arteries as compared to benign tumors.
Although, malignant tumors had numerically higher IMAX than benign lesions, this did not reach statistical significance. The lack of significance may reflect the fact that some benign tumors such as fibroadenoma have epithelial hyperplasia and high density microvasculature.
Some of the imaging parameters of the reference areas also differed between patients with malignant and benign tumors. In the reference area of malignant tumors, RT was shorter than that in the benign tumors and RS and DS were greater than those in the benign tumors. We speculate that this may indicate that the malignant tumor had infiltrated the surrounding reference area, possibly suggesting that this technology may give insight into early tumor invasion as well as monitoring the completeness of tumor resection.
The ultrasonography analysis used in this study has the potential of identifying breast cancer that is small, not palpable and non-calcified. It also does not use radioactivity and is non-invasive. These properties potential give this imaging technique advantages over other diagnostic imaging methods. Contrast enhanced ultrasound provides real-time information about blood flow and volume, and can image organs and tumor lesions (18). The microbubble contrast agent increases the acoustic impedance difference between blood and gas which increases the back-scatter of the micro-bubbles. When under sound pressure with low mechanical index, the microbubbles cause the second harmonic generation. Therefore, by obtaining the real-time distribution of the microbubbles tumor angiogenesis can be imaged. As a result, the contrast-enhanced ultrasound makes up for the deficiencies of conventional ultrasound in terms of microcirculation perfusion and hemodynamics (18).
Contrast-enhanced ultrasound is not subject to some of the same technical issues as color Doppler ultrasound. Color Doppler imaging and power Doppler can detect blood flow signals at the level of arteries and veins that are about ≥ 200 μm in diameter and their results can be affected by the depth of target area, the angle between the beam, and blood flow velocity. With color Doppler it is difficult to show the low-velocity blood flow within the breast, and the branches of small blood vessels cannot be displayed completely and clearly. Power Doppler cannot reflect the tumor angiogenesis at the microvascular level, and it is difficult to differentiate the tumor and the artifacts caused by background noise (18).
The microbubbles used in contrast-enhanced ultrasound have a diameter of 2
Other imaging technologies commonly used to detect breast cancer are dynamic contrast-enhanced magnetic resonance imaging and contrast-enhanced digital mammography (18). Dynamic contrast-enhanced MRI is usually used as an additional imaging method when the combination of X-ray mammography and ultrasonography result in an inconclusive diagnosis. Dynamic contrast-enhanced MRI alone or in combination has a higher sensitivity compared with X-ray mammography and ultrasonography (19–21). However, MRI has some limitations including limited specificity, high costs and that fact that it cannot be used in all women as those that are pregnant or have metallic implants, which does not make it appropriate for first-line diagnosis (18,20).
Contrast-enhanced digital mammography can detect DCIS but requires the use of ionizing radiation (18).
There are several difficulties in using contrast-enhanced digital mammography. The determination of the ultrasound contrast enhancement relies on visual observation and analysis of the perfusion curve parameters. The former is dependent upon the knowledge and experience of the physician and the latter is affected by the image quality. There must be good cooperation between the nurse who injects the contrast agent and the radiologist who performs the ultrasound examination. The dynamic acquisition of images must be carried out at the same time as the injection of the contrast agent to avoid data distortion. Selection of the region of interest and unified specification for a smooth curve are critical in perfusion curve analysis. Otherwise, the morphological changes of curves and accuracy of quantitative parameter measurement will be directly affected. Another limitation is that this method is not suitable for large masses as the large size makes it difficult to define a reference region within the same image. Also findings may depend at least in part on the histopathology of the tumor and that some tumors may be more difficult to characterize than others (22). Future studies are needed to further investigate the use of this technology for diagnosing breast cancer.
In this study, the most common types of benign tumors were breast fibroma (63.3%), fibroadenoma with adenosis (23.3%), and intraductal papilloma (13.3%). In Western countries the most common benign tumors are fibroadenomas. The fact that breast fibroma was the most common in this study may reflect the small sample size and the particular inclusion/exclusion criteria used in this trial and consequently the patient population may not reflect the general population. Alternatively, it is possible that the frequency of a given benign tumor differs between Asian and Western country populations.
In conclusion, there have been limited studies on the use of contrast-enhanced ultrasonography in distinguishing between benign and malignant breast tumors and the results have not been consistent, indicating a need for further development (13). Our findings indicate that the quantitative analysis of the perfusion curve f (t) can distinguish between malignant and benign breast tumors.