
Abstract
Background
In recent years, breast magnetic resonance imaging (MRI) has been used to evaluate the morphology and functional markers of breast lesions, which might influence local staging and surgical planning.
Purpose
To evaluate the feasibility of a one stop MRI protocol combined with diffusion-weighted imaging with background body signal suppression (DWIBS), T2*-weighted perfusion imaging (T2*-PWI) and delayed contrast-enhanced T1-weighted MRI (T1W-C+).
Material and Methods
All experiments were conducted with a 3-T clinical MRI scanner. The apparent diffusion coefficient (ADC) and detectability of lesions in DWIBS, the maximal signal intensity drop rate (MSIDR) in T2*-PWI and the intensity increasing rate (IIR) on T1W-C+ were compared between breast malignancies (n = 29) and benign lesions (n = 31). The time–signal curves in the T2*-PWI sequences were classified into two subtypes (a and b) according to the end of the curve. The ADC, MSIDR, the first maximal signal intensity decrease time (MSIDT), and IIR between the malignant and benign lesions were statistically analyzed by unpaired t-tests.
Results
Overall, 90% of the lesions were detected by DWIBS. There were significant differences in ADC, MSIDR, and IIR between the carcinomas and benign lesions. The Ib subtype in T2*-PWI demonstrated a specificity of 66.7% in differentiating between carcinomas and benign lesions. At a fixed specificity of 93.5%, the MSIDR, IIR, and ADC differentiated breast carcinomas from benign lesions with sensitivities of 82.8%, 44.8%, and 86.2%, respectively.
Conclusion
DWIBS might be a compensation sequence for detecting breast lesions in pre-contrast sequences. MSIDR from T2*-PWI had the best specificity index, and the two subtypes in the T2*-PWI curve were helpful in the differential diagnosis of carcinomas from benign lesions.
Keywords
In recent years, breast MRI has been used to evaluate the morphology and functional markers of breast lesions (1–4), which might influence local staging and surgical planning (5). Dynamic contrast material-enhanced T1-weighted MRI (T1-DCE) (6) with a gadolinium-based contrast agent is now widely accepted for the preoperative diagnosis of breast lesions and the detection of additional lesions (1, 7–10). The signal intensity increases faster and with greater magnitude in most breast carcinomas after the administration of gadolinium-based contrast agents in T1-DCE. The sensitivity of T1-DCE for breast carcinomas is excellent (88–100%), but estimates of the specificity range from 37% to 89% (7, 11, 12). Therefore, dynamic T2 *-weighted first-pass perfusion imaging (T2 *-PWI) (7, 13) has been introduced to improve the specificity for diagnosing breast carcinomas. Using T2 *-PWI, a rapid and strong signal intensity loss is observed after a bolus injection of gadolinium-based contrast agents for most breast carcinomas; this effect is based on high-capillary perfusion (7, 13, 14). Huang (11) reported that for differentiating carcinomas from benign lesions, the specificity of T1-DCE MRI alone was 62.5% and improved to 100% with the further addition of T2 *-PWI.
Furthermore, diffusion-weighted whole-body MRI with background body signal suppression (DWIBS) (15, 16) has also been examined as a promising tool for improving the sensitivity and specificity in the detection of breast malignancy. DWIBS without any contrast agents has potential value as a screening protocol for breast lesions (16–18) before starting T2 *-PWI or T1-DCE sequences. Park reported that the apparent diffusion coefficient (ADC) acquired from diffusion-weighted imaging (DWI) could detect breast tumors with a detection rate of 86.2% (3), especially for malignancies (19). The combination of DWI and T1-DCE can yield high diagnostic accuracy in the characterization of enhanced masses during breast MRI (10).
In this study, our primary objective was to prospectively determine if a one-stop MRI protocol that included DWIBS, T2 *-PWI and delayed contrast-enhanced T1-weighted MRI (T1W-C+) improves the specificity when differentiating between carcinomas and benign tumors.
Material and Methods
Patients
The study cohort consisted of patients with breast lesions who were referred to the Drum Tower Hospital of Nanjing University Medical School, Nanjing, China, in the period between September 1, 2010 and September 31, 2011. Seventy-nine patients with suspected breast lesions were included. The patients with positive diagnoses at a physical exam and mammography were recruited to participate in this study. The patients' results on the mammograms were scored, according to the Breast Imaging Reporting and Data System (BI-RADS), as either BI-RADS 4 (suspicious abnormality) or BI-RADS 5 (highly suggestive of malignancy). Approval from our institution's ethics committee and informed consent from the patients were obtained for the study. All of the patients underwent surgical treatment within 1 or 2 weeks after MR scanning, and the final diagnosis was based on the histopathological examination of surgically excised specimens. Some data were excluded from the MRI analysis without final pathological diagnosis (n = 9) or by the disqualification of images with artifacts (motion or others) (n = 10). Therefore, we included 60 women with breast lesions (43.9 ± 14.5 years old, average age ± standard deviation [SD]).
Conventional and advanced MRI acquisition
All of the experiments were conducted with a 3 Tesla using an 8-channel phased array coil (Gradient strength 40/80 mT/m, slew rate 200/100 T/m/s, Achieva 3.0T TX dual Medical Systems, Philips Medical Systems, Best, The Netherlands).
The following conventional sequences were used: T1W-SPAIR with and without contrast (THRIVE, TFE, TRA, TR 4.5 ms, TE 1.68 ms, flip angle 10°, matrix 512 × 512, slices 32, thickness/gap 0.8 mm/0), T2W (TSE, TRA and SAG, TR 5000 ms, TE 120 ms, thickness/gap
The functional MRI (fMRI) examination protocol included DWIBS, T2
*-PWI, and T1W-C+. DWI with STIR was adopted in the DWIBS sequence, and it covered a large FOV of the upper chest to the neck region. The following acquisition parameters in DWIBS were used: multislices, single-shot echo-planar imaging (EPI), TR/TE 9000 ms/ 67 ms, TI (inversion time) 180 ms, NSA 5, FOV 266 mm × 373 mm × 260 mm, matrix 140 ×256, slices
Image processing and data analysis
The data for each sequence were transferred to a commercially available postprocessing workstation (Extended Workspace [EWS], Philips Medical Systems, Best, The Netherlands). The MR images of 60 patients were reviewed by two radiologists (ZB and YL). The two radiologists were blinded to the clinical findings, the imaging reports, and the pathological results. A consensus was reached after the MRI findings were discussed. The independent ADC map was generated after the DWIBS image acquisition. For the 3D display, multi-planar reformat (MPR) and maximum-intensity projection (MIP) were employed in the DWIBS using a black and white inverse gray scale. In these inverted MIP images, the low signal corresponded to restricted diffusivity and low ADC values.
An elliptical region of interest (ROI) was positioned in the most enhanced region in the lesion on the images, and the time–signal intensity curves were obtained. For the selection of the most contrast-enhancing part of the tumor for the positioning of the ROIs in T2 *-PWI and DWIBS images, the ROIs were placed in the lesion in different sections, and the slice of the lesion with the strongest and most rapid signal intensity increase was selected for further analysis. The size of each ROI was 100 ∼ 150 mm2 in the T1W-C + , T2 *-PWI, and DWIBS images depending the tumor size. The mean value of the ROI was measured twice, and the mean of two measures was used to represent the values of the entire lesion from the T1W-C + , T2 *-PWI, and ADC maps. The normal contralateral glandular region was selected as a reference ROI.
The maximal signal intensity drop rate (MSIDR) using T2 *-PWI was calculated as a percentage. The equation for MSIDR was (SI-SIL)/SI × 100%, where SI represented the baseline maximal signal intensity, and SIL represented the first lowest signal intensity in the first 30 s (7) during acquisition. Additionally, the first maximal signal intensity decrease time (MSIDT) was recorded (7). According to Kvistad and Daniel (7, 20), the time–signal intensity curves of T2 *-PWI diagrams were classified into two types. Fig. 1 shows the classification system for the time–signal intensity curves of T2 *-PWI: Type I demonstrated an MSIDR that was equal to or greater than 20%; type II demonstrated an MSIDR that was less than 20%.

Diagrams show the classification system for the time–signal intensity curves for T2*-PWI: type I has an MIR equal to or greater than 20% and; type II has an MIR of less than 20%; subtype a curves have ends lower than baseline and subtype b curves have ends higher than the baseline
The equation for the delayed intensity increasing rate (IIR) on T1W-C+ was (SIpost-SIpre)/SIpre × 100%, where SIpre represented the baseline signal intensity on T1W-SPAIR without contrast, and SIpost represented the signal intensity for T1W-SPAIR with contrast after the T2 *-PWI sequences.
Immunohistochemistry
The microvessel density (MVD) was determined by counting endothelial cells stained with brown dye. The hotspots in the microvessel concentrate were computed using a low-power lens (×40); using a high-power lens (×400), three hotspots for each slice were chosen to provide the average MVD value (number per visual field). CD31 was adopted as an immunomarker.
Vascular endothelial growth factor (VEGF) expression was positive, with a brown cytoplasm observed for cells that stained dark brown. The VEGF staining was classified into four grades: negative for no positive cells, low expression for fewer than 25% positive cells, mild expression for 25–50% positive cells, and high expression for greater than 50% positive cells.
Statistical analysis
The Statistical Package for the Social Sciences, Version 11 (SPSS11, Chicago, IL, USA) was used for statistical analyses. All of the indicators are reported as mean and standard deviation (SD). The statistical analysis of the ADC, MSIDR, MSIDT, and IIR between the malignant and benign lesions was performed using unpaired t-tests. The correlations of the ADC, MSIDR, MSIDT, IIR, MVD, and VEGF expression were examined using Pearson's correlation coefficient. The significance level was set at P< 0.05. Binary logistic regression was performed to assess whether combinations of the different MR markers improved the diagnostic ability. Receiver-operating characteristic (21) curves of ADC, MSIDR, and IIR were plotted for each pair-wise clinical group comparison. The area beneath the fitted binormal ROC curve was used as a measure of diagnostic efficacy.
Results
Pathologic diagnosis
Twenty-nine patients with breast-infiltrating ductal carcinomas (aged 42 ± 13.5 years) were diagnosed by pathology. The tumors had diameters of 0.5–3.0 cm (1.17 ± 1.52 cm). Three of 29 patients demonstrated multifocality, but only the largest lesions among them were chosen for analysis. Twenty of 29 patients were diagnosed with T1 ∼ T2 breast carcinomas, and nine of 29 were diagnosed as T3 ∼ T4. Thirty-one cases with benign lesions (aged 43 ± 16.5 years) included seven breast fibroadenomas, 12 intraductal papillomas, seven cystic hyperplasias, four cases with plasma cell mastitis, and one myofibroblastoma. The diameter of these benign masses ranged from 1.0 to 6.0 cm (2.92 ± 1.31 cm).
The immunohistochemistry results indicated that VEGF was enriched in 22 of 29 cases of breast carcinoma with grades of (++ ) to (+++), which represent, respectively, mild expression of VEGF (25–50% positive cells) and high expression of VEGF (more than 50% positive cells). VEGF was absent in 25 of 31 cases of benign lesions with grades of (–) to (+), which represent, respectively, negative expression of VEGF and low expression of VEGF (less than 25% positive cells). The MVD was higher in breast carcinomas than in benign lesions. There was a significant difference in the MVD between groups (P < 0.05) (Tables 1 and 2).
The detection rate of breast tumors, with the ADC (mean ± SD), MVD, and VEGF results
The detection rate of breast tumors on MRI sequences in 60 cases with the gold-standard diagnostic criterion of the T1-DCE. The classification marks denote the following: (–) negative expression of VEGF, (+) low expression of VEGF (less than 25% positive cells), (++ ) mild expression of VEGF (25–50% positive cells), (+++) high expression of VEGF (more than 50% positive cells)
The results of MR indicators and the t-test for the equality of means
*P < 0.05; 0.05 < P < 0.1 = statistical tendency; Levene's statistic was used in the test of homogeneity of variances
Malignant, infiltrating ductal carcinomas (n = 29); Benign, benign breast lesions (n = 31); MSIDR, maximum signal intensity loss rate after bolus injection; MSIDT, first maximal intensity decrease time; IIR, intensity increasing rate on T1W-C+ after contrast administration; F, F-test statistic in Levene's test for equality of variances
DWIBS and ADC data
Sixty enhancing lesions were detected in the T1W-C+ and they were completely in agreement with the findings of the physical exam and mammography. Fifty-four of 60 lesions were detected using DWIBS, which resulted in a detection rate of 90%. T1W and T2W detected 58.3% and 75% of the lesions, respectively. The number of lesions was 45 of 60 in mass-like tumors and 15 of 60 in non-mass tumors, which cannot be observed on unenhanced sequences. There was a significant difference in the ADC between the carcinomas and the benign lesions (P < 0.05) (Tables 1–3).
The ADC values of different tissues in the DWIBS (the mean ± SD) and ANOVA between groups
*P < 0.05 = statistical significance; Levene's statistic was used in the test of homogeneity of variances. There were three significant comparisons between groups, including Tumor to Normal, Tumor to Lymph node and Normal to Lymph node, in the above ANOVA tests
Normal (N), normal breast gland; Tumor (T), malignant tumor with enhancement; Lymph node (L), metastatic lymph node
The head/neck region, chest, and abdomen were clearly visible in the DWIBS images. The ADC values among the tumors with contrast enhancement, lymph nodes, and the surrounding breast tissue were significantly different (P < 0.05) (Table 3). The smallest lesion diameter detected by the DWIBS images was 0.5 cm (Fig. 2).

Invasive ductal carcinoma in the upper outer quadrant of the left breast (white arrow) in a 55-year-old woman. (a) Sagittal SPAIR; (b) DWIBS with right-lateral oblique orientation reveals the carcinoma (white arrow), sternum and thoracic vertebra (asterisks). Four lymph nodes in the left axillary cavity are shown clearly (circle); (c) Pre-contrast T1W as a baseline signal intensity; (d) Post-contrast T1W-C+ reveals the carcinoma with an obvious enhancement
T2 *-PWI data
The analysis of the T2 *-PWI showed an MSIDR in carcinomas of 44.5% ± 17.7% during the first 30 s after contrast material injection. The average MSIDT in carcinomas was 23.6 s ± 6.3 s after the injection of bolus contrast agent injection. The mean MSIDR and MSIDT in the benign lesions were 18.5% ± 7.1% and 22.1 ± 9.7 s, respectively. The difference in MSIDR between the carcinomas and the benign lesions was highly significant (P < 0.001) (Table 2). However, a significant difference was not detected in the MSIDT between the groups.
The T2 *-PWI diagrams were classified into two types. Fig. 1 shows the classification system for the time–signal intensity curves of T2 *-PWI: type I demonstrated an MSIDR equal to or greater than 20% and type II demonstrated an MSIDR of less than 20%. There were 82.5% type I curves and only 17.2% type II curves in the malignant tumors (Table 4). We found that 28 of 31 benign lesions and only one of 29 malignant tumors demonstrated an increasing curve whose end portion was higher than the baseline. Therefore, we attempted to subtype the curves of T2 *-PWI. Subtype “a” had an end portion of the curve that was lower than the baseline; subtype “b” had an end portion of the curve that was higher than the baseline. The results of subtyping the breast lesions are shown in detail (Figs. 1, 3 and 4, Table 4).

(a) Intraductal papilloma in a 52-year-old woman on post-contrast T1W-C+ reveals the lesion with obvious enhancement (white arrow); (b) Infiltrating ductal carcinoma in a 65-year-old woman on post-contrast T1W-C+ reveals the lesion with obvious enhancement (white arrow); (c) T2*PWI curve showing the Ib subtype in the intraductal papilloma and the Ia subtype in the infiltrating ductal carcinoma. In the intraductal papilloma, the PWI curve increases at the end (dark arrow)
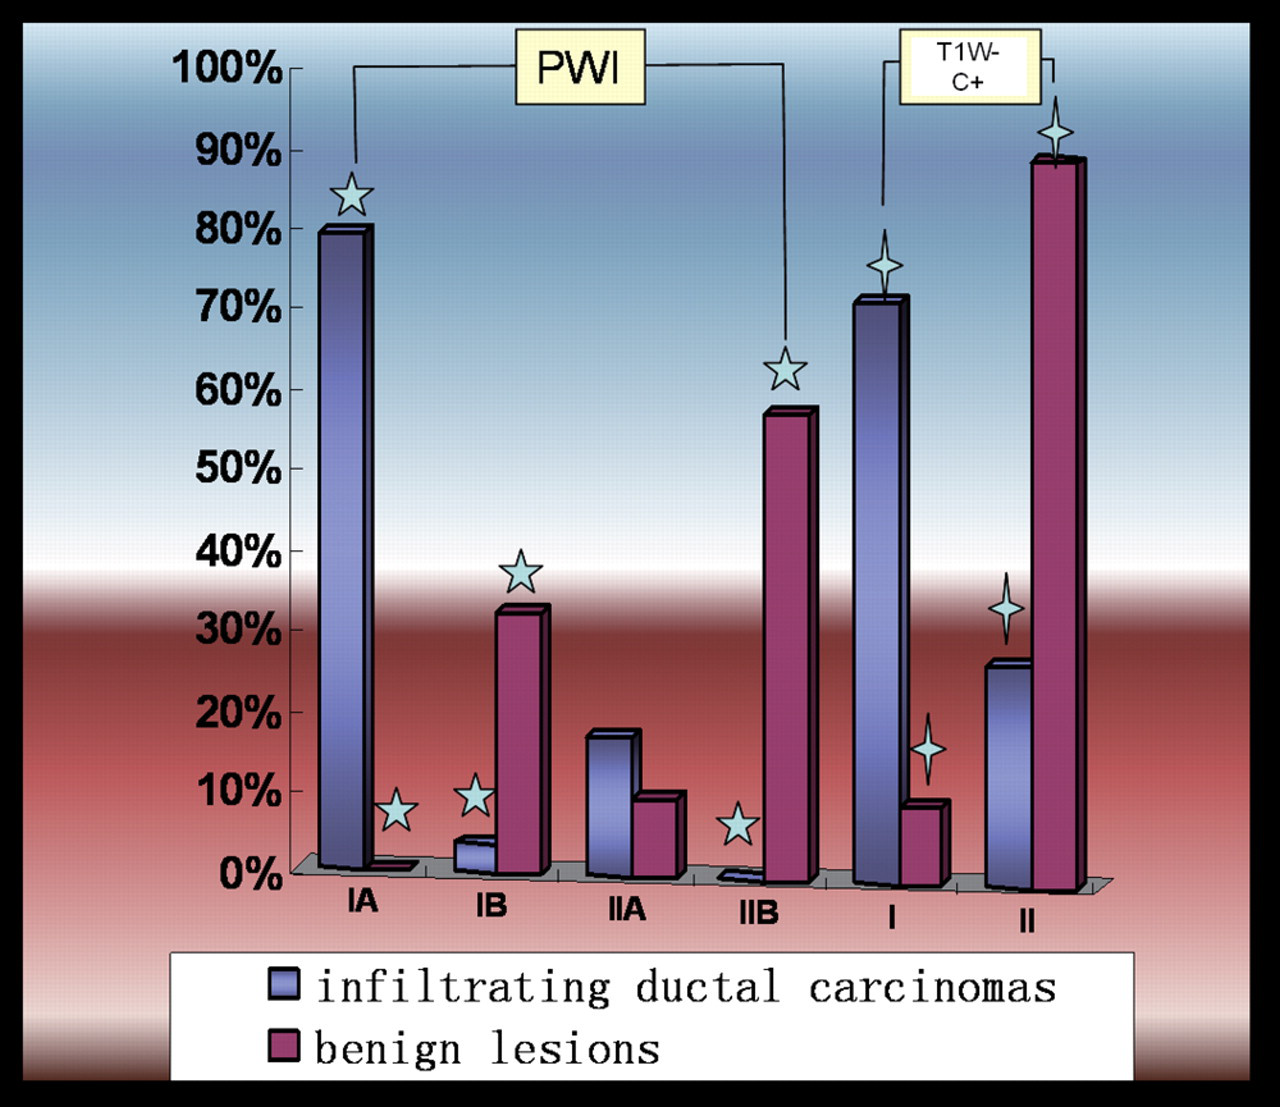
A histogram showing the classification system for T2*PWI and T1W-C+ between malignant breast tumors (infiltrating ductal carcinomas) and benign breast lesions. The stars on the columns denote significant differences between groups
The comparison of T2*-PWI and T1W-C+ between malignant and benign lesions
The above data show the classification results for T2*-PWI and T1W-C+ for malignant breast tumors (infiltrating ductal carcinomas) and benign breast lesions. The type I in T1W-C+ was without late enhancement and the type II in T1W-C+ was with late enhancement
T1W-C+ data
The T1W-C+ showed an increase of 168 ± 41.7% in the carcinomas and 127 ± 23.0% in the benign lesion. This difference was highly significant (P < 0.001) (Tables 2 and 4, Fig. 4). According to Kvistad and Daniel (7, 20), the delayed T1W-C+ sequences were classified into two types. Twenty-eight of 31 (90.3%) benign lesions but only eight of 29 (27.6%) malignant tumors demonstrated stable late enhancement (type II), the other was without late enhancement(type I) (Fig. 4 and Table 4). The difference in the type of T1W-C+ between the carcinomas and the benign lesions was highly significant (P < 0.001).
Sensitivity, specificity, and correlation of the MR diagnostic indicators
A comparison of the sensitivity and specificity between groups is presented below. With a fixed specificity of 93.5%, the MSIDR, IIR, and ADC differentiated breast carcinomas from benign lesions with sensitivities of 82.8%, 44.8%, and 86.2%, respectively. The cut-off values of ADC, MSIDR, and IIR were 1.65 ± 0.66 × 10⁻³ mm2/s, 31.0 ± 18.5%, and 147.1 ± 38.5% for carcinomas and benign lesions, respectively. Correlations of –0.906 (ADC) and 0.957 (MSIDR) with MVD were observed in breast carcinomas (2-tailed P < 0.01) (Fig. 5). A decrease in the DWI-ADC was correlated with an increase in MVD. An increase in T2 *PWI-MSIDR was correlated with an increase in MVD. In T2 *-PWI, subtypes Ia and IIb differentiated carcinomas from benign lesions with a sensitivity of 82.1% and a specificity of 64.3%. Furthermore, the Ib subtype demonstrated a sensitivity of 16.7% and a specificity of 66.7% in differentiating between carcinomas and benign lesions.

A comparison of cross-correlation functions (CCF) between MRI markers and MVD. Left figure shows that a decrease in DWI-ADC was correlated with an increase in MVD. Right figure shows that an increase in T2 *PWI-MSIDR was correlated with an increase in MVD
The ROC analysis (Fig. 6) revealed that T2 *PWI-MSIDR (area under curve (AUC) = 0.948) and DWI-ADC (AUC = 0.936) had significantly greater diagnostic value than IIR (AUC = 790) (both P < 0.001). The combination of functional MRI indicators, including DWI-ADC, T2 *-PWI- MSIDR and IIR, increased the ROC area to 1.0. The logistic regression analysis revealed that the most sensitive method (with a detection of up to 100%) for distinguishing carcinomas from benign lesions was attained with a multivariate model that included ADC, MSIDR, and IIR. ADC and MSIDR demonstrated the most differential power for diagnostic improvement.
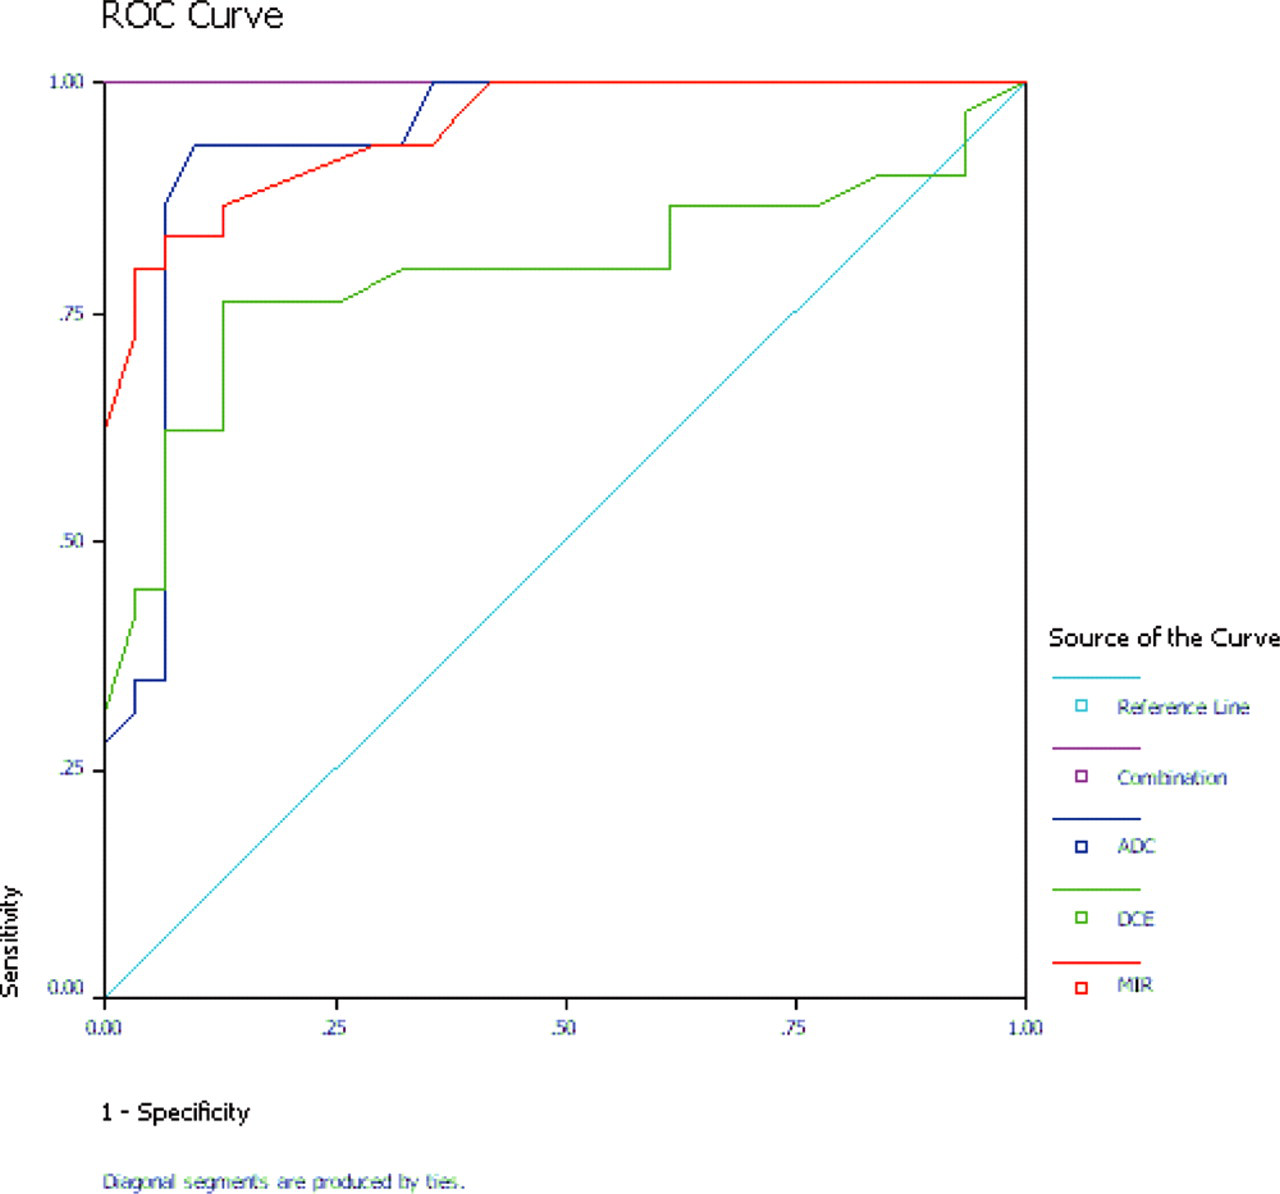
ROC plots for distinguishing breast carcinomas from benign lesions. MIR of T2 *-PWI, ADC of DWI and IIR along with the three markers combined in a multivariable model
Discussion
The following are the major findings from this study: (a) Among the fMRI techniques, DWIBS-ADC was the most sensitive and effective imaging modality, with a higher detectability of breast lesions than conventional MRI sequences; (b) T2 *-PWI-MSIDR was the most specific for the diagnosis of breast carcinoma. According to the T2 *-PWI curve with or without an end portion higher than the baseline, the T2*-PWI curves were classified into two subtypes (a and b), which was helpful in the differential diagnosis of carcinoma from benign lesions; (c) MSIDR, ADC, and IIR in combination improved the diagnostic value of fMRI in the differential diagnosis of breast carcinomas from benign lesions.
In many diseases, biochemical changes precede macroscopic structural abnormalities. Therefore, functional MRI markers, such as DWIBS-ADC and T2 *-PWI–MSIDR, might be more powerful than conventional MRI for screening, diagnosis, and staging in breast carcinoma (11, 22–24). The alterations of the mean diffusivity of water molecules in tissue can be measured in an ADC map acquired from the DWI sequence. In breast lesions, diffusion and perfusion both affect the ADC because of the molecular diffusivity of water and the blood microcirculation in the capillary network (3, 25). The ADC is reduced in malignancies compared with the corresponding value in benign tumors because of the denser cellularity of the malignancies (26, 27) and less extracellular space. In our study, the mean ADC of the breast carcinomas was less than that of benign lesions, which was similar to previous reports (3, 11, 16). There was a significant difference in the ADC between the carcinomas and the benign lesions.
Furthermore, the ADC among the tumors with contrast enhancement, lymph nodes, and the surrounding breast tissue was significantly different. The different ADCs among the different tissues made it possible to detect the lesion on DWIBS based on the diffusion mechanism (16). In an MIP of DWIBS, the breast tumors and lymph nodes with lower ADC values were recognized in a better fat suppression background. Until now, conventional T1W and T2W have shown limitations in the detection of small lesions because of the density of the breast parenchyma and low contrast resolution between the fibroglandular tissue and the breast lesion (28). In our study, DWIBS demonstrated a higher capacity to detect breast lesions than T1W and T2W (29, 30). These results imply that DWIBS might be a compensation sequence for detecting breast lesions in precontrast sequences.
On T2 *-PWI, a rapid and strong signal intensity loss is observed after a bolus injection of a gadolinium-based contrast agent for most breast carcinomas, which indicates high capillary perfusion and increased capillary permeability (7). In this study, we found that the MSIDR in carcinomas was significantly higher than that in benign lesions. Type I curves were mainly found in malignant tumors (82.5%), which was in accordance with a previous study (7). In our study, VEGF was more enriched in breast carcinomas than in benign lesions. There was also a significant difference in MVD between breast carcinomas and benign lesions. Breast carcinomas with higher vascularity and capillary diameter showed an increased fractional volume of the intravascular space compared with other tissues, which provides a biological explanation for the high-susceptibility effects observed using T2 *-PWI. The difference in the changes in T2 *-PWI was based on the difference in capillary permeability between breast carcinomas and benign lesions.
We obtained a T2 *-PWI curve with an increasing end portion in most of the benign lesions. According to this finding, we classified the T2 *-PWI curve into two subtypes. We determined that the overwhelming majority of benign lesions demonstrated an end portion that increased to above the baseline in the T2 *-PWI curve (subtype “b”). Gadolinium diethylene triaminepenta acetate (Gd-DTPA) shortens T1 and T2 in tissues and increases T2 * effects in the susceptibility sequence. As mentioned above, Gd-DTPA was widely distributed in malignant tumor tissues because of their large number of capillaries and the increased capillary permeability. Therefore, the effects of Gd-DTPA in shortening T2 and increasing T2 * played a major role in the diagnosis of malignant tumors in this study. However, in benign lesions, Gd-DTPA was mainly located in the capillaries during the first-pass perfusion and not in the tissue because of normal capillary permeability (31). In contrast to the malignant tumor, the shortened T1 affected the signal of the tissue much more than the short T2 effect using T2 *-PWI in the benign lesion, especially in the late stage of perfusion. Moreover, 90.3% of the benign lesions and only 27.6% of the malignant lesions demonstrated stable late enhancement in T1W-C+ (subtype II). Therefore, we determined that the subtype “b” curve in T2 *-PWI might be characteristic of benign lesions, which is in accordance with the modality of the Type II curves in T1W-C+. To our knowledge, subtype curves in T2 *-PWI have not been previously reported.
We observed a positive correlation between MSIDR and MVD. In addition, inverse correlations among MSIDR, MVD, and ADC were found. Lower ADC and higher MSIDR values were associated with higher MVD, which reflected the number of capillaries. DWI-ADC and T2 *-PWI-MSIDR were correlated with malignancy; therefore, they could potentially be used as a combined diagnostic tool to help differentiate carcinomas from benign lesions (32), which has not been previously reported. The IIR of T1W-C+ in differentiation carcinomas from benign lesions showed the lowest specificity among the fMRI markers, which was in agreement with previous data (11). The ROC analysis illustrated that the AUC for multiple markers in combination was the largest among all four of the curves. The combined specificity and sensitivity were higher than any of the individual measures.
In a previous study (7, 11), the intravenous bolus injection of gadodiamide was performed twice: once for T1W-C+ and once for T2*-PWI. In our study, to save the contrast medium, we designed a protocol in which T2*-PWI was immediately followed by T1W-C + ; therefore, we used one bolus injection of contrast medium. Our data indicate that the combined MR criteria of MSIDR in T2*-PWI and the delayed IIR in T1W-C+ can improve the specificity in the diagnosis of breast cancer. Therefore, a protocol with a single bolus injection of gadolinium-based contrast agents is feasible.
A limitation of our study was the low number of patients with breast tumors. Therefore, the statistical power of the fMRI modality findings may be insufficient. Second, the EPI sequences had some limitations, including motion-sensitive and eddy current artifacts. For these reasons, we excluded the images with artifacts. Moreover, a major limitation is that a kappa analysis was not performed. And we did not include lesions smaller than 0.5cm. These above limitations should be avoided in future data analyses.
In conclusion, we emphasize that DWIBS might compensate the conventional T1W and T2W for the detection of breast malignancies and lymph nodes before the administration of contrast medium. The Ib subtype in T2 *-PWI could provide additional diagnostic information for breast benign lesions. The combination of functional MRI indicators, including DWI-ADC, T2 *-PWI-MSIDR, and IIR of T1W-C + , could enhance the specificity and sensitivity of the diagnosis of breast lesions. These functional MRI modalities could be combined into one-stop examinations for high-risk patients with breast carcinomas in a single session. This one stop MRI protocol suggests the use of DWIBS as pre-contrast sequences, followed by T2 *-PWI and T1W-C+ as post-contrast sequences.