
Abstract
Background
No study to test the feasibility and prognostic value of the number of primary tumors, the number of positive lymph nodes, and the total number of tumors in the whole body as tumor burden measurements on FDG PET/CT imaging has been reported.
Purpose
To determine whether the number of tumors seen in 18F-FDG PET scans can be a prognostic factor in non-surgical patients with non-small cell lung cancer (NSCLC).
Material and Methods
One hundred and forty patients with histologically proven NSCLC and baseline 18F-FDG PET scan before therapy were identified in this retrospective analysis. The total number of tumors (TTn) in the whole body, the number of primary tumors (Tn), positive lymph nodes (Nn), and distant metastases (Mn), along with the maximum standardized uptake values (SUVmax) of the tumors were measured. Inter-observer variability of the total number of tumors, counted by two radiologists, was assessed. Survival analyses were performed to determine the prognostic value of the number of tumors.
Results
Concordance correlation coefficients for the TTn, Tn, Nn, and Mn were all greater than 0.85. TTn and Nn were strong prognostic factors of NSCLC patients' overall survival (OS). In univariate Cox regression models, gender, stage, TTn, Nn, and Mn were statistically significant factors (P = 0.016, 0.032, <0.001, <0.001, and 0.006, respectively). In multivariate Cox regression models, TTn and Nn remained as statistically significant predictors for survival with hazard ratios (HR) of 1.06 (P = 0.001) and 1.11 (P = 0.002), respectively, after adjusting for clinical stage based 7th edition of TNM staging system, age, gender, and SUVmax. Patients with a TTn ≤4 (cutpoint based on median value) had a median OS of 15.2 months compared with 9.0 months for those with TTn >4.
Conclusion
Measuring the number of tumors on FDG PET imaging is easy to perform with minimal inter-observer variability. The total number of tumors and number of nodal metastases, as metabolic tumor burden measurements in 18F-FDG PET/CT, are prognostic markers independent of clinical stage, age, gender, and SUV measurement in non-surgical patients with NSCLC.
Lung cancer is one of the most common malignant tumors in the world and the leading cause of cancer-related death for both men and women (1). Combined positron emission tomography with X-ray computed tomography (PET/CT) imaging with 2-deoxy-2-(18F)fluoro-D-glucose (18F-FDG) as an anatomical and metabolic imaging modality is considered the best non-invasive tool for diagnosing (2), staging, restaging, and treatment monitoring for lung cancer (3). There are a variety of clinical and pathologic factors that could be associated with prognosis of patients with NSCLC, such as disease stage, age, gender, tumor size, lymph node and metastatic status, and tumor differentiation (4). Among them, the “tumor, node, and metastasis” (TNM) staging system is widely used by oncologists to estimate prognosis and to choose the most suitable therapy (5). However, it cannot always explain the differences in survival of patients with NSCLC of same TNM stage. It is suggested that this system can be refined in order to improve its ability to predict survival for lung cancer patients (6). The metabolic tumor volume and total lesion glycolysis have been used to measure the whole-body metabolic tumor burden (7–9) and have been shown to be prognostic indices independent of TNM stages in NSCLC (10–13), small cell lung cancer (14), esophageal cancer (15), head and neck cancer (16–20), and thyroid cancer (21).
However, measuring whole-body metabolic tumor volume manually is time-consuming and clinically impractical unless this can be performed automatically by a computer program. The number of FDG positive distant metastases has been shown to be a useful prognostic index (22). To our knowledge, no study of the feasibility and prognostic value of the number of primary tumors, the number of positive lymph nodes, and the total number of tumors in the whole body as tumor burden measurements have been published.
This retrospective study was performed to determine the inter-observer variability in the calculation of the number of tumors and its prognostic value in non-surgical patients with NSCLC above and beyond the current clinical TNM staging system (7th edition of TNM staging system), and the widely used FDG maximum standard uptake measurement (SUVmax) (23), and other common prognostic factors such as age and gender.
Material and Methods
Patients
We conducted a retrospective review of the medical records of patients with NSCLC. There were a total of 816 cases with histologically proven NSCLC who were diagnosed and treated in our medical center from January 1, 2004 to December 31, 2007. A total of 140 non-surgical patients with histologically proven NSCLC were identified for this retrospective study from the database. The inclusion criteria were as follows: (a) all patients underwent a baseline PET/CT scan; (b) they had chemotherapy and/or radiation therapy but not surgery; (c) they had no known brain metastasis (since our whole-body PET/CT did not cover the whole brain); and (d) they had no history or concurrent diagnosis of another type of cancer. Those patients with no pre-therapy PET/CT were not eligible for this study.
These patients had been followed semi-annually by the Cancer Registry of our medical center. Their survival status was determined through clinical follow-up and the Social Security Death Index. Clinical follow-up and the Illinois State Death Inquiry System were used to determine the cause of death. This study was approved by the hospital's institutional review board and was compliant with the Health Insurance Portability and Accountability Act.
PET/CT imaging protocols
The 18F-FDG PET/CT images were obtained using a PET/CT scanner (Reveal HD, CTI, Knoxville, TN, USA) equipped with high-resolution bismuth germanate detectors and a dual-slice CT scanner in all 140 patients before therapy. The 18F-FDG PET scans were performed in accordance with National Cancer Institute guidelines (24). All patients fasted for at least 4 h before intravenous administration of 370–555 MBq of 18F-FDG. The plasma glucose levels of all patients were less than 200 mg/dL before FDG administration. A standard protocol was used for the CT images. Approximately 90±30 min following injection of the 18F-FDG, a whole-body static PET scan was acquired for about 30–35 min, starting at the thighs and proceeding to the head. PET scans were obtained with an acquisition time of 3–5 min per cradle position, with a slice overlap at the borders of the field of view to avoid artifacts. PET images were reconstructed using ordered-subsets expectation maximization (OSEM) iterative algorithms with eight subsets, two iterations, and 128 × 128 pixels. The slice thickness was 2.4 mm, the pixel size within transverse slices was 5.2 mm, and 5 mm full-width at half-maximum (FWHM) three-dimensional (3D) Gaussian smoothing was applied after reconstruction. We used the 3D imaging mode with Fourier rebinning and analytic scatter correction. Monthly concentration calibrations were conducted using a Ge-68 tub phantom.
Counting the number of tumors in the PET/CT images
Two board-certified radiologists (with more than 15 years and 25 years of experience, respectively) independently counted the number of tumors in the PET/CT images abiding by the following criteria: (a) a discrete focal area of increased activity greater than blood pool activity in the attenuation corrected PET images, with CT correlation; (b) if there was a cluster of tumors with no visible separation, it was considered as one lesion; and (c) extensive pleural metastases numbering more than 20 were recorded as 20. The numbers of the primary tumors (Tn), positive lymph nodes (Nn) and distant metastases (Mn) were the numbers of the T, N, and M tumors. The total number of tumors (TTn) was the summation of the Tn, Nn, and Mn. After statistical analysis of inter-observer variation, any disagreements in the tumor detection were reconciled by the radiologists looking at the cases together. Through discussion, the final consensus number of tumors was decided. Therefore, the final number of tumors for survival analysis was determined based on the two readers' consensus and was based on visual analysis. The attenuation corrected PET images, non-contrast CT images, and contrast CT images on our PACS (iSite; Philips, Cleveland, OH, USA), color-fused PET/CT images in coronal, sagittal, and axial planes and maximum intensity projection (MIP) images on MIMvista workstation (MIMvista Corp, Cleveland, OH, USA) were used for counting the number of tumors.
SUVmax measurement on PET/CT
The SUVmax of whole-body tumors were measured with the PET edge tool of the MIMvista software (MIMvista Corp, Cleveland, OH, USA) with manual adjustment (Fig. 1) by two board certified radiologists with PET/CT imaging experience, as well as familiarity with the MIMvista software. The SUVmax values were determined based on reader consensus and they were determined using semi-automated 3D measurements. In this study, the SUVmax was defined as (maximum activity concentration in the tumor)/(injected dose/body weight) (23). The whole-body SUVmax (WBSUVmax) was the maximum SUVmax of all the tumors in the whole body.
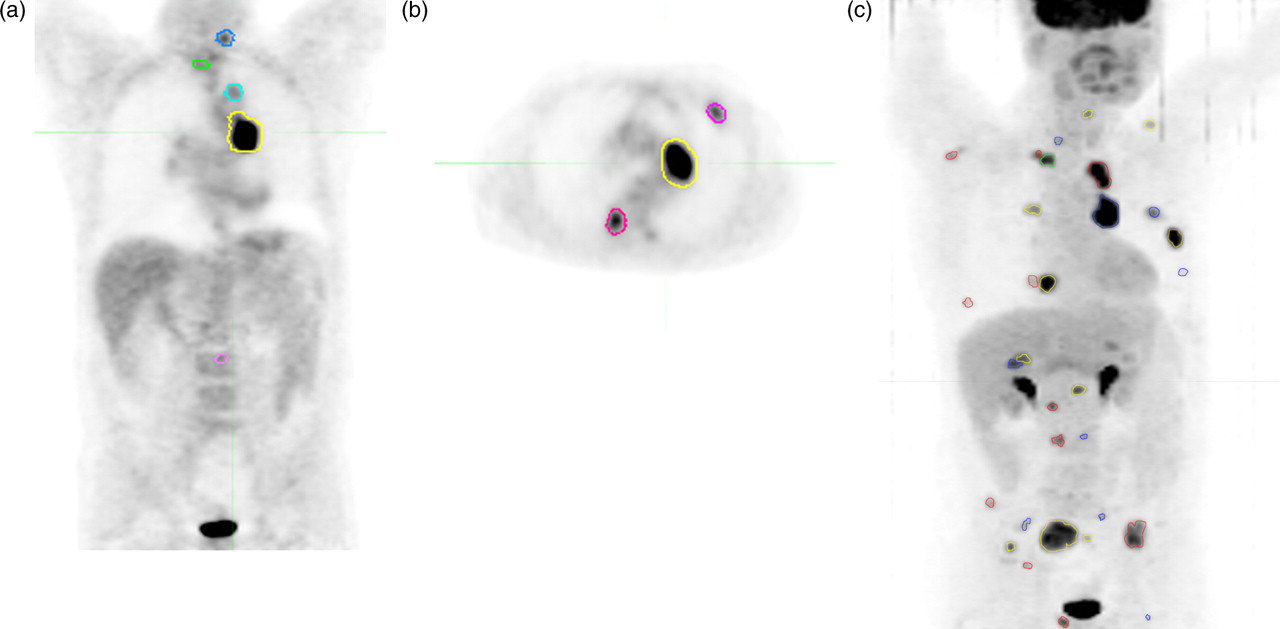
A 64-year-old man with a pathology proven non-small cell lung cancer presented for initial staging. The tumoral lesions are circled. Attenuation-corrected PET images on coronal (a) and axial planes (b). Maximum intensity projection (c)
The Union Internacional Contra la Cancrum (UICC)/American Joint Committee on Cancer (AJCC) staging system for NSCLC (7th edition) was used for staging patients (25). The clinical stage of the disease was based on patient's history, physical examinations, chest X-ray, infused CT, and PET/CT taken from his/her electronic medical charts. Brain MRI was done if clinical symptoms suggested brain metastasis. If the patients had mediastinoscopy, the mediastinoscopic findings superseded the imaging findings in mediastinal nodal staging.
Statistical analysis
Initially, inter-observer variability in the measurement of the number of tumors was assessed using concordance correlation coefficients (CCCs) and the Bland-Altman method.
Overall survival served as the primary endpoint of the study. The overall survival time was calculated from the initial PET/CT scan date to the date of death from any cause as determined based on the follow-up and records described above. Patients last known to be alive were censored at the date of last contact.
Survival differences between groups were examined and tested using the Kaplan-Meier method and the log-rank test. Univariate and multivariate Cox proportional hazards regression models were also used with hazard ratios and their 95% confidence intervals (CIs) reported. The proportional hazards assumption was tested using Schoenfeld residuals (26). A C-statistic index (Gönen and Heller's K concordance statistic) was used to assess the discriminatory performance of the models (27). A value of 1 indicates perfect discrimination, and a value of 0.5 indicates discrimination no better than chance. Standard error estimates and z tests for comparison of the C-statistics were based on 500 bootstrap replications. For descriptive purposes, continuous variables were dichotomized using the median value as the cut-off point (i.e. ≤ median versus > median). However, the primary analyses used these variables in their continuous form in Cox regression models. A natural logarithmic transformation was applied to obtain more normally distributed data for the WBSUVmax. A P value <0.05 was considered statistically significant. Stata Version 11.2 (StataCorp., College Station, TX, USA) was used for statistical analysis.
Results
Patient and tumor characteristics
There were 61 male and 79 female patients with a median age of 66.5 years (range 30–90 years) in this study. The 140 patients included 36 patients with adenocarcinoma, one patient with bronchioloalveolar carcinoma, seven patients with large cell carcinoma, 32 patients with squamous cell carcinoma, and 64 patients with NSCLC of a type that was not further specified. There were 20 cases with stage I or stage II, 50 with stage III and 70 with stage IV NSCLC. The mean time from PET/CT scan to therapy was 4.9 weeks with a standard deviation of 5.7 weeks for the 140 patients who had either chemotherapy only (46 patients), radiation therapy only (19 patients), or both chemotherapy and radiation therapy (75 patients). Median follow-up of the 24 surviving patients was 36.7 months (range 1.5–72.8 months).
Inter-observer agreement
The inter-observer agreement between the two radiologists on the number of primary tumors (Tn), positive lymph nodes (Nn), distant metastases (Mn), and the total number of tumors (TTn) are listed in Table 1.
Inter-observer agreement for number of primary tumors, nodal metastases, and distant metastases as well as total tumor number
CCC, Concordance correlation coefficient; CI, confidence interval; r, correlation coefficient; Tn, number of primary tumors; Nn, nodal metastases; Mn, distant metastases; TTn, total tumor number
TTn and Mn demonstrated a low inter-observer variability (CCC = 0.95, 95% CI 0.94–0.97; and CCC = 0.91, 95% CI 0.88–0.94, respectively) and inter-observer variability was a little higher for Nn and Tn (CCC = 0.86, 95% CI 0.82–0.90; CCC = 0.89, 95% CI 0.86–0.93, respectively). A simpler measure of agreement, the percentage of patients for whom the two observers agreed, was also calculated for Tn since a majority of patients had only one primary tumor. The percentage agreement for Tn was 96%. The Bland-Altman plot in Fig. 2 further illustrates the good inter-observer agreement for total number of tumors (TTn).

Bland-Altman plot indicates good agreement of TTn between two observers. The dashed horizontal lines represent the 95% limits of agreement. The solid horizontal line represents the mean difference between the two observers. TTn = total number of tumors
Univariate analyses
Median OS was 11.6 months with a 95% CI of 9.5–13.9. The survival rates at 2 and 4 years were 24.6% and 12.5%, respectively. In our study we detected 843 tumor lesions (including Tn = 171, Nn = 365, and Mn = 307). In univariate Cox regression models, gender, stage, TTn, Nn, and Mn were statistically significant factors (P = 0.016, 0.032, <0.001, <0.001, and 0.006, respectively), but age, ln( WB SUV max ), and Tn were not (P > 0.05) (Table 2). Results from log-rank tests were similar except for Mn which did not reach statistical significance (P = 0.111) (Table 2, Fig. 3).

Kaplan-Meier curves of overall survival grouped according to the number of tumors counted on baseline PET/CT in 140 non-surgical patients with stage I–IV non-small-cell lung cancer. The solid line indicates the group with the number of tumors at or below the median. The dashed line is the group with values above the median. (a) Total number of tumors, (b) number of primary tumors, (c) number of nodal metastases, and (d) number of distant metastases
The association of the overall survival with gender, age, stage, number of tumors, and SUVmax measurement of the tumors on PET/CT in 140 non-surgical patients with non-small-cell lung cancer
*P value from trend test
†Overall P value from trend test = 0.032
CI, confidence interval; HR, hazard ratio; ln, Natural log; Mn, distant metastases; NE, not estimable; Nn, nodal metastases; Tn, number of primary tumors; TTn, total tumor number
Multivariate analyses
The number of tumors (including TTn, Tn, Nn, and Mn), SUVmax, gender, age, and stage of disease were included in a series of multivariate Cox regression models to evaluate their joint effect on overall survival (Table 3).
Multivariate Cox regression analysis of overall survival in patients with non-small-cell lung cancer
*P value <0.05 compared to C-statistic from Model 1
C-statistic, Gönen and Heller's K concordance statistic; CI, confidence interval; Mn, distant metastases; Nn, nodal metastases; Tn, number of primary tumors; TTn, total tumor number
TTn and Nn remained as statistically significant predictors for survival with hazard ratios (HR) of 1.06 (P = 0.001, Model 2) and 1.11 (P = 0.002, Model 3), respectively, after adjusting for clinical stage, age, gender, and SUVmax (the model including Nn also adjusted for Tn and Mn). The C-statistic indices for Models 2 and 3 were 0.62 (95% CI 0.58–0.67) and 0.63 (95% CI 0.58–0.68), respectively. Each of these C-statistics was significantly higher than that for Model 1 which only included stage, age, gender, and SUVmax. Thus, number of tumors has significant predictive ability over and above that provided by standard factors such as age, gender, and stage. Of note, a sensitivity analysis was performed by dropping SUVmax from these models, and results were similar (data not shown).
Discussion
Inter-observer agreement on the number of tumors counted has not been evaluated previously. Our current study demonstrated high inter-observer agreement between two experienced radiologists in determining Tn, Nn, Mn, and TTn. The results suggest that counting the number of tumors is fairly independent of observer. However, the study was performed by highly experienced radiologists (>15 years and >25 years of experience), and only two radiologists performed the measurements. To draw firm conclusions regarding the inter-observer agreement, more radiologists with a greater range of experience should perform the measurements. Based on our experience, it is easy for radiologists to count the number of tumors. This is not time-consuming and, therefore, this method may be used routinely in clinical practice.
Studies on 18F-FDG PET/CT have shown its great value in the initial staging of NSCLC and in the later evaluation of the response to treatment (28–31). There are several parameters of FDG PET/CT measurements, such as SUVmax and metabolic tumor volume, which have been confirmed to be useful in NSCLC by several researchers (32).
In our study, the total number of tumors (TTn) and the number of nodal metastases (Nn) were prognostic indices independent of clinical stage of disease, SUVmax, age, and gender. We did not find a significant association between overall survival and number of primary tumors, which may be due to the fact that in most cases there was only one primary tumor. Although the association of the number of distant metastatic tumors with overall survival has been previously demonstrated in 42 patients with NSCLC (22), the association of the total number of FDG-positive tumors in the body and the number of FDG PET positive nodal metastases has never been reported. The difference in the 4-year survival rate was about 10% between those with high (5 or more) and low (≤4) numbers of total tumors in the body.
SUVmax is the commonly used and wildly debated PET measurement of 18F-FDG uptake in tumors (33–36). There are many factors affecting the SUV, such as a patient's body habitus, blood glucose level, length of uptake period, the partial volume effect, definition of region of interest (ROI), image reconstruction method, scatter correction method, and system resolution (37–40). Therefore the usefulness of the absolute SUV measurements in clinical practice is somewhat limited. It provides a semi-quantitative index of 18F-FDG uptake and is regarded as a suitable parameter for monitoring tumor response in FDG PET imaging (41, 42). As in this study, some studies have shown no significant correlation between SUVmax and survival (42).
There are several limitations to this study. First, in this study we may have underestimated the number of tumors because if there was a cluster of tumors with no distinct separation we counted the cluster as one tumor. Also, in our analysis of the number of tumors in the case of multiple plural metastases, four patients with more than 20 pleural metastatic nodules were recorded simply as having 20 tumors. This may have led to underestimation of Mn. Second, there were 31 patients who died of unknown causes, therefore disease specific survival analysis could not be performed. However, since NSCLC is a deadly disease, most of the non-surgical patients with NSCLC should have died of the disease, rather than some other cause. Therefore, the overall survival is expected to be quite close to disease specific survival. Also, the known limitations of 18F-FDG PET, i.e. predictable causes of false-negative and false-positive results, may affect the accurate measurement of the number of tumors (43). False-negative PET results may be due to small tumor size or low-grade tumor. False-positive results may be due to infection, inflammation, metabolically active brown fat, or granulomatous diseases, such as sarcoidosis, histoplasmosis, or tuberculosis. In this study and in our clinical practice, we read the PET/CT (attenuation-corrected, non-attenuation corrected, MIP and fusion images), as well as the diagnostic CT together, to try to decrease the false-negative and false-positive results.
In conclusion, measuring the number of tumors with FDG PET imaging is easy to perform with minimal inter-observer variability. The total number of tumors in the whole body (TTn) and in nodal metastases (Nn) as seen in 18F-FDG PET scans are prognostic markers of survival in non-surgical patients with NSCLC, independent of the clinical stage, age, gender and SUV measurement. Therefore, we anticipate that it could be used to further risk-stratify non-surgical patients with NSCLC, both in clinical practice and clinical trials.
Footnotes
ACKNOWLEDGMENT
The authors gratefully acknowledge the helpful comments and editorial assistance of Dr Bill C Penney.