
Abstract
Background
Spin-lattice relaxation in the rotating frame, or T1ρ relaxation, is normally described by a mono-exponential decay model. However, compartmentation of tissues and microscopic molecular exchange may lead to bi-exponential or multi-exponential T1ρ relaxation behavior in certain tissues under the application of spin lock pulse field strength.
Purpose
To investigate the presence of bi-exponential T1ρ relaxations in in-vivo rat head tissues of brain and muscle.
Material and Methods
Five Sprague-Dawley rats underwent T1ρ imaging at 3T. A B1-insensitive rotary echo spin lock pulse was used for T1ρ preparation with a spin lock frequency of 500Hz. Twenty-five T1ρ-weighted images with spin lock times ranging from 1 to 60 ms were acquired using a 3D spoiled gradient echo sequence. Image intensities over different spin lock times were fitted using mono-exponential as well as bi-exponential models both on region-of-interest basis and pixel-by-pixel basis. F-test with a significance level P value of 0.01 was used to evaluate whether bi-exponential model gave a better fitting than mono-exponential model.
Results
In rat brains, only mono-exponential but no apparent bi-exponential T1ρ relaxation (∼70–71 ms) was found. In contrast, bi-exponential T1ρ relaxation was observed in muscles of all five rats (P < 10−4). A longer and a shorter T1ρ relaxation component were extracted to be ∼37– ∼ 41 ms (a fraction of ∼80– ∼88%) and ∼9– ∼11 ms (∼12–20%), compared to the normal single T1ρ relaxation of ∼30– ∼ 33 ms.
Conclusion
Bi-exponential relaxation components were detected in rat muscles. The long and the short T1ρ relaxation component are thought to correspond to the restricted intracellular water population and the hydrogen exchange between amine and hydroxyl groups, respectively.
Spin-lattice relaxation in the rotating frame (T1ρ relaxation), is an MR relaxation mechanism that represents the transverse magnetization decay during the application of a continuous wave (CW) radiofrequency (RF) pulse, i.e. spin lock (SL) pulse, aligned with the net magnetization vector (1). T1ρ relaxation has high sensitivity to molecular motions and exchanges that have correlation times (τ) such that τ · FSL ∼1, where FSL is spin lock frequency, equivalent to the resonant frequency at the spin lock pulse field strength (B1SL) according to the Larmor equation, i.e. FSL = γ · B1SL (2). Here γ is the gyromagnetic ratio. As FSL reduces and approaches zero, the transverse magnetization relaxes without the application of any external RF pulse field. In this case, T1ρ relaxation is identical to the normal T2 relaxation (1) (or T2 * relaxation for gradient echo sequences in the presence of field heterogeneities). Although T2 relaxation can be traditionally well described with a mono-exponential decay model in many in-vivo tissues, there have also been many reports on the multi-exponential decay, especially bi-exponential decay, of T2 relaxation in nature (3–7). This multi-exponential or bi-exponential decay is generally interpreted in terms of the macroscopic anatomical multi-compartments of tissue water having intrinsically different T2 relaxation times. In a bi-exponential T2 relaxation model, the observed short and long T2 relaxation components represent anatomical compartmentation of tissue water, probably intracellular versus extracellular (4). In a multi-exponential T2 relaxation model, at least one more relaxation component with a very small T2 value (<10 ms) has been found and attributed to hydration shell of macromolecules (7). As T1ρ relaxation approaches to T2 relaxation at very low spin lock frequencies, it is rational to hypothesize that T1ρ relaxation may behave similarly as T2 relaxation so that multi-exponential or bi-exponential decay could also be found in T1ρ relaxation. Actually, the mono-exponential T1ρ relaxation could be considered as a single one-compartment model in which the relaxation rate is determined by the fluctuating local magnetic fields of dipolar interactions between protons (8). This one-compartment model becomes inadequate when used to describe more complex tissues where different proton compartments exist and interact with each other. Thus a two-compartment model may be helpful to better describe the free water proton (e.g. extracellular) and the constraint water proton (e.g. intracellular), as well as the interaction between them. Accordingly, an apparent mono-exponential T1ρ relaxation component could be possibly split into two bi-exponential T1ρ relaxation components. This possible bi-exponential relaxation characteristic may help us to explore the underlying biophysical mechanism for T1ρ relaxation. For this purpose, this study aims to investigate the feasibility and capability to observe the possible bi-exponential T1ρ relaxation in in-vivo rat tissues by using low frequency spin lock imaging. T1ρ imaging has been used in many clinical applications, such as intervertebral disk degeneration (9–11), cartilage degeneration in osteoarthritis (12–16), neurologic diseases (17–20), muscle diseases (21), and liver fibrosis (22–24). This study may also be helpful for the better understanding of the T1ρ contrast formation, as well as the underlying correlation of diseases with T1ρ relaxation.
Material and Methods
MRI experiments
Five male Sprague-Dawley rats weighting 200–250 g were scanned under the ethical approval by the local Animal Experimentation Ethics Committee. Spin lock imaging was performed on a Philips Achieva 3T clinical scanner (Philips Medical Systems, Best, The Netherlands) using a T1ρ prepared 3D spoiled gradient echo sequence. A custom-designed 6-channel receive-only rat head coil with an inner diameter of 5 cm was used for signal acquisition. Rats were anesthetized with a combination of xylazine (10 mg/kg) and Ketamine (90 mg/kg). After anesthesia, animals were positioned prone for scanning. A B1-insensitive rotary echo spin lock pulse was used for T1ρ preparation (25), subsequent to a spectrally selective RF pulse for fat suppression. Spin lock time series of 1 ms, 2.5 ms to 60 ms with an increment of 2.5 ms were applied (i.e. 25 TSLs in total) and the spin lock field strength was 11.74 µT, equivalent to a spin lock frequency of 500 Hz. Primary imaging parameters included: TR/TE, 7.2/3.5 ms; flip angle, 30°; shot length, 40; isotropic pixel size, 0.3 mm; matrix size, 160 × 160; slices, 6; and slice thickness, 2 mm. Number of excitation (NEX) of four was used to achieve sufficiently high signal-to-noise ratio (SNR) for accurate T1ρ fitting. A centric phase-encoding order was applied to minimize the influence of spin lock signal variation over the echo train on the T1ρ-weighting contrast. A sensitivity encoding factor of two was used to reduce phase encoding numbers to shorten the scan time. A dummy delay time of 5000 ms for equilibrium magnetization restoration was inserted after each segmented shot acquisition prior to the next T1ρ magnetization preparation. The total acquisition time was around 30 min. The diagram for the rotary echo spin lock pulse and the T1ρ prepared FFE sequence is shown in Fig. 1.
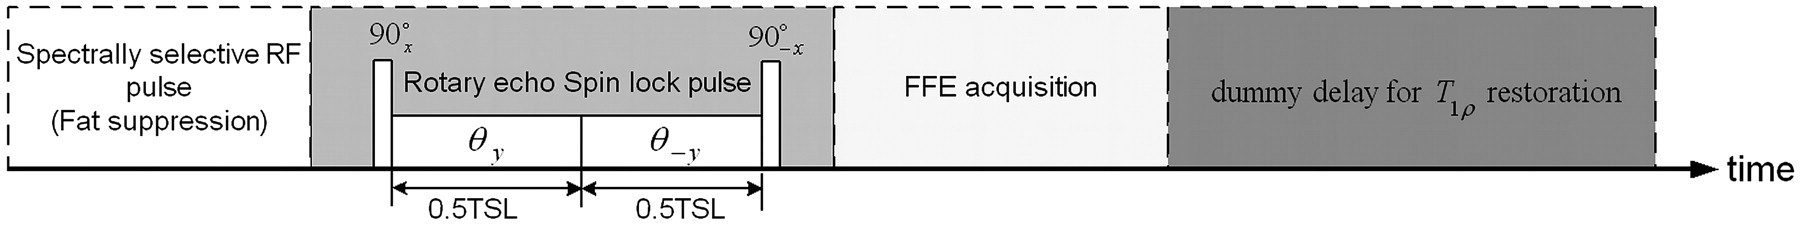
The rotary echo spin lock pulse and the pulse sequence schematic for T1ρ imaging
Data analysis
Acquired images were processed off-line using Matlab version 7.9.0 (The MathWorks, Inc. Natick, MA, USA,) numerical programs.
First, SNR was measured on the T1ρ-weighted images acquired at different TSLs. A signal region-of-interest (ROI) was drawn as an 8 × 8 (pixel) square in a representative brain region and in a muscle region that both had relatively homogenous image intensities, respectively. The noise ROI was drawn as an identical size square in the image background that was sufficiently far away from brain and muscle tissues. SNR was calculated by the mean intensity of the signal ROI divided by the standard deviation of the intensity in the noise ROI.
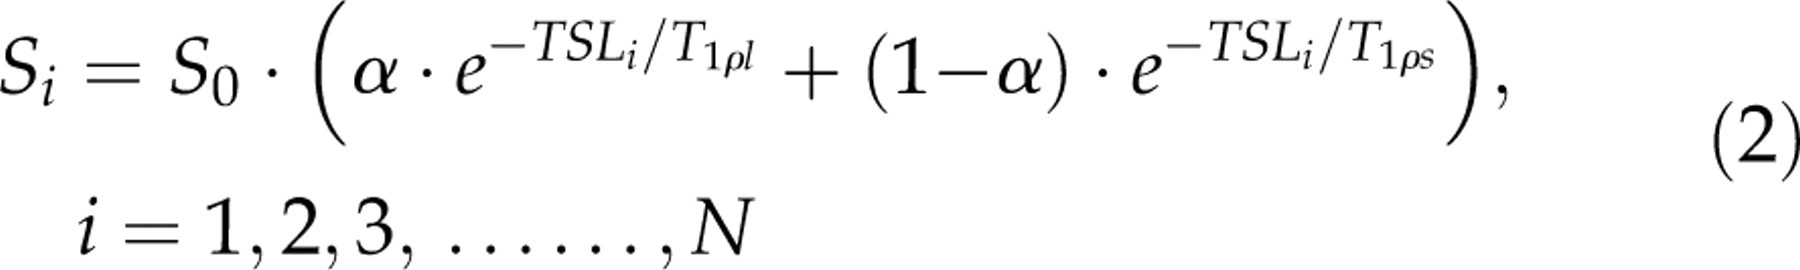
Mean image intensities with different N TSLs were fit by the mono-exponential model (Equation 1) and the bi-exponential model (Equation 2) using the non-linear least square fitting method based on Levenberg-Marquardt algorithm in the selected regions-of-interest (ROIs) in the rat brain and muscle, respectively.

To justify the validity of the bi-exponential fitting results, the following criteria were set to exclude the bi-exponential fit results if: (a) T1ρl > 500 ms; (b) T1ρs < 1 ms; (c) either T1ρl or T1ρs is negative; or (d) | T1ρl – T1ρs| < 0.02T1ρl. In the cases of (a–c), the fitting results might not be reasonable physiologically. In the case of (d), it would be a false bi-exponential fitting as both T1ρl and T1ρs were almost identical to the single T1ρn without improvement in goodness-of-fit.
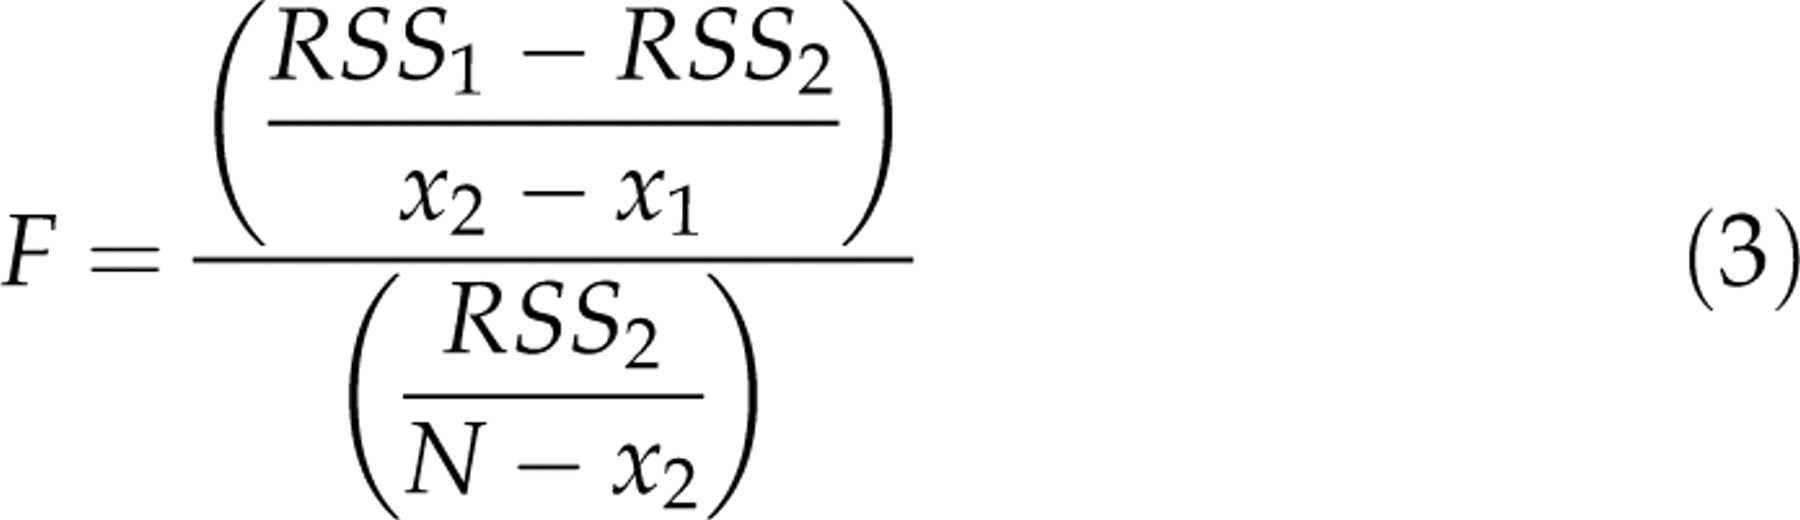
The residual sum of squares (RSS) by using mono-exponential and bi-exponential fitting was also calculated and compared. In order to evaluate whether the bi-exponential model gave a significantly better fit than the mono-exponential model, an F-test was performed and a significance level (P value) of 0.01 was applied (26). With N data points to estimate parameters for two models, then the F-ratio is given by
Pixel-wise mono-exponential and bi-exponential fitting were also performed. Specifically, pixel-by-pixel maps of T1ρn and residual sum of squares RSS mono were generated through mono-exponential fitting. Maps of T1ρl, T1ρs, fraction of long relaxation (α), fraction of short relaxation (1-α), and RSS bi were generated through bi-exponential fitting. Pixels with F-test P values larger than 0.01 were excluded from bi-exponential mapping. Other exclusion criteria as described above were also applied. For RSS mapping, the pixels associated with the RSS value larger than 640 (a threshold value selected to remove the poor fitting pixels) were excluded. The absolute RSS difference map between RSS mono and RSS bi was also calculated to compare the goodness-of-fit of mono- and bi-exponential fitting. Spearman rank-order correlation was performed to assess the relationship between the bi-exponential relaxation times T1ρl, T1ρs, and the mono-exponential relaxation time T1ρn. The correlation was considered weak if the absolute value of Spearman rank-order correlation coefficient was smaller than 0.5.
Results
Fig. 2 shows T1ρ-weighted in-vivo brain images of rat one acquired at all TSLs from 1 to 60 ms. Sb, Sm, and N in Fig. 3a denote the ROI in brain, muscle, and noise background, respectively. The average SNRs for five rats were 318.2 ± 21.3 and 138.5 ± 12.5 in the brain, and 382.4 ± 17.2 and 71.1 ± 7.4 in the muscle for TSLs at 1 ms and 60 ms, respectively.

T1ρ-weighted images of in vivo rat brain acquired at all TSLs from 1 to 60 ms

(a) Rat head T1ρ-weighted image acquired at the TSL of 1 ms. Sb and Sm are the region-of-interests (ROIs) in the brain and muscle with a size of 8 × 8 (pixel), respectively. The noise ROI N was drawn as an identical size square in the image background sufficiently far away from brain and muscle tissues. (b) The fitting results in the brain ROI. No evident bi-exponential relaxation component was found; (c) the fitting results in the muscle ROI. A longer (39.45 ms) and a shorter (9.15 ms) bi-exponential relaxation component than the normal T1ρ of 33.50 ms were found with different fractions
The fitting results of the brain ROI and the muscle ROI by using the mono-exponential model and bi-exponential model are illustrated in Fig. 3b and c, respectively. The fitting statistics for the muscle ROI are also listed in Table 1. As shown in Fig. 3b, results of bi-exponential fitting were almost identical to mono-exponential fitting in the brain ROI, i.e. T1ρn ≈ T1ρl ≈ T1ρs and α ≈ 1–α ≈ 50%. The RSS values for both mono- and bi-exponential fitting were 48.14. An F-ratio of 1.52 × 10⁻⁷ and a P value of 1 (≫0.05) were obtained, indicating no significantly better fitting by the bi-exponential model. In contrast, the bi-exponential fitting in the muscle ROI (Fig. 3c) produced two apparently different components of T1ρl (39.45 ms) and T1ρs (9.15 ms) from the T1ρn (33.50 ms) obtained by the mono-exponential fitting. The fractions of T1ρl and T1ρs were 80.38% and 19.62%, respectively. The RSS value for bi-exponential fitting was 22.91, much smaller than the corresponding RSS value of 132.52 for mono-exponential fitting. F-test produced an F-ratio of 35.01 in the muscle ROI that corresponded to a P value smaller than 1 × 10⁻⁴, indicating a significantly better fitting by the bi-exponential model.
Statistics of the data fitting in the muscle ROI of rat 1
Fig. 4 shows the parameter maps generated by the pixel-by-pixel mono-exponential and bi-exponential fitting. The first row in Fig. 4 shows the T1ρ-weighted image acquired at TSL of 1 ms, T1ρn map, and RSS mono map from left to right. The second row shows T1ρl map, T1ρs map (both overlaid on the gray T1ρn map) and RSS bi map generated by the bi-exponential mapping. The third row shows the maps of the percentage of the long relaxation (100 × α) and the short relaxation (100 × (1–α)), also overlaid on the gray T1ρn map, as well as the absolute RSS difference map of |RSS mono – RSS bi |. More than 80% of muscle pixels showed significantly better fit by the bi-exponential model. The fraction of the long relaxation component was generally larger than the short relaxation component in the muscle. As comparison, only less than 10% of brain pixels showed bi-exponential relaxation. The absolute RSS difference map also showed that the RSS values by using mono- and bi-exponential mapping within the brain were very close, whereas bi-exponential model gave much better fitting within the muscle with much smaller RSS values than the mono-exponential model. The Spearman rank-order correlation coefficients for T1ρn and T1ρl, as well as for T1ρn and T1ρs, were 0.37 and 0.08, respectively, indicating a relatively weak positive correlation between the mono- and bi-exponential relaxation times.
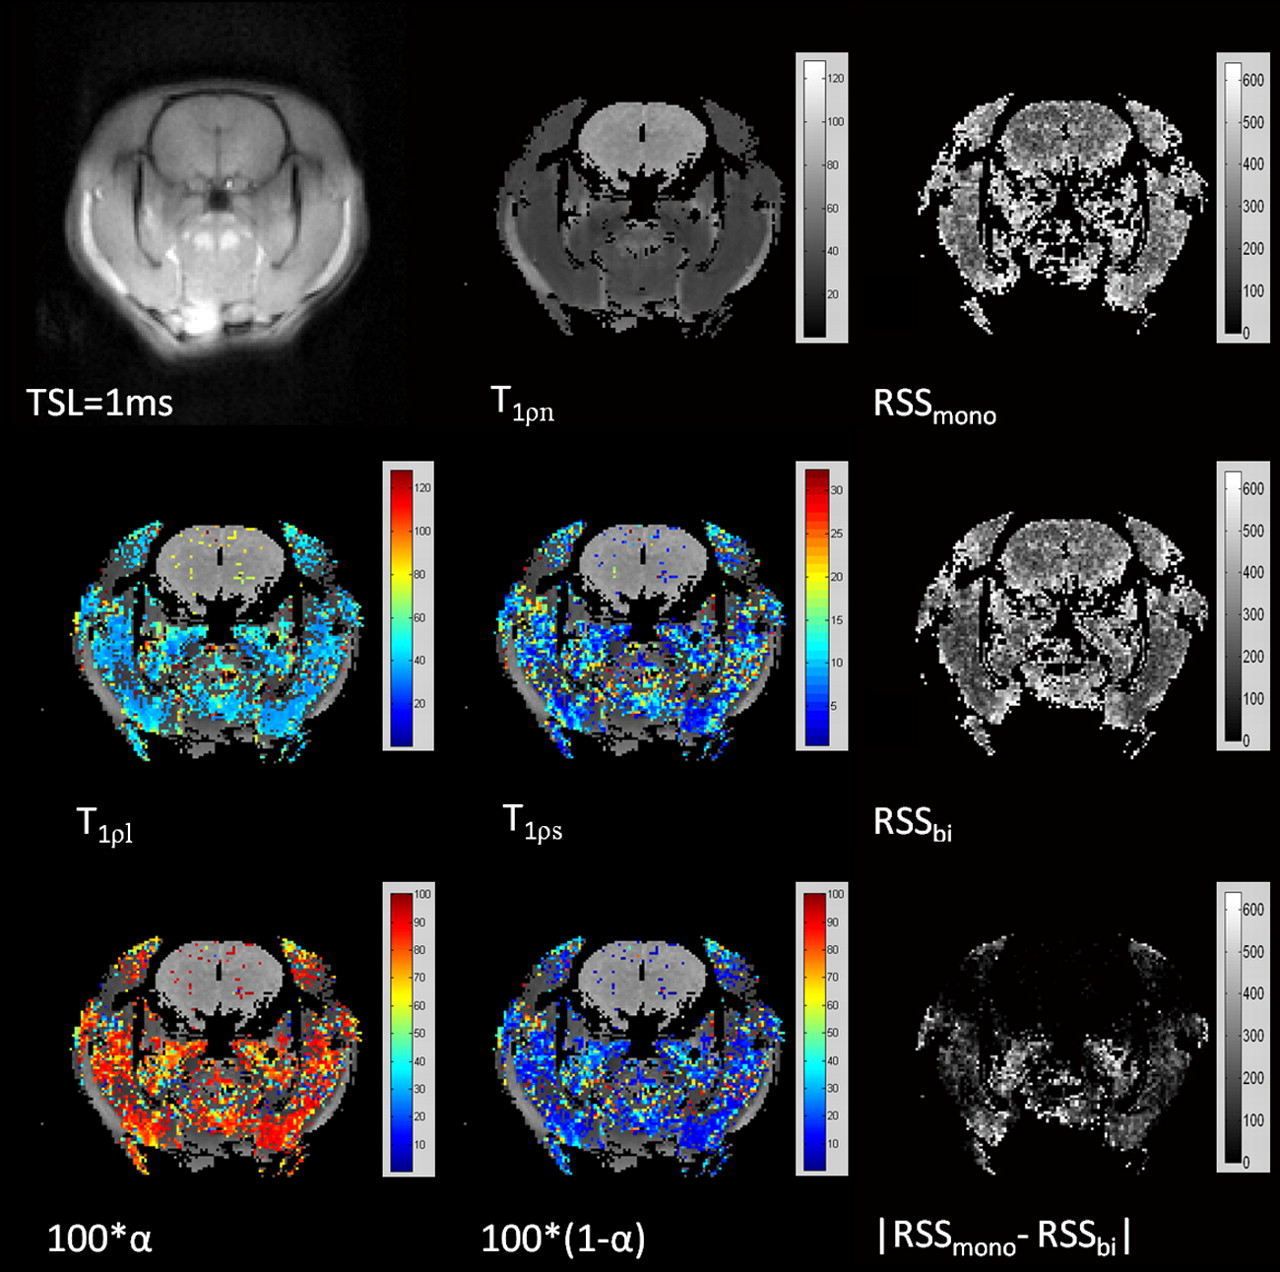
Pixel-by-pixel maps generated by the mono-exponential and bi-exponential fitting, respectively. More than 80% of muscle pixels show bi-exponential relaxation. The fraction of the long relaxation component is generally larger than the short relaxation component. The residual sum of squares (RSS) in muscle is much smaller by using bi-exponential fitting than mono-exponential fitting in muscle while the RSS is comparable in brain
For the other four rats, apparent bi-exponential relaxations were found in over 80% of the muscle pixels with significantly better fitting (P < 1 × 10⁻⁴). On the other hand, less than 10% of the brain pixels showed better bi-exponential fitting. The fitting statistics of all five rats are summarized in Table 2.
Statistics of the fitting for all five rats
Data are reported as mean ± SD
Discussion
In this study, feasibility and capability of finding bi-exponential T1ρ relaxation components from in-vivo rat brain and muscles by using low frequency spin lock imaging at 3T were investigated. A longer relaxation component T1ρl and a shorter relaxation component T1ρs than the normal mono-exponential relaxation time T1ρn were observed in the rat muscle but not in the rat brain.
A large number of data points, high spatial resolution, and high SNRs are generally desirable for bi- and multi-exponential model fitting and analysis (6). However, as T1ρ imaging is quite time-consuming, these factors had to be compromised within the allowable scan time in practice. A dedicated rat brain coil and a NEX of four were used to maximize SNR. As many as 25 TSLs were used in this pilot study in order to ensure the accurate and reliable mono- and bi-exponential fitting, although 5–6 TSLs would be sufficient for normal mono-exponential T1ρ imaging and mapping. In the future, the number of TSLs could be reduced to shorten the acquisition time for bi-exponential mapping in practical use.
The analysis based on both ROI fitting and pixel-by-pixel mapping justified the reliability of the presence of bi-exponential relaxation in the muscle. In previous studies, bi-exponential fitting was usually performed based on ROI or non-spatial-selective volume. However, the averaging in the ROI or volume may cancel out the heterogeneity in pixels. F-test and a small critical P value of 0.01 were adopted in this study to evaluate the statistically significant improvement of the goodness-of-fit by using the bi-exponential model. Careful exclusion criteria were also set to eliminate false and unreasonable bi-exponential fitting results effectively. The narrow 95% confidence intervals and no overlap of T1ρl and T1ρn ensured the validity and reliability of the bi-exponential T1ρ relaxation. The small Spearman rank-order correlation coefficient values indicated that T1ρl and T1ρs should be quite independent of T1ρn, and may reveal information of the tissue intrinsic features beyond T1ρn.
According to Zimmerman-Brittin relaxation model (27), if a sample placed in a magnetic field is comprised of a finite number of compartments, each of them can be characterized by a single relaxation component. If the exchange of molecules between the compartments is slow compared to the relaxation times, the overall relaxation curve could be expressed by a multi-exponential model and individual relaxation time could be extracted. As T1ρ relaxation approximates the normal T2 relaxation at low FSLs, the interpretation of bi-exponential T1ρ relaxation may refer to the macroscopic anatomical multi-compartments of tissue water and the slow exchange between them. Previous delicate high-SNR T2-spectra acquired by Carr-Purcell-Meiboom-Gill sequences have shown at least three T2 relaxation components with values approximately <10 ms, 25–45 ms and >100 ms, and the corresponding fractions of ∼10%, around 80%, and ∼10%, respectively (4, 7). These three components have been attributed to the hydration shell of macromolecules, intracellular water, and extracellular water, respectively (4, 7, 28). Our observation of T1ρl (∼37–41 ms) with the fraction around 80% in muscle was analogous with the intracellular water T2 and its corresponding fraction in the study of multi-exponential T2 relaxation. On the other hand, T1ρ relaxation is different from T2 relaxation due to the presence of the spin lock pulse with a μT-level B1 field strength, which makes it sensitive to molecular motions that have correlation times (τ) such that τ · FSL ∼ 1. Spin lock pulses refocus relaxation effects of slow exchange processes, so that T1ρ contrast is more sensitive to intermediate and fast processes than T2. Despite the refocusing effect of spin lock pulses on slow relaxation components, even longer T1ρ relaxation component (like the T2 component over 100 ms), might also be observed by using longer TSLs. However, this leads to the T1ρ-weighted images with very low SNRs and the allowable specific absorption rate (SAR) could be exceeded, making it impractical for clinical use. On the other hand, the high sensitivity of T1ρ to fast exchange processes leads to the observation of a very short bi-exponential relaxation component T1ρs (∼10 ms) with the fraction of around 10 ∼ 20%. Although the short T2 component (<10 ms) found in the previous studies was attributed to the hydration shell of macromolecules (4, 7, 28), it could not be straightforwardly used for the attribution of the short bi-exponential T1ρ component because the residence time of water molecules in the hydration layer may be too short (in the micro-to-picosecond range) (8) to be detected by a spin lock pulse at 500 Hz. Alternatively, it has been known that hydrogen exchange from amine (NH+) and hydroxyl (OH−) groups to water is of importance in low frequency water T1ρ relaxation or dispersion (2). We thus speculate this short bi-exponential relaxation component T1ρs may associate with the fast hydrogen exchange between amine and hydroxyl groups at low frequencies. This speculation remains to be explored by the investigation of bi-exponential T1ρ dispersion with spin lock frequency in the future. It is worth noting that the observed bi-exponential T1ρ relaxation in this study could not be caused by fat and water compartments in that fat signal was suppressed in this study. As indicated in the literature (25), partial volume effects seem to be of minor significance in the observation of bi-exponential relaxations. The argument that the bi-exponential relaxation may be induced by the noise can also be rejected for the following reasons. First, the SNRs for T1ρ-weighted images should be sufficiently high for accurate extraction of bi-exponential components (6, 7). Second, pixel-by-pixel bi-exponential T1ρ maps showed relatively homogeneous and consistent T1ρl and T1ρs values rather than the random distribution of bi-exponential relaxations. Finally, rat brains showed comparable SNRs while no bi-exponential T1ρ relaxation was found.
Absence of observable of bi-exponential T1ρ relaxation in rat brain, including both gray matter and white matter, is consistent with the similar mono-exponential findings in a study of human brain T2 relaxation (25). However, no observation of bi-exponential T1ρ relaxation in rat brain in this study cannot completely exclude the possible presence of such bi-exponentiality due to some limiting factors in the experiments. Although dipolar interaction of water could be more efficient in ordered tissues like muscles and contributes to bi-exponential relaxation, it may not be sufficient to explain the no observation of bi-exponentiality in the white matter that is also highly anisotropic. In this case, the specimen orientation must be considered with respect to the spin lock field as well as B0 direction. The smaller sizes of fiber tracts and their more complicated orientations in rat brain may be canceled out within the macroscopic voxel size and hence lead to the mono-exponentiality of T1p as observed. In addition, as T1p is about 100% longer in brain than in muscle, a much smaller part of the total relaxation curve sampled in brain obtained with the longest spin lock time of 60 ms may also hinder the detection of the longer bi-exponential relaxation component in the brain. Unfortunately, the use of longer spin lock times was not allowed in our experiments performed on clinical MRI scanners due to the RF amplifier and SAR restriction. On the other hand, the lack of shorter T1ρ relaxation in brain may indicate the faster hydrogen exchange rate in brain than in muscle, which may require the use of even higher spin lock frequencies, but associated with higher SAR. Therefore, the detection of T1ρ bi-exponentiality in brain is yet to be further explored in future studies, preferably on a dedicated animal scanner.
In conclusion, bi-exponential T1ρ relaxation components were observed in in-vivo rat muscles at 3T using low frequency spin lock imaging at 500 Hz. The long and the short T1ρ relaxation component are speculated to correspond to a restricted intracellular water population and the hydrogen exchange between amine and hydroxyl groups, respectively. No apparent T1ρ bi-exponentiality was observed in rat brains. It is still unclear whether this finding reflects the true absence of bi-exponential T1ρ in rat brains, or is restricted by the experiment limitations. Therefore, further investigations are warranted. This study of bi-exponential T1ρ relaxation should be helpful for better understanding of T1ρ contrast formation and tissue characterization.
Footnotes
ACKNOWLEDGEMENTS
This work is supported by Hong Kong ITF grant ITS-021-10 and partially supported by grants CUHK475911 and SEG_CUHK02 from the Research Grants Council of the Hong Kong Special Administrative Region, China.