
Abstract
Background
Radiological discrimination of histologic subtypes of small peripheral adenocarcinoma of the lung is clinically important. Although there are many articles in which CT findings were used for this purpose, there are only a few reports on the capability of FDG PET-CT findings for histologic classification of this tumor.
Purpose
To investigate the correlation between visual assessment or maximum standard uptake values (SUVmax) on F18-FDG PET-CT and histology grading of small peripheral adenocarcinoma of the lung.
Material and Methods
Proportions of positive PET-CT diagnoses and SUVmax were retrospectively reviewed on 96 solitary pulmonary nodules of ≤2 cm in 90 consecutive patients. Tumors were classified into four groups according to Noguchi's classification (group 1 [n = 10], atypical adenomatous hyperplasia and type A tumors; group 2 [n = 12], type B tumors; group 3 [n = 42], type C tumors; group 4 [n = 32], types D, E, and F tumors). Proportions of positive PET-CT diagnoses and mean SUVmax of lesions among four groups were compared using trend tests to examine if there is a significant linear correlation with the progression of the histology grading of tumors. Then, an optimal threshold of SUVmax was proposed to best discriminate tumors of poor (groups 3 and 4) from good (groups 1 and 2) prognosis.
Results
There was a significant linear trend for both visual assessment (P < 0.01) and SUVmax (P < 0.01). A SUVmax of 0.42 showed the highest accuracy of 84% with 95% sensitivity and 50% specificity for predicting tumors of poor prognosis. A SUVmax of 2.05 showed 100% specificity with 49% sensitivity, and 60% accuracy. Positive visual diagnoses showed accuracy of 83% with 90% sensitivity and 59% specificity.
Conclusion
Visual assessment and SUVmax on PET-CT correlated well with the histology grading of small peripheral adenocarcinoma of the lung.
Lung cancer is the most common cancer in the world and the leading cause of cancer deaths in industrialized countries. According to the most recent global cancer statistics in 2010, lung cancer is the most common and the leading cause of cancer death in both men and women (1). Regarding the histology of lung cancer, a notable shift has recently occurred in the incidence rates of histologic subtypes of lung cancer. After steady increase in incidence since 1973, adenocarcinoma (30.7% of all cases) has replaced squamous cell carcinoma (30%) as the most frequent histologic subtype of lung cancer in the latest two decades (2). This overall increase of adenocarcinomas is largely due to a dramatic increase in adenocarcinomas with pure lepidic growth (formerly bronchioalveolar carcinoma [BAC]).
Noguchi et al. (3) classified peripheral adenocarcinoma of the lung of ≤2 cm into six types A-F based on the tumor growth pattern and demonstrated that this tumor classification correlated well with the prognosis of the tumors. Among the subtypes, types A, B, and C tumors showed a lepidic tumor growth, whereas types D, E, and F demonstrated a destructive tumor growth. The researchers reported that the prognosis of cases of types A and B tumors (solitary adenocarcinomas with pure lepidic growth, formerly localized BAC) with a 5-year survival rate of 100% was significantly better than cases of type C tumors (adenocarcinoma with tumor components of lepidic growth) with 5-year survival rate of 75% and the prognosis of cases of type D was worst. Based on those results, T1 tumor (≤3 cm) has become to be subdivided into T1a (≤2 cm) and T1b (>2 cm but ≤3 cm) in the latest TNM classification of UICC (4).
There are many studies in which high-resolution CT findings were correlated with the histologic subtypes of peripheral adenocarcinoma of the lung defined by Noguchi et al. (5, 6). However, there are only a few reports on the relationship of fluorine 18-fluoro-2-deoxyglucose positron emission tomography CT (F18-FDG PET-CT) with this tumor classification (7, 8). In this study, we investigated if visual assessment and maximum standard uptake values (SUVmax) on PET-CT may correlate with the histology grading of small peripheral adenocarcinoma of the lung.
Material and Methods
Patients
Ninety consecutive patients (48 men and 42 women; mean age, 65 ± 10 [SD] years; range, 30–82 years) who had surgical resection of lung neoplasms from June 2006 to December 2008 were included in this study. There were 96 lesions (three of atypical adenomatous hyperplasias [AAH], seven type A tumors [adenocarcinoma with pure lepidic growth], 12 type B tumors [adenocarcinoma with lepidic growth accompanied by foci of collapse of alveolar structure], 42 type C tumors [invasive adenocarcinoma with lepidic growth], 10 type D tumors [poorly differentiated adenocarcinoma], 10 type E tumors [tubular adenocarci-noma], and 12 type F tumors [papillary adenocarcinoma with compressive and destructive growth]). Tumor subtypes were determined based on the classification of Noguchi et al. (3). AAH lesions were included in the current study because these tumors are classified as pre-cancer lesion in World Health Organization classification of lung neoplasms (9). Taking prognosis into consideration, the 96 lesions were classified into four groups; group 1 (lesions of AAH and type A tumor); group 2 (type B tumors); group 3 (type C tumors); group 4 (types D, E, and F tumors).
F18-FDG PET-CT
Patients were asked to fast for 6 h and then subsequently received 3.7 MBq/kg of FDG intravenously followed by PET-CT after 1 h for rest. Combined PET-CT imaging was conducted by using two PET-CT units, Biograph duo (Siemens, Erlangen, Germany) with two rows of detectors, and Gemini (Philips Medical Systems, Best, The Netherlands) with 16 rows of detectors. CT images by Biograph duo were acquired with X-ray tube voltage of 130kV, X-ray tube current of 75mAs, collimations of 2 × 4 mm, a helical pitch of 3.4, field of views of 50 cm, scan time of 170 s, and exposure time of 0.8 s per rotation. CT images by the Gemini unit were acquired with tube X-ray voltage of 120kV, X-ray tube current of 150 mAs, collimations of 8 × 3 mm, a helical pitch of 7, field of views of 60 cm, scan time of 120 s, and exposure time of 1 s per rotation. PET images of both PET-CT units, encompassing the same field of view as the CT images, were acquired in 120-170 s per bed position. Both CT and PET scans were obtained from the vertex to the femur under free-breathing.
PET-CT images were retrospectively evaluated visually and semi-quantitatively by two experienced radiologists (TH and SW) without knowledge of the patient's data. By visual assessment, when the accumulation of the tracer in the lesions was greater than that of the surrounding normal lung, the lesions were diagnosed as positive. In doubtful cases the final diagnosis was made by consensus of both radiologists. Semi-quantitative analyses were made by averaged values of SUVmax of lesions measured by both radiologists using the following formula (10):

where CF indicates calibration factor and ID injected dose. The SUVmax was obtained by selecting volumetric regions of interest within the pulmonary nodule to include all tumor tissue but not any non-tumor tissue with potentially higher SUVmax than that of the tumor. Attenuation-corrected PET images were used for the calculation.
Statistical analyses
As the prognosis of patients worsens with the progression of the number of group categories, proportions of positive PET-CT diagnoses and mean SUVmax of lesions of the four groups were analyzed using trend tests to examine if there was a linear correlation between the proportions of positive PET-CT diagnoses or mean PET SUVmax and the progression of the number of group categories. Cochran-Armitage test was used for the assessment of the proportions and Jonckheere-Terpstra test for the assessment of mean values. The Mann-Whitney U test was used to compare difference in the mean SUVmax of each pair of the four groups and the Fisher's exact test was used to compare the proportions of positive PET-CT diagnoses of each pair of the four group categories. Then, an optimal threshold of SUVmax was proposed to best discriminate groups 3 or 4 (patients with poor prognosis) from groups 1 or 2 (patients with good prognosis).
Furthermore, the false-negative rates of the optimal threshold for predicting tumors of poor prognosis between the nodules of <1 cm and ≥1cm were compared to examine the effect of nodule size on SUVmax. Similarly, we also compared the false-negative rates of the criterion between the nodules in the basal lung segments and in the other segments to evaluate the effect of respiratory motion on SUVmax. A P value <0.05 was considered to indicate a statistically significant difference. All of the statistical calculations were performed using SPSS software (SPSS Inc., Chicago, IL, USA).
Results
Group 1 included 10 lesions, group 2 12, group 3 42, and group 4 32. The size of the nodules ranged from 5 to 20 mm. Of the 96 lesions, nine lesions measured < 1 cm and 17 of the lesions were located in the basal segments of the lung. As shown in Table 1, a statistically significant linear trend was seen in the proportions of positive PET-CT diagnoses. According to the advancement from group 1 through group 2 to group 3, and then to group 4, the proportions of positive PET-CT diagnoses significantly increased (P < 0.05). The proportions of positive PET-CT diagnoses in group 3 were significantly greater than in group 2 (P = 0.02), which again was significantly greater than that in group 1 (P = 0.04). Similarly, there was a statistically significant linear trend in the mean SUVmax of the four groups. According to the advancement from group 1 through group 2 to group 3, and then to group 4, the mean SUVmax of lesions significantly increased (P < 0.05). The mean SUVmax in group 3 was significantly greater than that in group 2 (P < 0.01).
The relation between proportions of positive PET-CT or mean SUVmax of lesions and histologic grading
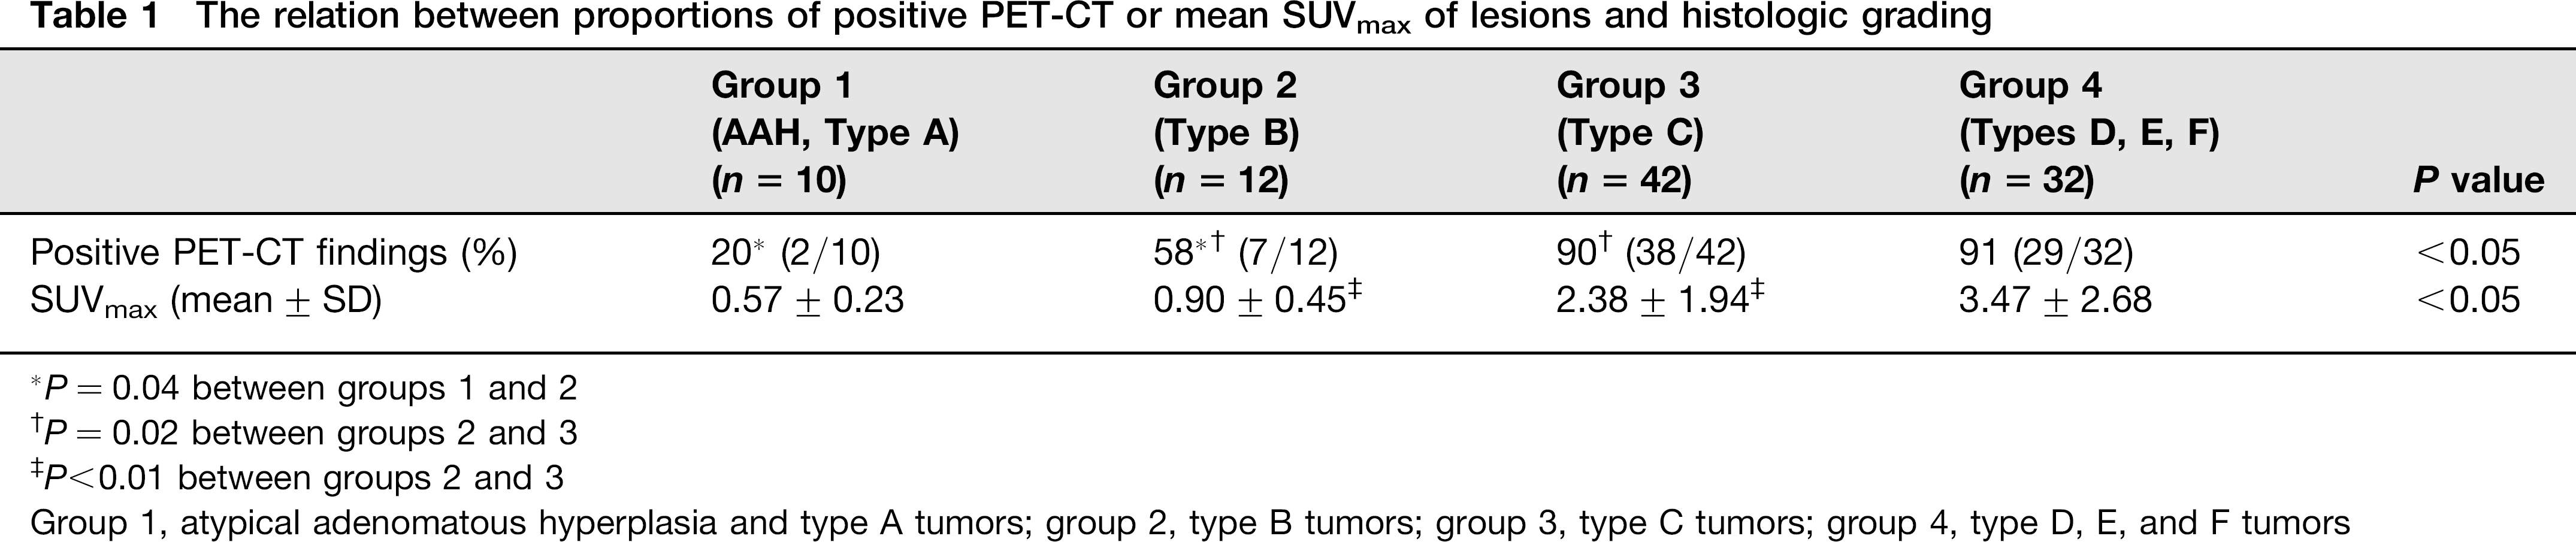
P — 0.04 between groups 1 and 2
P = 0.02 between groups 2 and 3
P>0.01 between groups 2 and 3
Group 1, atypical adenomatous hyperplasia and type A tumors; group 2, type B tumors; group 3, type C tumors; group 4, type D, E, and F tumors
Using the SUVmax for predicting patients with poor prognosis (group 3 or group 4), a threshold of 0.42 showed the highest accuracy of 84% with 95% sensitivity, 50% specificity, 86% positive predictive value, and 73% negative predictive value. With use of this optimal criterion for predicting patients with poor prognosis, there were 70 true-positive diagnoses (Fig. 1), 11 false-positive diagnoses (Fig. 2), 11 true-negative diagnoses (Fig. 3), and four false-negative diagnoses (Fig. 4). When a threshold of 2.05 was used for predicting patients with poor prognosis, no false-positive cases were included (100% specificity). However, this threshold showed poor sensitivity (49%) with 100% positive predictive value and 36% negative predictive value. Visual assessment showed similar accuracy of 83% with 90% sensitivity, 59% specificity, 88% positive predictive value, and 65% negative predictive value.

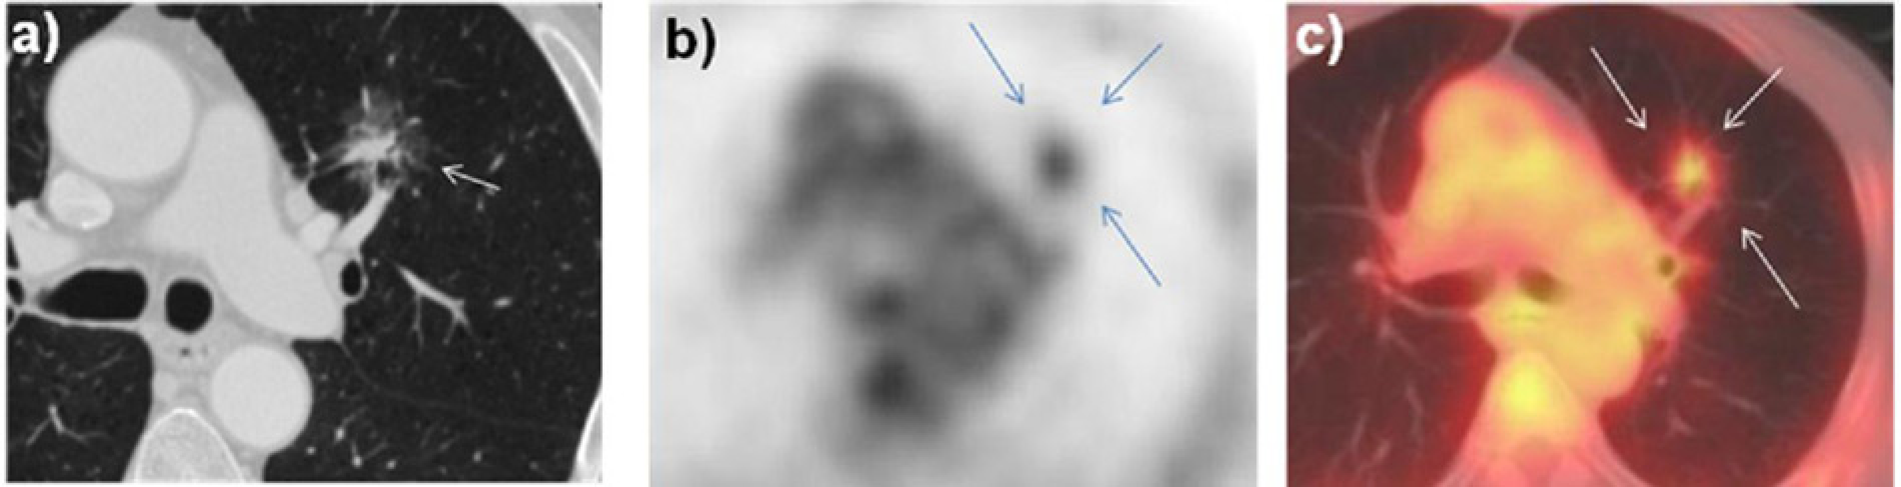
True-positive diagnoses in a 76-year-old woman with group 4 (type D tumor). (a) Thin-section CT shows a spiculated solid nodule (arrow). Transverse PET image (b) and a fusion image of PET-CT (c) show a strong accumulation in the nodule (a SUVmax of 9.7; arrows). Visual assessment was positive. The SUVmax of lesion exceeded an optimal threshold of 0.42 and therefore, correct diagnoses of tumor of poor prognosis was made
False-positive diagnoses in a 70-year-old man with group 2 (type B tumor). (a) Thin-section CT shows a spiculated mixed ground-glass opacity nodule (arrow). Transverse PET image (b) and a fusion image of PET-CT (c) show an increased accumulation in the nodule (a SUVmax of 2.0; arrows). Visual assessment was positive. The SUVmax of lesion exceeded an optimal threshold of 0.42 and therefore, the patient was incorrectly diagnosed as having tumor of poor prognosis
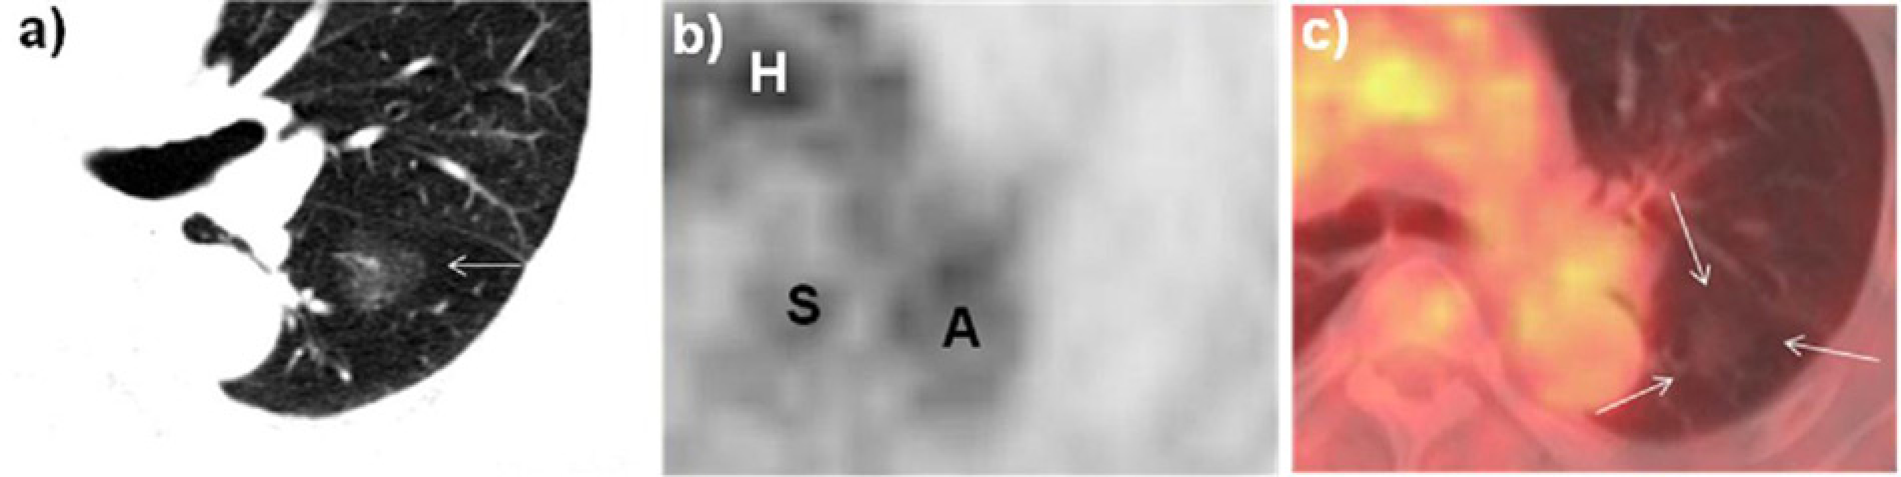
True-negative diagnoses in a 72-year-old man with group 1 (type A tumor). (a) Thin-section CT shows a ground-glass opacity nodule (arrow). Transverse PET image (b) and a fusion image of PET-CT (c) show no increased accumulation in the nodule (arrows). Visual assessment was negative. The SUVmax of lesion measured in the corresponding site of (a) was 0.40, which was smaller than the optimal threshold of 0.42. Therefore, correct diagnoses of good prognosis was obtained. A, descending aorta; H, heart; S, spine
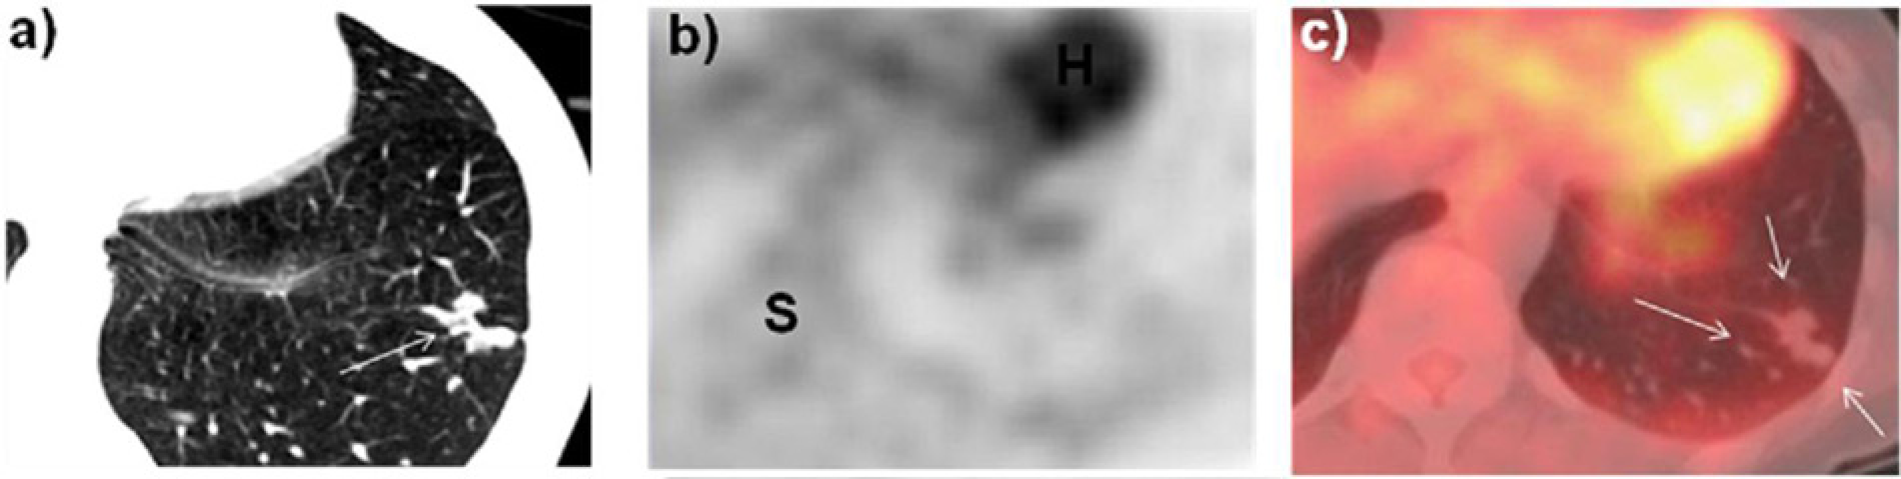
False-negative diagnoses in a 59-year-old woman with group 3 (type C tumor). (a) Thin-section CT shows a lobulated solid nodule (arrow). Transverse PET image (b) and a fusion image of PET-CT (c) show no increased accumulation in the nodule (arrows). Visual assessment was negative. The SUVmax of lesion measured in the corresponding site of (a) was 0.41, which was smaller than the optimal threshold of 0.42. Therefore, this patient was incorrectly diagnosed as having tumor of good prognosis. H, heart; S, spine
No significant differences were seen in the false-negative rates between the lesions of <1 cm (0%, 0/3 nodules) and ≥1 cm (5.6%, 4/71 nodules) or between the lesions in basal segments (6.7%, 1/15 nodules) and in the other segments of the lung (5.1%, 3/59 nodules).
Discussion
In the current study, as the histology grading of pulmonary tumors advanced, both SUVmax and proportions of positive diagnoses on PET-CT statistically significantly increased. When the optimal threshold of 0.42 for SUVmax was used, 84% accuracy for predicting tumors of poor prognosis (types C-F tumors) was obtained. Visual diagnoses showed similar accuracy of 83%. These results may indicate that the tumor aggressiveness may increase as the histologic grade progresses from type A tumors through type B tumors to type C tumors and then to types D, E, and F tumors.
Maeda et al. (7) analyzed the relationship between PET-CT and tumor subtypes of 54 patients defined by Noguchi et al. (3). They divided those tumors into two groups, one with good prognosis (type A and type B tumors) and the other with poor prognosis (types C–F tumors) and concluded that an optimal threshold of 1.0 for SUVmax yielded 93% accuracy for prediction of patients with poor prognosis. In the study of Maeda et al. (7), the number of patients, especially the proportion of type A tumor, was small and the diagnostic capability of SUVmax <1.0 was not evaluated. The correlation between the histology grading of tumor subtypes and visual diagnoses of PET-CT was not assessed either.
In the study of visual interpretation on PET in 37 tumors of Noguchi classification made by Tsunezuka et al. (8), diagnostic accuracy for predicting poor prognosis (tumors of types C–F) was 70% with 64% sensitivity and 89% specificity. However, the patients’ number was too small to make a statistical analysis and the role of SUVmax in those tumors was not studied.
In recent years, it has been suggested that limited surgery such as a wide wedge resection, segmentectomy, or lobectomy with hilar lymph node dissection and med-iastinal nodes sampling is feasible for patients with type A and type B tumors (11, 12). Yamamoto et al. (13) documented that 5-year survival of patients at early stage of lung cancer who underwent limited surgery with video assistance was comparable to that of patients who had standard thoracotomies. However, preoperative selection of candidates for limited surgery is a serious clinical problem. Thin-section CT analyses succeeded in this selection of patients to some extent (5, 6). Takashima et al. (5) evaluated various thin-section CT findings with use of multivariate analyses for discriminating type C tumors from type A or B tumors and suggested that percentages of ground-glass opacity areas of lesion were useful for discrimination between those two tumor categories. The accuracy (85%) in this study in differentiating type C tumors from type A or B tumors on thin-section CT was comparable to our study of FDG-PET CT.
Regarding the nodal staging of non-small cell lung cancer, it has been reported that FDG-PET is more accurate than CT alone (14, 15). Meta-analysis has demonstrated that FDG-PET was statistically significantly more accurate than spiral CT for identifying lymph node involvement (median sensitivity and specificity 61% and 79%, respectively, for CT and 85% and 90%, respectively, for FDG-PET).
In a comparable study of FDG-PET CT and CT alone, Shim et al., reported that FDG-PET CT was more accurate (79% for CT alone and 86% for FDG-PET CT) and more specific (69% for CT alone and 84% for FDG-PET CT) than CT alone for staging of nodal status of cases of non-small cell lung cancer (15).
No case of type A or B tumors had lymph node metastases and excellent prognosis, while 28% of cases of type C tumors had nodal metastases with poor prognosis (3). There seems to be general agreement that FDG-PET CT is more accurate and more specific than CT for nodal staging of cases of non-small cell lung cancer. The information on nodal status with FDG-PET CT may improve the accuracy in separating tumors with good prognosis from those with poor prognosis and may enhance the confidence of surgeons in selecting appropriate surgical methods. When a pulmonary nodule with SUVmax ≤0.42 or with visually negative result on FDG-PET CT shows no evidence of nodal metastases on FDG-PET CT, a highly likely diagnosis will be a type A or B tumor rather than type C tumor and limited surgery may be indicated. Standard thoracotomy with nodal dissection may be needed for a pulmonary nodule of SUVmax ≥2.05 regardless of presence or absence of nodal metastases on FDG-PET CT, because SUVmax ≥2.05 invariably indicated type C tumors in our series.
In the recently published literature on a new classification of lung adenocarcinoma, type A and B tumors were classified as adenocarcinoma in situ, whereas type C tumors were classified into two categories, one being minimally invasive adenocarcinoma and the other lepidic predominant adenocarcinoma; the former one has small foci of invasion with excellent prognosis similar to adenocarcinoma in situ and the latter one indicates invasive adenocarcinoma with poor prognosis (16, 17).
In this study, two different PET/CT scanners were used. Although a little difference in SUVmax of the two scanners was unavoidable, we tried to minimize the difference by using phantom adjustment at regular time-intervals. Small lesions are reported to show artifactually low SUVmax from partial volume effects and SUVmax of pulmonary nodules located near the diaphragm have a risk of being underestimated from respiratory motion (18, 19). However, in our series such phenomena were not observed.
In conclusion, FDG-PET CT may be beneficial for discrimination of tumor subtypes and therefore, may contribute to not only selection of candidates for limited surgery but also prediction of prognosis of patients with peripheral T1a adenocarcinoma of the lung.
Footnotes
ACKNOWLEDGEMENTS
We thank Takahashi Horinouchi for providing radiological data.