
Abstract
Background
Optimal contrast enhancement is crucial for the detection of coronary artery stenoses and atherosclerotic changes in coronary CT angiography (CTA).
Purpose
To demonstrate the feasibility of using the cardiac output (CO) obtained from the test bolus injection data-set (COtest) as a factor in contrast injection rate revision of the following coronary CTA.
Material and Methods
The test bolus injection data-sets of 52 consecutive coronary CTAs were examined. COtest was calculated from the test bolus data-set. Aortic peak enhancement (APE) was measured on the following coronary CTA. We simulated the APE at a fixed contrast injection rate of 4 mL/s (simAPE) in each patient.
Results
The ranges of COtest and simAPE were 2.82-7.56 L/min and 194-527 Hounsfield Units, respectively. There was a significant negative correlation (R = -0.802, P < 0.001) between simAPE and COtest.
Conclusion
COtest can be used for injection rate revision on coronary CTA.
The introduction of multidetector computed tomography (MDCT) coronary angiography has led to a greater need for optimized contrast enhancement and accurate timing of the contrast bolus injection relative to the start of data acquisition (1,2). Optimal contrast enhancement is crucial for the detection of coronary artery stenosis and atherosclerotic changes in coronary CT angiography (CTA). Ascending aortic contrast enhancement above 300 Hounsfield Units (HU) enables visualization of small coronary arteries, but enhancement above 400 HU can obscure coronary calcifications (3–6). Thus, a contrast enhancement of approximately 300–400 HU at the ascending aorta is preferable for coronary CTA (3–6). Precise timing of the contrast bolus in MDCT angiography is achieved by means of an automated bolus tracking technique or by using a test bolus that permits accurate determination of the arrival time of the contrast bolus (1,7).
Many patient-related factors influence the magnitude of the aortic contrast enhancement in CTA (2, 8–10). Among these factors, body weight (BW) and body surface area (BSA) are often the most important factors to consider when revising the contrast injection rate on CTA (6, 11–13). Cardiac output (CO) is another important patient-related factor that influences the timing and magnitude of aortic contrast enhancement (2, 5, 14–22). However, CO is seldom used in CTA for contrast injection rate revision. A possible solution is to obtain CO from the test bolus injection data-sets that are acquired just prior to coronary CTA to allow an assessment of contrast enhancement timing (14). The purpose of this study was to demonstrate the feasibility of using the CO obtained from the test bolus injection data-set as a factor in the contrast injection rate revision of the following coronary CTA.
Material and Methods
Patients
Between January and June 2008, 52 consecutive patients (26 women, 26 men; mean age, 66.8±11.8 years; range, 24–84 years; mean body weight, 60.3±12.1 kg; range, 43.0–104.0 kg) with presumed ischemic heart disease underwent coronary CTA at Yamagata Prefecture Central Hospital. No patient had severe renal damage (eGFR < 30). The estimated glomerular filtration rate (eGFR) ranged from 40.1 to 112.1 mL/min/1.73 m2 (mean, 72.3±14.7). The echocardiography was performed within 2 weeks of the coronary CTA for each patient. BSA was calculated using Livingston's equation (23)

This retrospective study was approved by our Institutional Review Board and informed consent from the patients was waived.
Coronary CTA
Test bolus injection protocols
All coronary CTAs were performed with a 64-detector CT (Light Speed VCT, GE Healthcare Japan, Tokyo, Japan). Patients with a pre-examination heart rate of above 60 bpm were given 40 mg of metoprolol orally 1 h before the examination to reduce heart rate, except for four patients with asthma. During coronary CTA, a test bolus injection of contrast medium with an iodine concentration of 350 mg/mL (Omnipaque 350 syringe, Iohexol, Daiichi-Sankyo, Tokyo, Japan) was administered first. The power injector was directly attached to the Omnipaque 350 (70 mL) syringe. The contrast injection volume for the test bolus was 12 mL. The contrast medium injection was immediately followed by a saline chaser (25 mL). The injection rate was determined by each patient's BW according to BW (kg) × 0.07 mL/s. The upper limit of the injection rate was set to 5.6 mL/s. The contrast medium was administered via a 20-G needle inserted into the right cubital vein. Dynamic monitoring scans were positioned at the level of the pulmonary arteries. The interval time between each monitoring scan was 2 s. Acquisition of the dynamic monitoring scans began 10 s after initiation of the test bolus injection of the intravenous contrast medium. Fourteen sequential scans were acquired under end-inspiratory breath-hold. Tube voltage and current were 120 kV and 100 mA, respectively. The collimation was 8 × 0.625 mm, and the reconstructed slice thickness was 5 mm.
The user delineated a region of interest (ROI) inside the ascending aorta to create a time attenuation curve for aortic peak time (APT) measurements. The size of the ROI was approximately one half of the ascending aortic diameter to avoid any artifacts caused by motion of the ascending aorta.
Main bolus injection protocols
Just before coronary CTA, approximately 0.3 mg of nitroglycerine (Myocor spray, Astellas Co., Tokyo, Japan) was puffed sublingually for the purpose of coronary artery dilation. The remaining contrast medium (the injection rate was the same as for the test bolus injection, and the total injection time was 10 s) and saline chaser (2 mL/s and 10 s, respectively) were injected, and scanning was initiated after a delay based on the previously determined contrast transit time (APT on the test bolus injection + 3 s). The coronary CTA was acquired during an approximately 7 s end-inspiratory breath-hold.
The examination protocol was the same as for routine coronary CTA, and was as follows: tube voltage, 120 kV; tube current-time product, 700 mA (using Auto MA) and ECG dose modulation (if available); collimation, 64 × 0.625; helical pitch, 0.16-0.22 (variable by heart rate); and tube rotation time, 350 ms. All coronary CTA were performed in the craniocaudal direction.
CT data analysis
Aortic peak enhancement (APE) of coronary CTA
A circular ROI was drawn to the size of 50% of the ascending aortic diameter on each of the transverse coronary CTA images (effective section thickness of 0.625 mm and reconstruction interval of 0.625 mm). The contrast enhancement within the ROI was measured (in HU) on a computer workstation (Aquarius NET Station NEXUS, TeraRicon, Inc., Tokyo, Japan). The APE of each patient was defined as the maximum contrast enhancement of the ascending aorta. We simulated the aortic peak enhancement at the injection rate of 4 mL/s (SimAPE) with a proportion calculation method (24) in each patient, as follows,
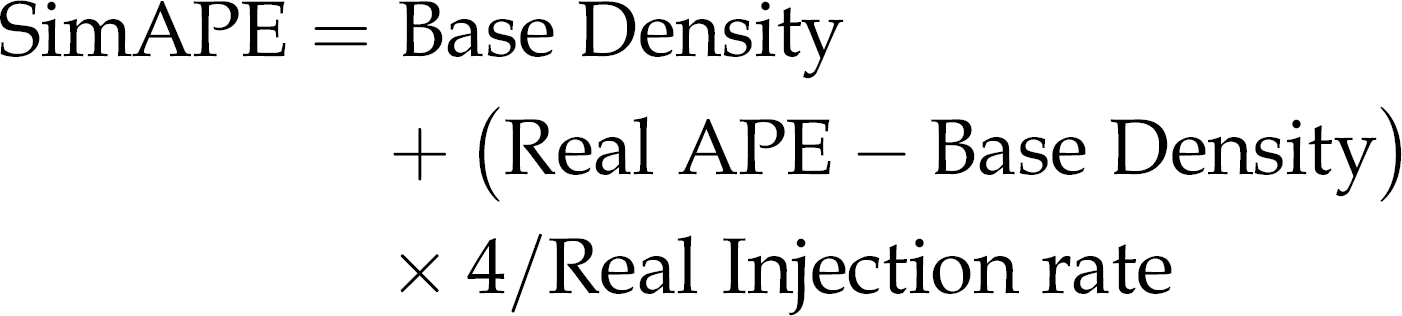
where Base Density was the pre-contrast CT attenuation of the ascending aorta.
Measurement of cardiac output from test bolus injection (COtest)
COtest was calculated retrospectively on the independent workstation. Each time density curve (TDC) obtained from the test bolus injection was used for the CO calculation based on the Stewart-Hamilton equation (25):
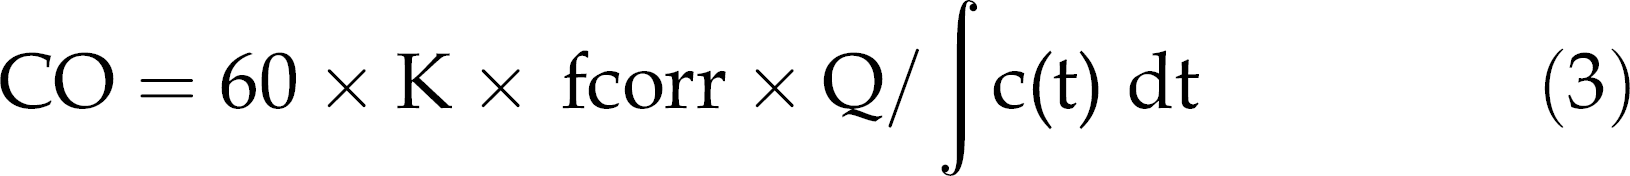
where Q is the amount of contrast medium injected and c(t) is the indicator concentration as a function of time. The conversion factor (K) and correction factor (fcorr) were 26.78 and 0.71, respectively (14).
Three tasks were necessary to be performed to measure the CO from the test bolus injection data-set. The first task was a sampling of the contrast enhancement in the ascending aorta from the test bolus injection data-set. The second was the formation of the gamma variate function (14, 26–29) to exclude the contrast enhancement increase by recirculation. The third was the integration of the contrast enhancement over time. These calculations were carried out with a commercial spreadsheet program (Excel 2007, Microsoft, Tokyo, Japan).
Statistical analysis
Statistical analysis was performed with a statistical software package (SPSS Ver.18, SPSS Japan Inc., Tokyo, Japan). Pearson's correlation coefficient analysis was used to determine the relationships between the simAPE and COtest, BW or BSA. A correlation with a P value < 0.05 was considered to be statistically significant.
Results
The range of COtest and simAPE were 2.82–7.56 L/min (mean, 4.35±1.03 L/min) and 194–527 HU (mean, 357± 71 HU), respectively. There were significant negative correlations between the simAPE and BW (r = -0.733, P < 0.001, Fig. 1), BSA (r = -0.734, P < 0.001, Fig. 2) or COtest (r = -0.802, P < 0.001, Fig. 3).
Correlation between body weight (BW) and simulated aortic peak enhancement (simAPE). There was a significant negative correlation between these parameters (r = -0.733, P < 0.001)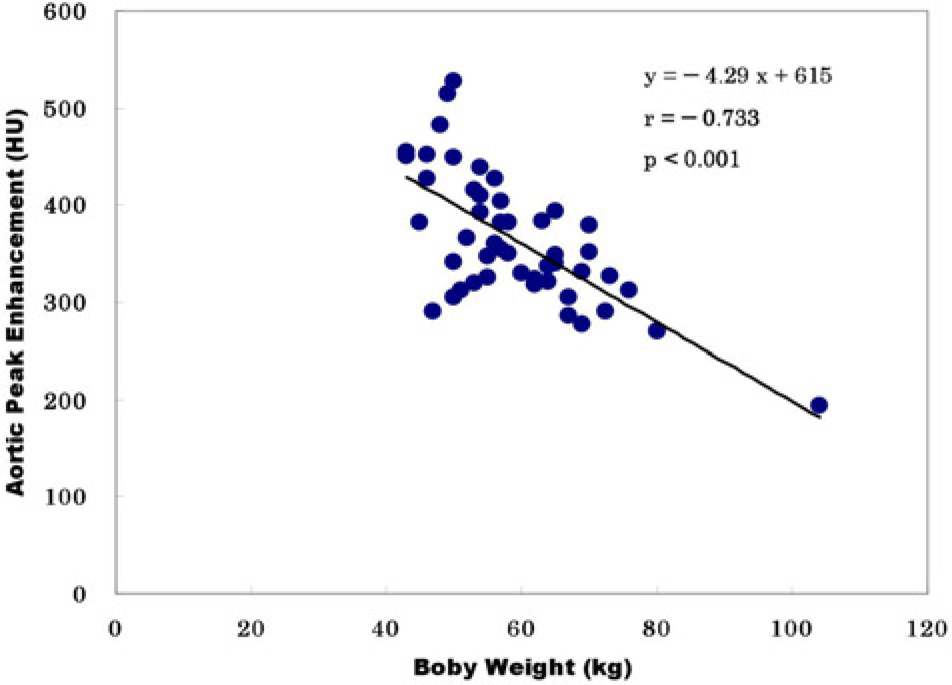
Correlation between body surface area (BSA) and simulated aortic peak enhancement (simAPE). There was a significant negative correlation between these parameters (r = -0.734, P < 0.001)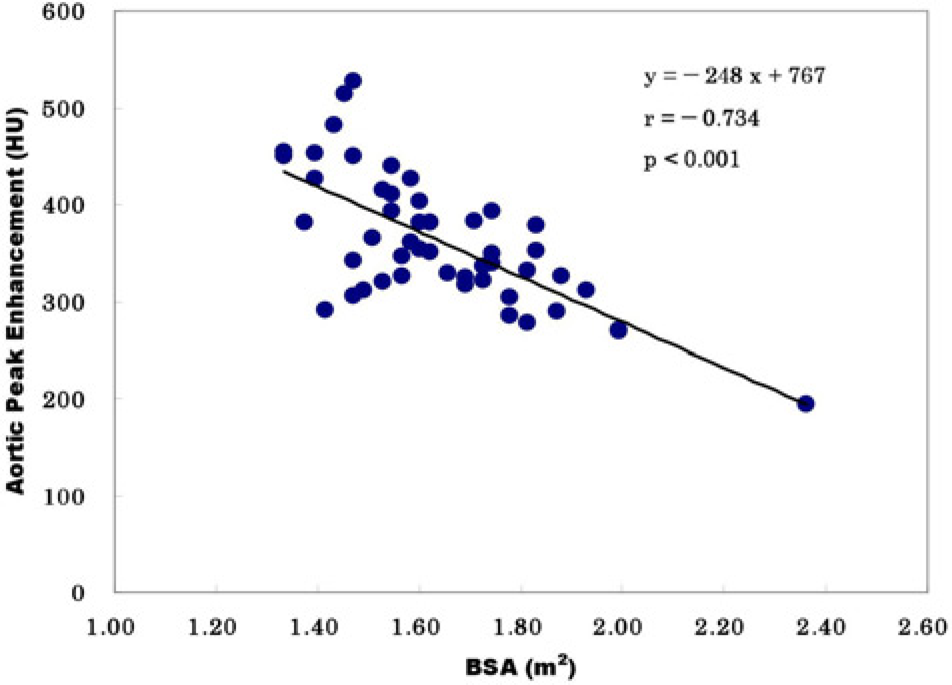
Correlation between the cardiac output obtained from the test bolus injection (COtest) and simulated aortic peak enhancement (simAPE). There was a significant negative correlation between these parameters (r = -0.802, P < 0.001)
The echocardiography performed within 2 weeks of the coronary CTA showed moderate to severe aortic regurgitation in four patients. No intra-cardiac shunts, evident heart failure, or moderate to severe mitral regurgitation was observed.
The contrast injection rate ranged from 3.1 to 5.6 mL/s (mean, 4.2±0.72 mL/s). The contrast injection volume for the coronary CTA ranged from 31 to 56 mL (mean, 41.8± 7.2 mL). The scan duration time during coronary CTA ranged from 6.0 to 9.7 s (mean, 7.7±1.0 s). We set the total injection time of 10 s in this study according to Yamaguchi et al.'s report (20). The range of APT of the test bolus was 14–25 s (mean, 18.8±2.9 s). ECG dose modulation was used in 41 patients. Coronary CTA was successfully performed on all patients without any complications. Breath-holding during test bolus injection and coronary CTA was well maintained by all patients. The image quality was rated by cardiologists as sufficient for quantitative image analysis in all examinations. The range of heart rates during the coronary CTA was 46–80 bpm (mean, 59.3±9.1 bpm).
Based on the data obtained, the following algorithm is proposed to revise the contrast injection rate with COtest for the aortic peak enhancement of 350 HU on the following coronary CTA, if the contrast medium that is used has an iodine concentration of 350 mg/mL and an injection time of 10 s.

This formula was derived from the linear regression formula for appropriate injection rate for the aortic peak enhancement of 350 HU against the CO.
Discussion
Measuring cardiac output (i.e. CO) from the test bolus injection data-set (COtest) is one of several methods that can be used for injection rate revision of coronary CTA. Several studies have reported that cardiac function may influence the aortic enhancement on CT (2, 5, 14, 15, 22). In a phantom experiment (16) and clinical study (17), the correlation between the aortic peak enhancement and CO was superior to the correlation with BW or BSA. Rist et al. reported a strong correlation of the peak density (PD) and the area under the curve (AUC) of the test bolus curve with the mean left ventricular density of the main bolus (MB) when patient BW was considered (1). The optimization of contrast injection protocols by taking PD, AUC, and patient's BW into consideration was expected to reduce the variations of the MB's contrast enhancement in the left ventricle and main coronary arteries (1). Experiments have shown that CO increases approximately in proportion to BSA (30). BSA is calculated based on the patient's BW (Eq. 1). COtest in this study was also obtained from the test bolus curve, and was inversely proportional to AUC (∫c(t) dt in Eq. 3). COtest, therefore, is closely related to AUC and BW. The good correlation between COtest and simATP in this study strongly supported the results obtained by Rist et al. (1).
COtest is the value of CO immediately before the coronary CTA. CO is one of the important patient-related factors that influences the timing and magnitude of aortic contrast enhancement (2, 5, 14–22). However, CO fluctuates greatly depending on the physiological or mental condition of the patients, especially in the examination suite (17). CO measurement just before coronary CTA is desirable as it can be used in revising the contrast injection rate. There are many CO measurement methods, such as angiocardiography, echocardiography, cardiac magnetic resonance imaging, cardiac CTA, and thermo-dilution by Swan-Ganz catheter. However, CO measurements made just before coronary CTA by any of these methods is seldom applicable in clinical situations. Therefore, CO is not usually used to revise the injection rate of the contrast medium for coronary CTA. The test bolus injection is one of these methods of contrast enhancement timing assessment, and is acquired just prior to coronary CTA. The measurement of CO from the test bolus injection data-set is one of several indicator dilution methods (14). Since the test bolus injection is carried out in the CT suite just prior to coronary CTA, the value of COtest will reflect the CO immediately before the coronary CTA.
The test bolus technique has some advantages compared with the bolus tracking technique. The test bolus technique determined accurate scan timing, achieve adequate vessel enhancement, and reduce the total amount of contrast medium required for coronary CTA although some additional contrast medium (about 10 mL) was necessary for the test bolus (3). Takaura et al.'s report suggested that the test bolus technique with a smaller amount of contrast medium achieved adequate vessel enhancement compared to the bolus tracking technique during coronary CTA on a 64-detector scanner (3). And, they suggested that the test bolus technique might reduce the contrast injection duration compared to the bolus tracking. Extra time from triggering to scanning needed for the bolus tracking might ruled out the use of short injection duration protocols (3).
The present work has some limitations. First limitation was arising from the retrospective nature of the study. We calculated CO from the test bolus injection data-set after the completion of the coronary CTA. The calculation of CO from the test bolus injection data-set is not difficult, but is an offline process. It required approximately 3 min to calculate COtest, including 2 min for a measurement of the contrast enhancement on the CT console, and 1 min for the manual data-set, i.e. each contrast enhancement by sampling TDC, concentration of contrast medium, volume of contrast medium, and transfer to an offline workstation. COtest was calculated automatically in a few seconds on the Excel sheet of the offline workstation. The online simultaneous calculation of peak contrast enhancement timing and COtest from the test bolus injection data-set is required for practical use of COtest as a factor for injection rate revision between the test bolus injection and the coronary CTA.
The second limitation is that our method cannot be used in patients with intra-cardiac shunts or severe mitral regurgitation. The dye dilution method we used cannot be applied in patients with intra-cardiac shunts or severe mitral regurgitation (31). The severe aortic regurgitation, however, did not vitiate the dye dilution determination of cardiac output (32).
The third limitation was that we did not take the effect of nitroglycerin on CO into account in this study. The nitroglycerin administration can reduce CO. All patients were given nitroglycerin sublingually, and there was little difference among the patients in the duration between the nitrogen administration and the coronary CTA in this study. There might be little difference of the nitroglycerin effect among the patients.
In conclusion, CO obtained from the test bolus injection data-set (COtest) represented the CO value immediately before coronary CTA, and was well correlated with the aortic peak enhancement on the following coronary CTA. When the test-bolus method is performed for contrast timing assessment, COtest can be an effective factor in deciding upon an infusion protocol for a contrast medium.
Footnotes
Acknowledgments
We would like to express our deepest gratitude to Kentaro Takahashi, MD in Yamagata Prefecture Central Hospital (YPCH), for his valuable feedback and comments. We would also like to thank the CT staff of the radiology department of YPCH for collecting the data.