
Abstract
Background
Intracerebral tuberculomas usually manifest as ring-enhancing of nodular lesions on magnetic resonance imaging (MRI). These imaging findings are also observed in other lesions like metastases and toxoplasmosis.
Purpose
To study the MRI perfusion characteristics of tuberculomas and its potential role in their definitive diagnosis.
Material and Methods: Thirty-four tuberculomas were evaluated by conventional and perfusion MRI. The relative cerebral blood volume (rCBV) values of the center, peripheral wall, and perilesional neuroparenchymal tissue were calculated using rCBV maps. Ten ring-enhancing metastases were similarly evaluated and rCBV values of their peripheral walls were calculated.
Results
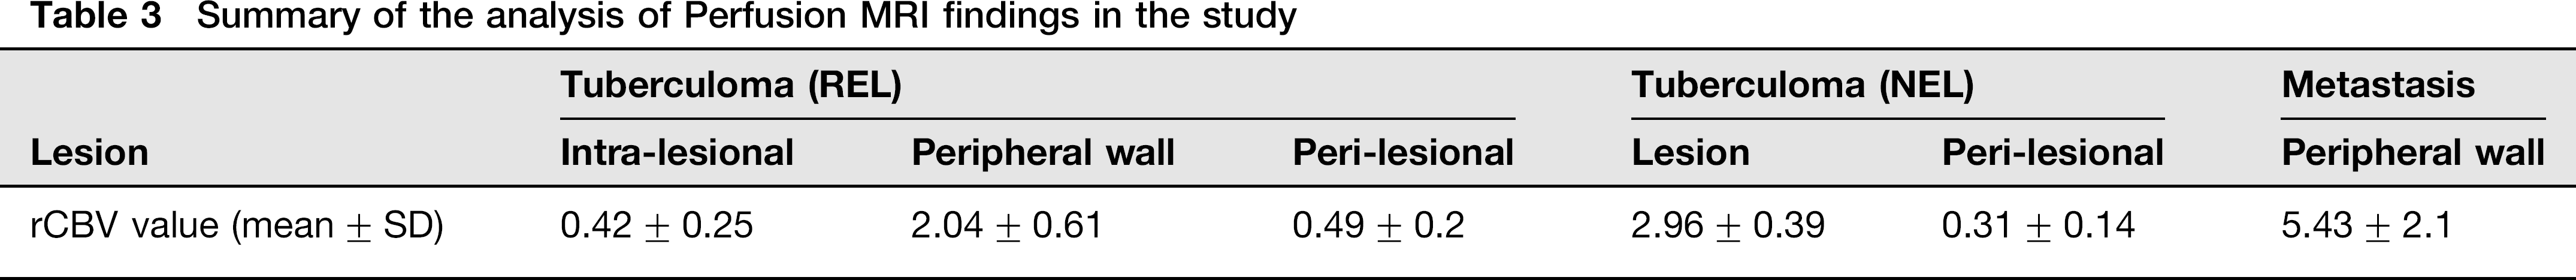
Thirty-one of the 34 tuberculomas were ring-enhancing or conglomerate lesions and revealed hypoperfused centers with hyperperfused peripheral walls, with the mean rCBV ± SD being 0.42 ± 0.25 and 2.04 ± 0.61, respectively. Three nodular enhancing lesions showed predominantly homogenous hyperperfusion, with the mean rCBV measuring 2.96 ± 0.39 (mean ± SD). The perilesional neuroparenchyma was hypoperfused in both cases. The metastases revealed mean rCBV ratio of the peripheral wall to be 5.43 ± 2.1 (mean ± SD). Analysis of the values by ROC curve method revealed a cut-off value of ≥ 3.745 for differentiating ring-enhancing metastases from ring-enhancing tuberculomas.
Conclusion
Perfusion MR is a useful tool for the assessment of tuberculomas and can help differentiate them from neoplasms like metastases. It also has a potential role in monitoring therapy and for early detection of drug resistance.
Central nervous system (CNS) tuberculosis (TB) is a devastating form of TB, accounting for about 1% of all TB infections (1). CNS tuberculoma is one of the most life-threatening manifestations of CNS TB. The spread of human immunodeficiency virus infection has further led to its increased incidence worldwide. It often presents as a diagnostic challenge as it may resemble many other infectious and non-infectious conditions, particularly metastases. Both tuberculomas and metastases are among the most common differential diagnosis of ring enhancing lesions. It is important to be able to accurately differentiate between the two, as their management and prognosis are entirely different. While biopsy remains the gold standard for diagnosis, many patients are given a trial of anti-tuberculous therapy (ATT) based on the imaging findings (2).
While numerous studies exist studying the magnetic resonance (MR) perfusion features of various neoplasms and many infections, few studies have been performed studying the perfusion characteristics of tuberculomas, and none have studied solid and caseating tuberculomas separately (3). Similarly, only one small preliminary study has been published comparing the perfusion characteristics of tuberculomas and metastases (4). If the perfusion patterns of tuberculomas are well understood, perfusion studies may help increase the degree of confidence of their diagnosis on MRI. This will help in more accurate patient selection for ATT trial versus biopsy whenever confusion arises between the diagnosis of tuberculoma and other lesions like metastasis. We studied the perfusion pattern of large intracerebral tuberculomas using dynamic perfusion MRI and its potential role in their accurate diagnosis and differentiation from ring enhancing metastases.
Material and Methods
A total of 34 patients with untreated large intracerebral tuberculomas (≥1.5 cm) and 10 patients with metastases were included in this retrospective study. The diagnosis of tuberculoma was based on cerebrospinal fluid findings (in cases with concomitant tubercular meningitis), presence of active extra cerebral tuberculosis, or positive clinical or radiological response to ATT. In case of metastases, 10 consecutive patients of metastases were included in the study. All patients either had a known primary or histopathologically proven metastases. These included nine patients with bronchogenic carcinoma and one with a colorectal carcinoma. The perfusion results were not known at the time of inclusion. MRI was performed using a 1.5T scanner (Somatom, Siemens AG, Erlangen, Germany). The lesions were evaluated with conventional imaging and dynamic susceptibility contrast (DSC) perfusion MRI. The parameters used for the gradient echo EPI (echo planar imaging) sequence used were as follows: TR, 1490 ms; TE, 40 ms; 18 slices; 5 mm slice thickness; matrix 128 × 128; 1 average. A series of 60 such scans were obtained at 1 s/ image during the first pass of dynamic intravenous administration of gadolinium-DTPA (0.1 mmol/kg) followed by 20 mL saline flush. The raw data were analyzed after postprocessing on a Leonardo Workstation VB 30A (Siemens Sonata 2004A, Erlangen, Germany) to obtain color-coded relative cerebral blood volume (rCBV) maps. Postprocessing was performed by deconvolution technique. Regions of interest of 16-24 pixels were placed over the region of maximum abnormality on the map and rCBV ratios of the center, peripheral wall, and perilesional neuroparenchyma were calculated by comparing them with the contralateral normal appearing white matter visualized in the same slice as the lesion. In case of multiple or conglomerate tuberculomas or multiple metastases, the lesion with the maximum rCBV ratio was analyzed. The mean value and standard deviation (SD) were accordingly calculated. The mean rCBV values of ring-enhancing tuberculomas and metastases were compared using ROC curve method.
Results
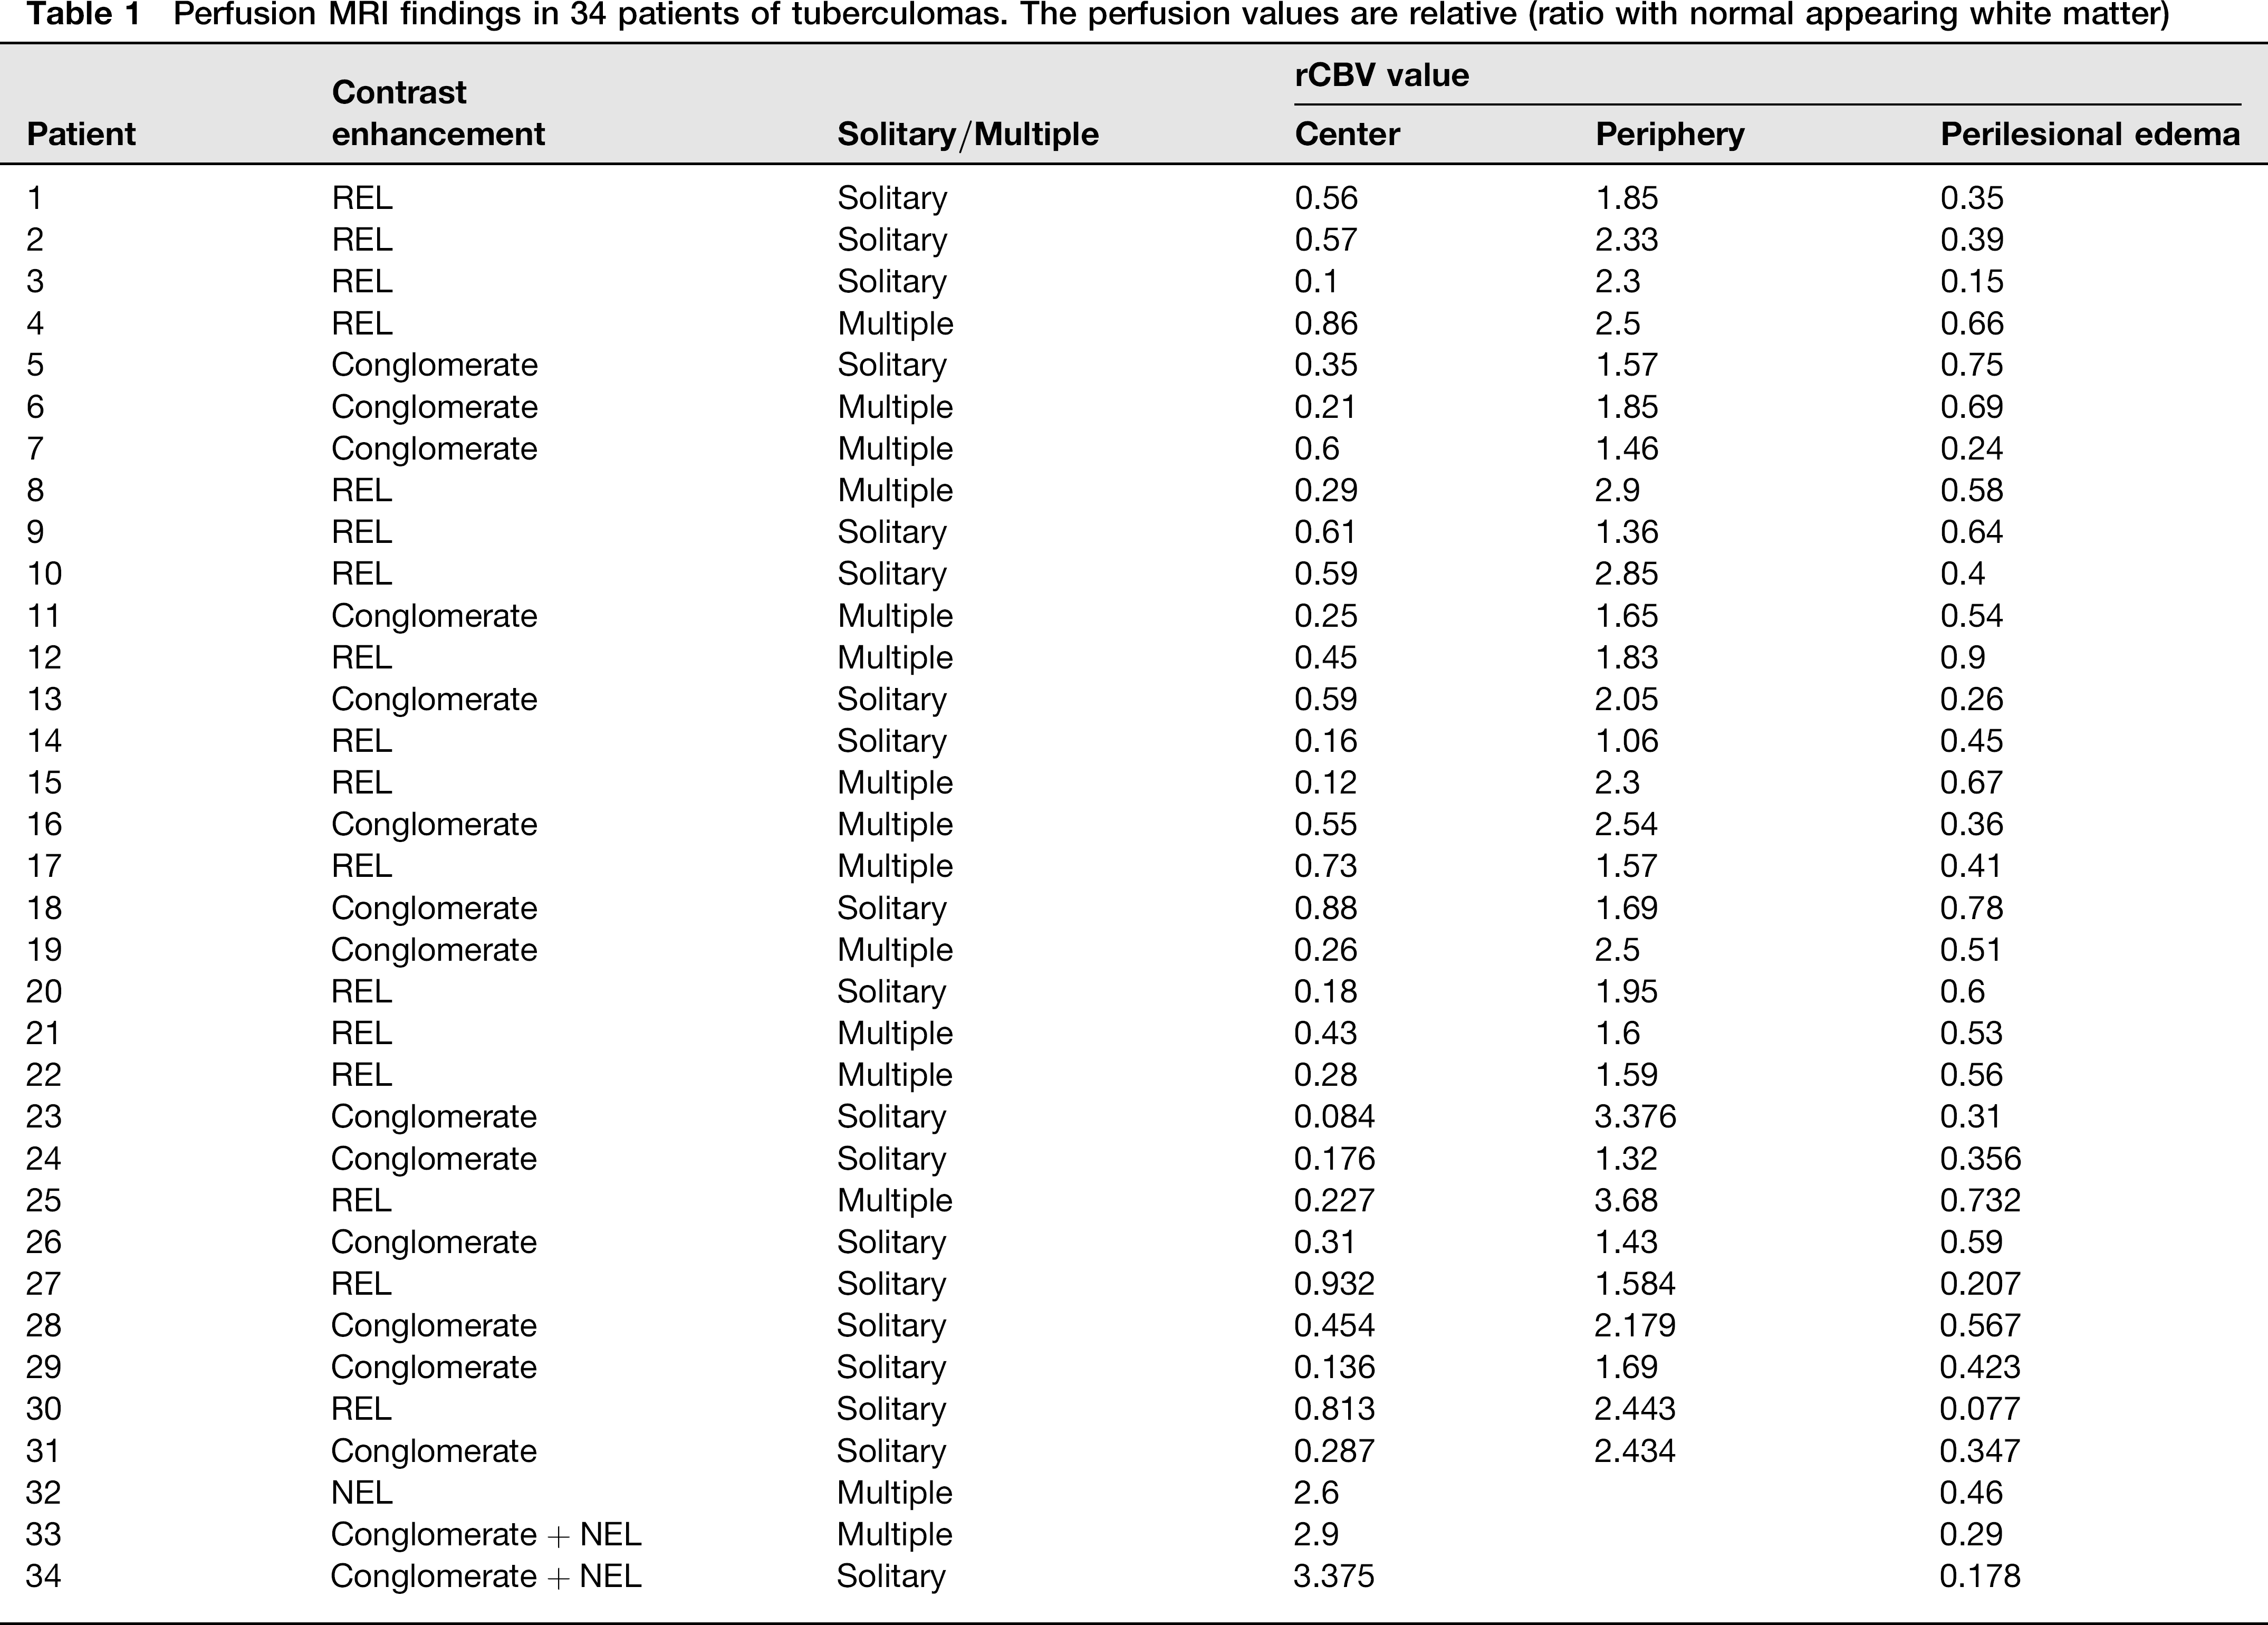
The results of the study are documented in Table1. Six men and 28 women with tuberculomas were included in the study. Nineteen lesions were solitary (56%), while 15 were multiple (44%). Contrast administration revealed ring enhancement in 17 patients (50%), conglomerate bunch of grapes appearance in 14 patients (41%), and predominantly homogenous or nodular enhancement in one patient (3%), while two patients (6%) had both conglomerate and nodular components. None of the patients was immunocompromised.
Perfusion MRI findings in 34 patients of tuberculomas. The perfusion values are relative (ratio with normal appearing white matter)
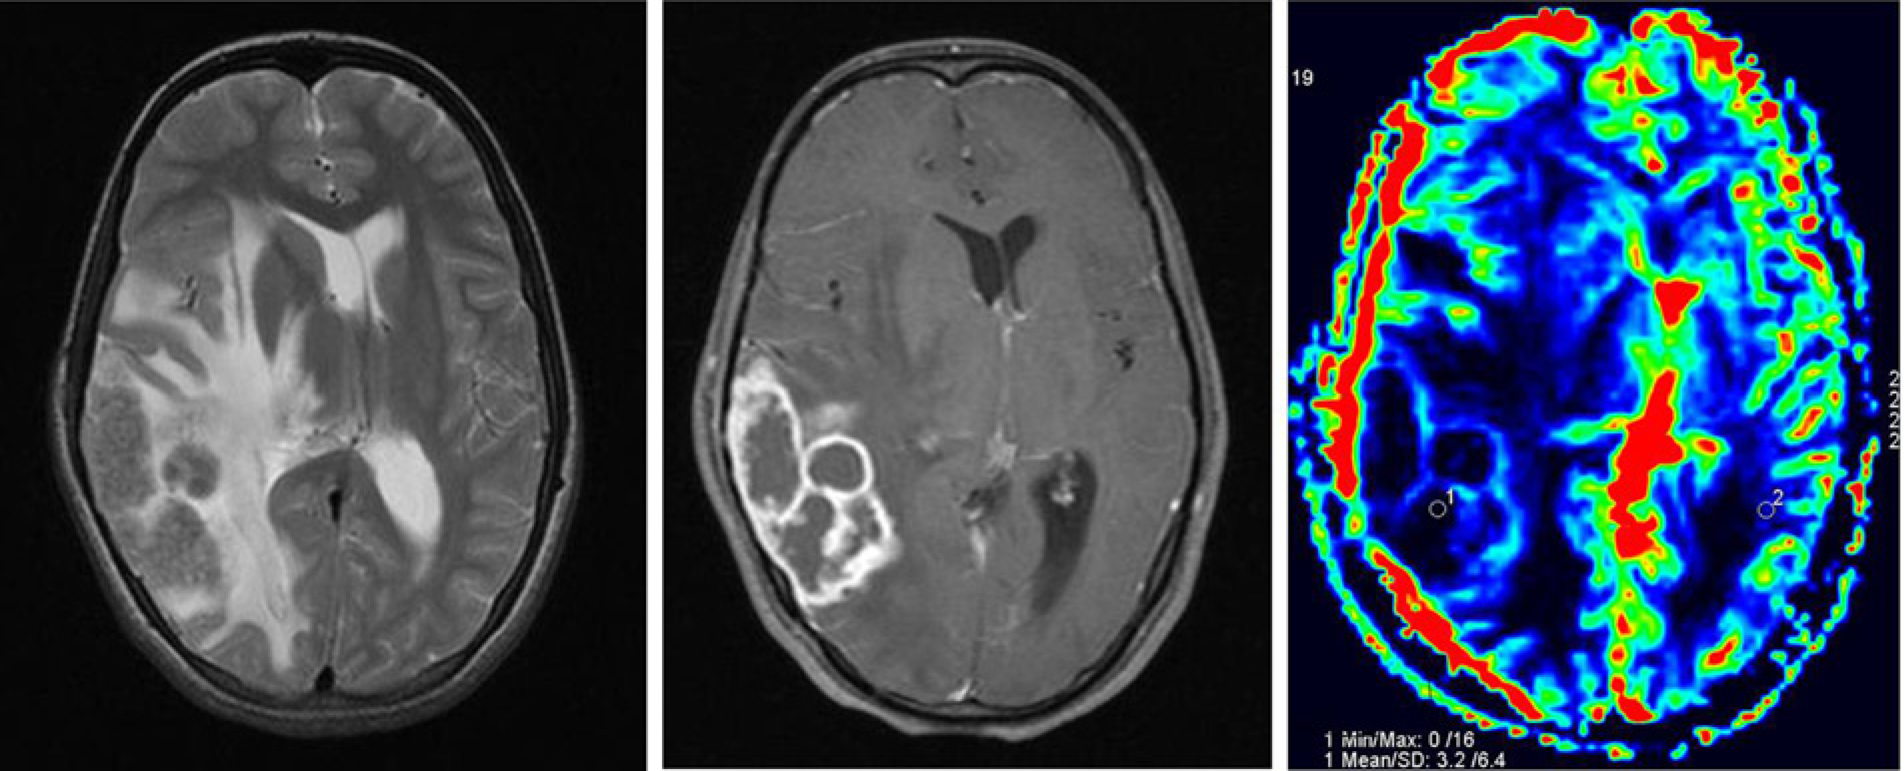
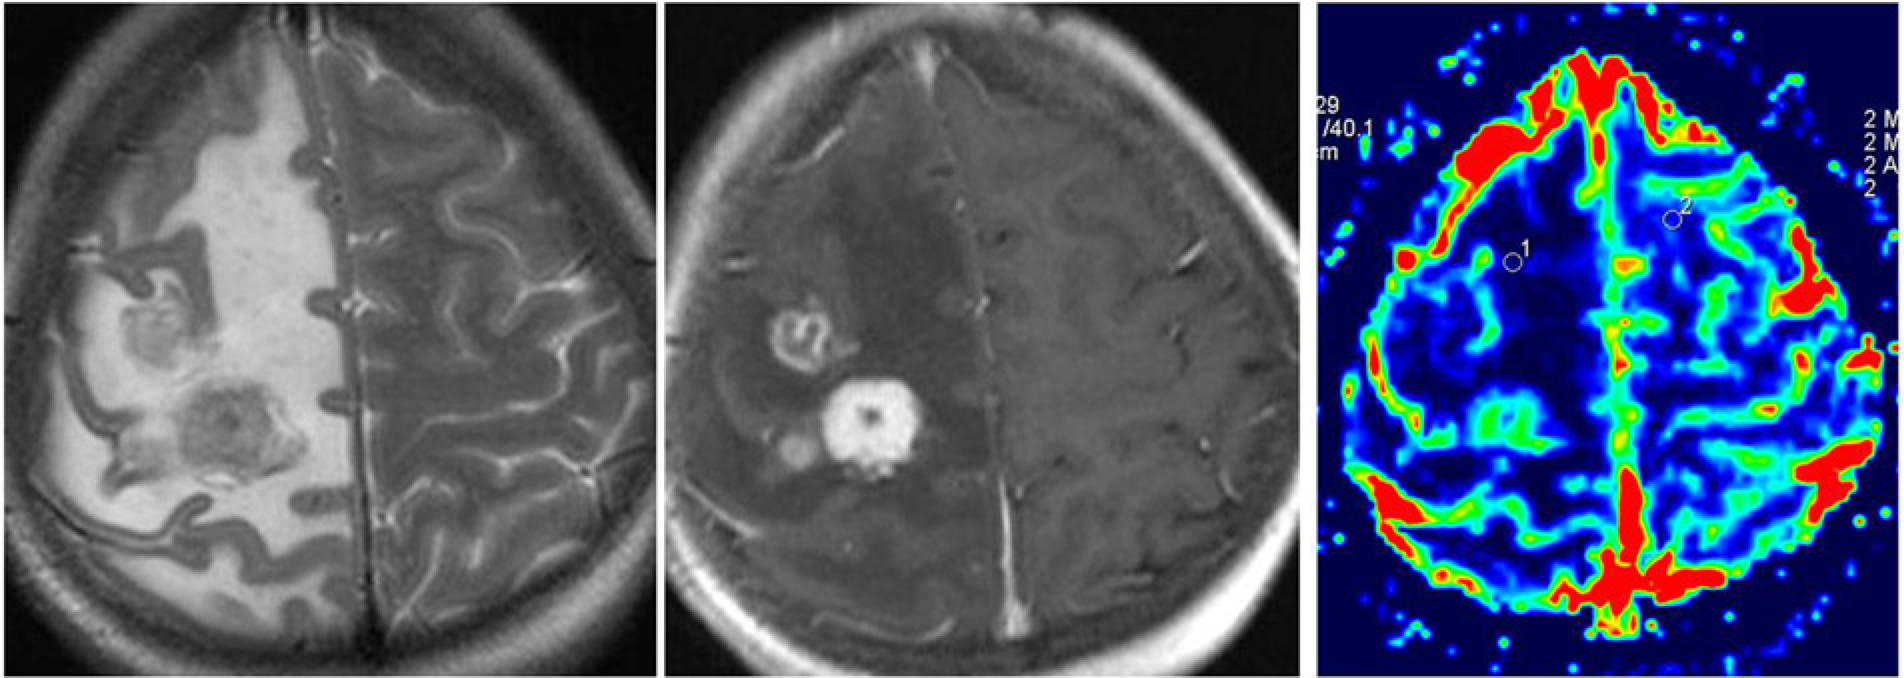
Ring-enhancing lesions and conglomerate tuberculomas were assessed as one group (henceforth referred to as RELs), while nodular enhancing lesions (NELs) were assessed separately. All the RELs had hypoperfused centers with hyperperfused peripheral walls, with the mean rCBV ± SD being 0.42 ± 0.25 and 2.04 ± 0.61, respectively (Fig. 1). The conglomerate tuberculomas showed a bunch of grapes appearance, with each individual lesion having hypoperfused centers (Fig. 2). On the other hand, NELs showed predominantly homogenous hyperperfusion, with the mean rCBV measuring 2.96±0.39 (mean ± SD) (Fig. 3). The nodular components of the two patients with both conglomerate and nodular lesions were included in this group. The perilesional neuroparenchyma was hypo-perfused in both cases, with mean rCBV values being 0.49±0.2 for RELs and 0.31±0.14 for NELs.
T2W axial, T1W postcontrast, and MR perfusion images show T2 hypointense ring-enhancing tuberculoma in the right cerebellar hemisphere with low intralesional rCBV, moderately increased peripheral wall rCBV, and low rCBV of the perilesional neuroparenchyma T2W axial, T1W postcontrast, and MR perfusion images show multiple T2 hypointense conglomerate ring-enhancing tuberculomas in the right frontoparietal region with low intralesional rCBV, moderately increased peripheral wall rCBV, and low rCBV of the perilesional neuroparenchyma T2W axial, T1W postcontrast, and MR perfusion images show multiple T2 iso-hyperintense right high frontopariental tuberculomas, with thick nodular enhancement of the largest lesion with increased intralesional and peripheral wall rCBV and low rCBV of the perilesional neuroparenchyma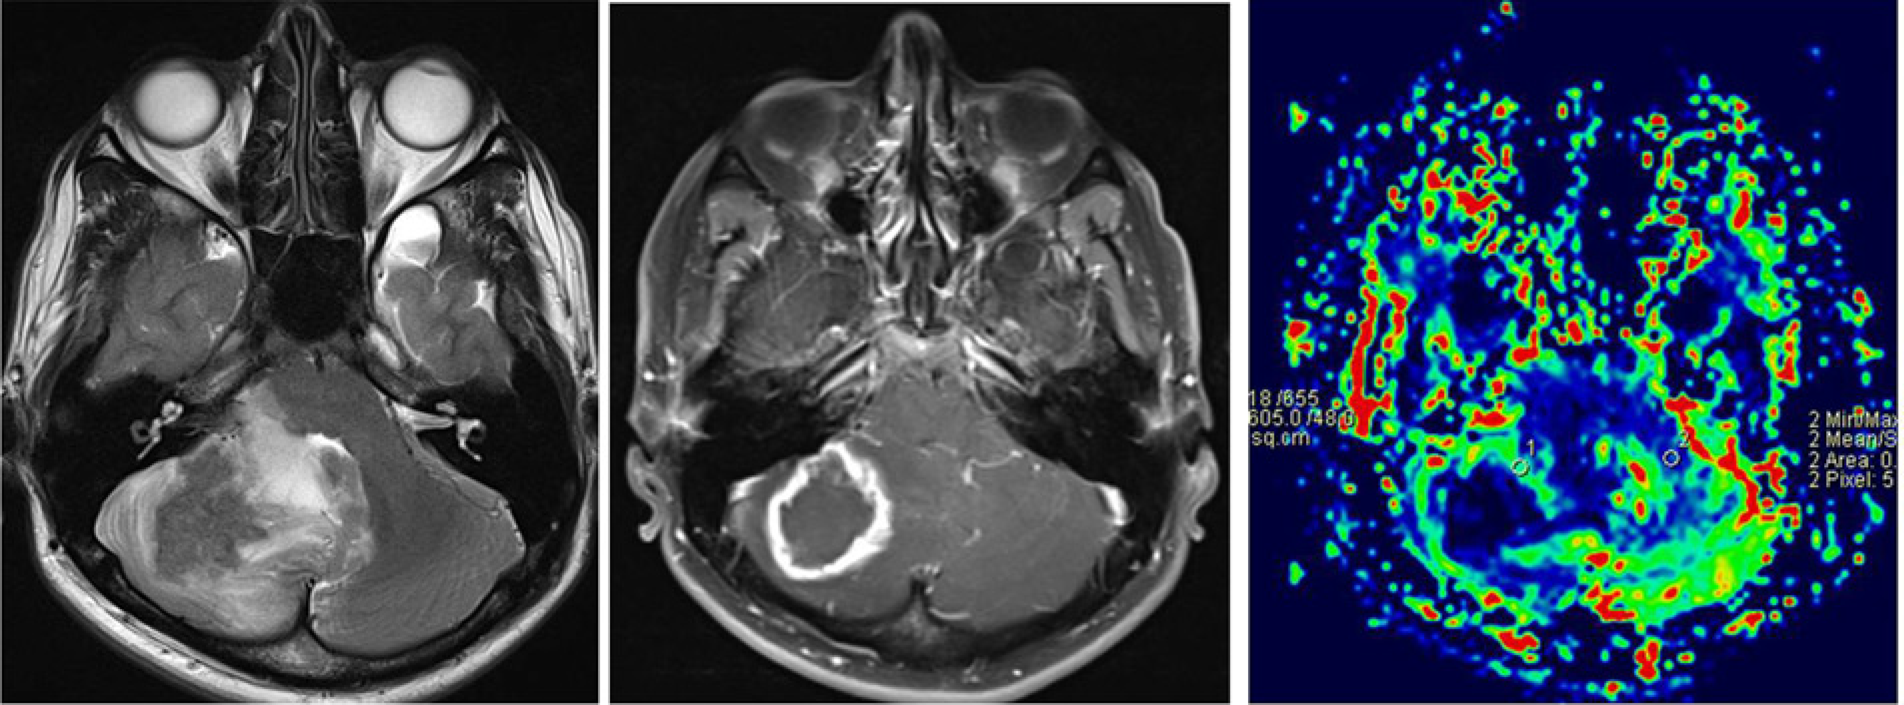
One patient in our study had multi-drug resistant TB involving the gastrointestinal tract along with CNS involvement. Serial perfusion studies done at the onset of therapy and after completing nine months of ATT revealed the rCBV ratio of the lesion to have dramatically increased from 2.9 in the first study to 6.5 in the follow-up study (Fig 4). The values of the first study were used for the analysis. The patient subsequently improved on appropriate therapy with complete resolution of the tuberculoma as documented on follow-up MRI done elsewhere (perfusion MRI was not performed as the lesion had resolved).
Serial perfusion maps of a patient with multi-drug resistant (MDR) TB. The second study was done after 9 months of treatment. It shows increased rCBV value of peripheral wall from 2.9 in the first study to 6.5 in the second
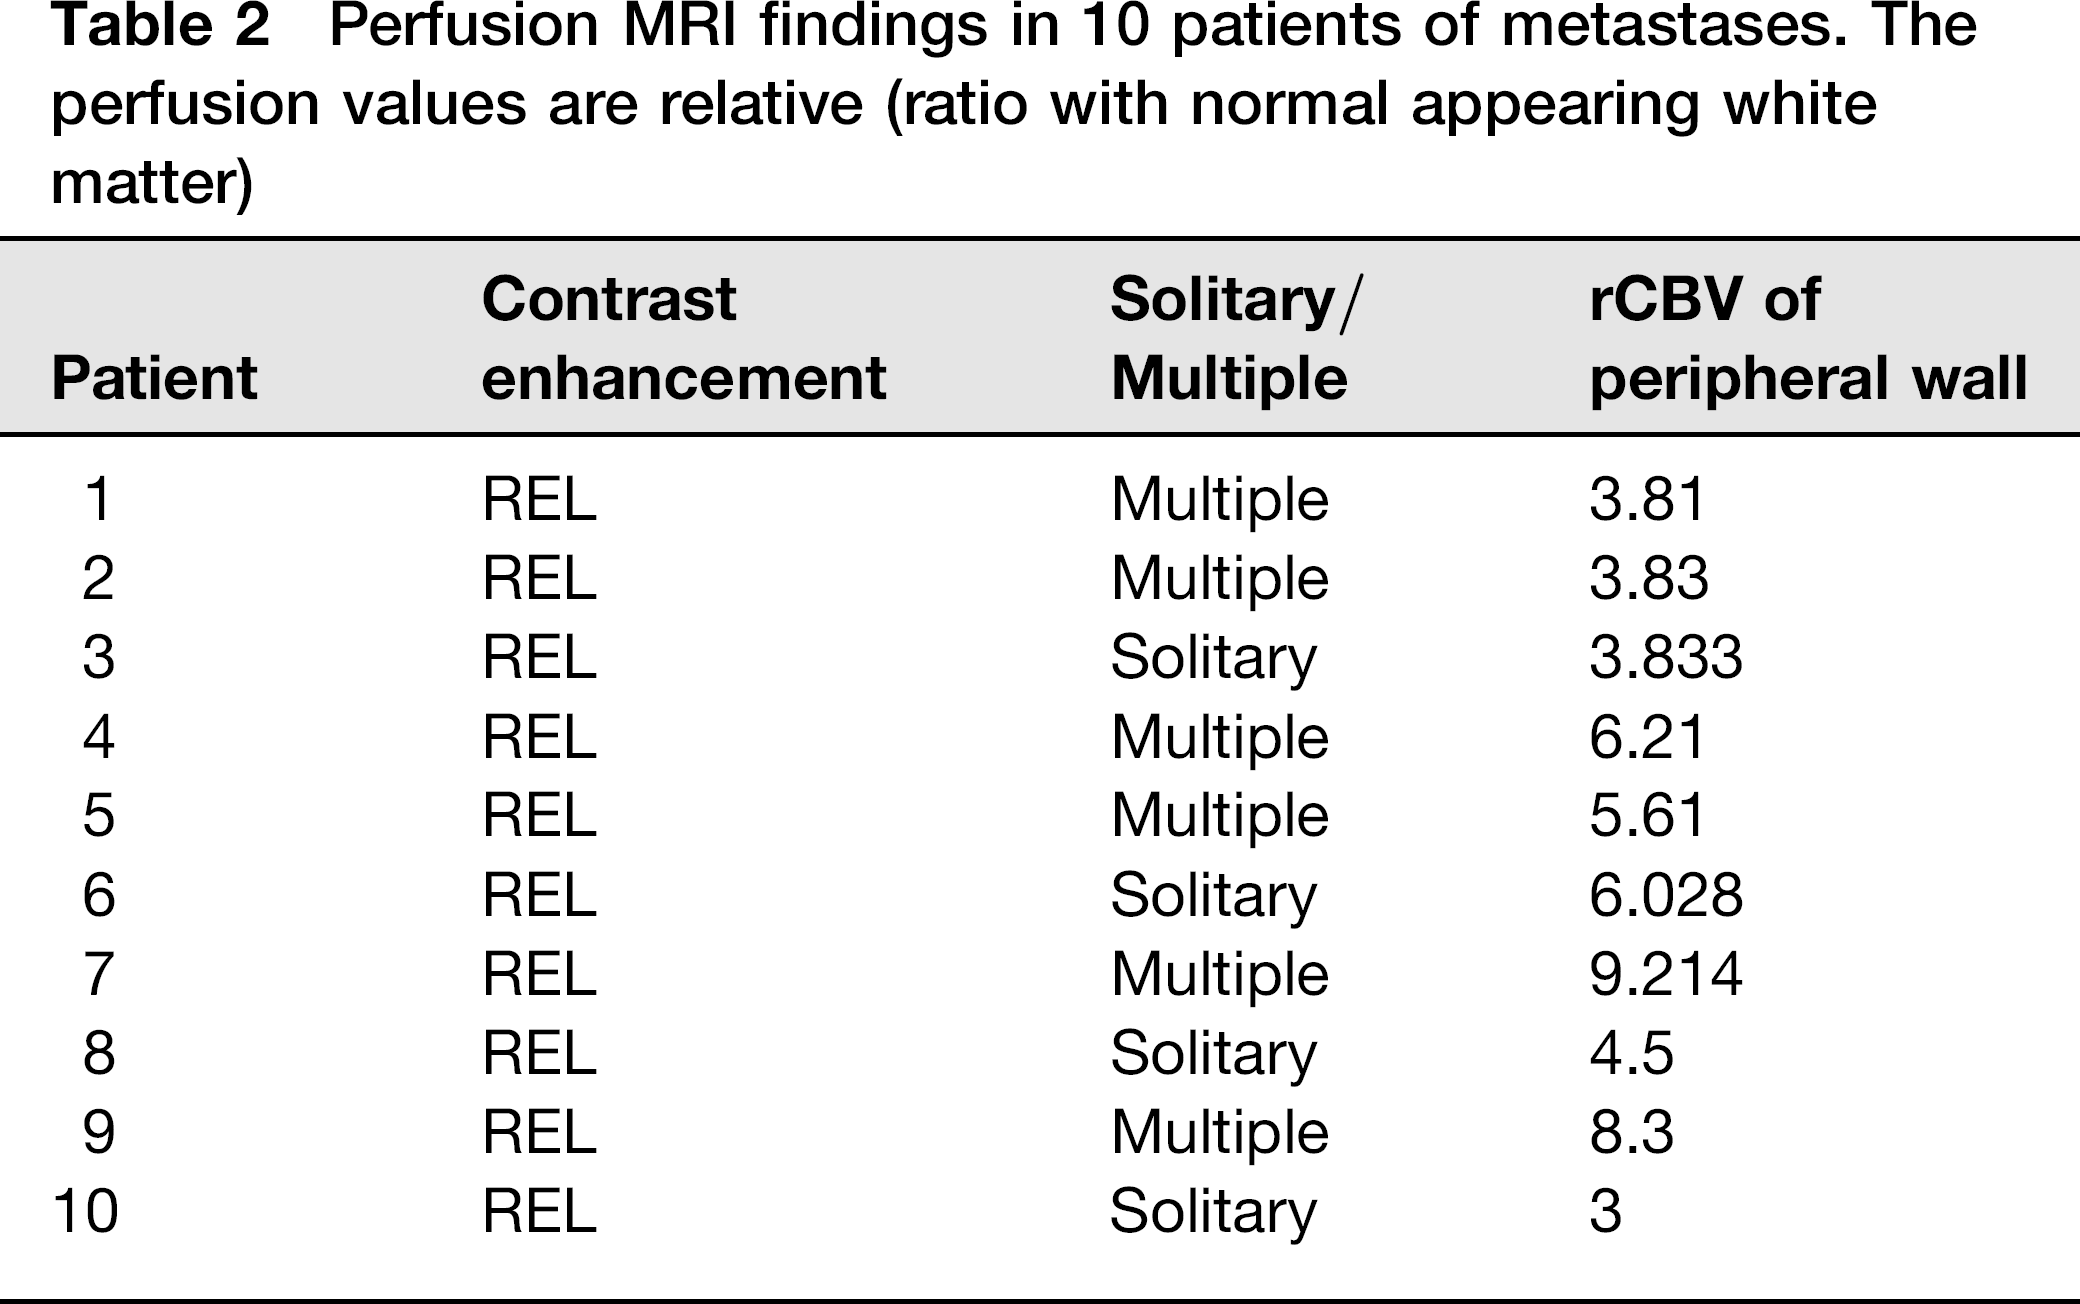
In case of metastases, three men and seven women were included in the study, all of whom had ring-enhancing metastases. The results are documented in Table2. Six patients (60%) had multiple lesions while the rest had a solitary metastasis. The lesions showed the mean rCBV ratio of the peripheral wall to be 5.43 ± 2.1 (mean ± SD), with the intralesional and perilesional neuroparenchyma being hypoperfused.
Perfusion MRI findings in 10 patients of metastases. The perfusion values are relative (ratio with normal appearing white matter)
Comparison of the rCBV values for ring-enhancing tuberculomas with the ring-enhancing metastases (Fig. 5) revealed statistically significant difference between the two values (P < 0.00001). Analysis of the values by ROC curve method revealed a cut-off value of ≥3.745 for metastasis, with a sensitivity of 90% and specificity of 100% for differentiating tuberculomas from metastases.
Perfusion maps of two different patients; the one on the left represents metastasis and the one on the right represents tuberculoma. The peripheral wall rCBV value of metastasis is higher than that of tuberculoma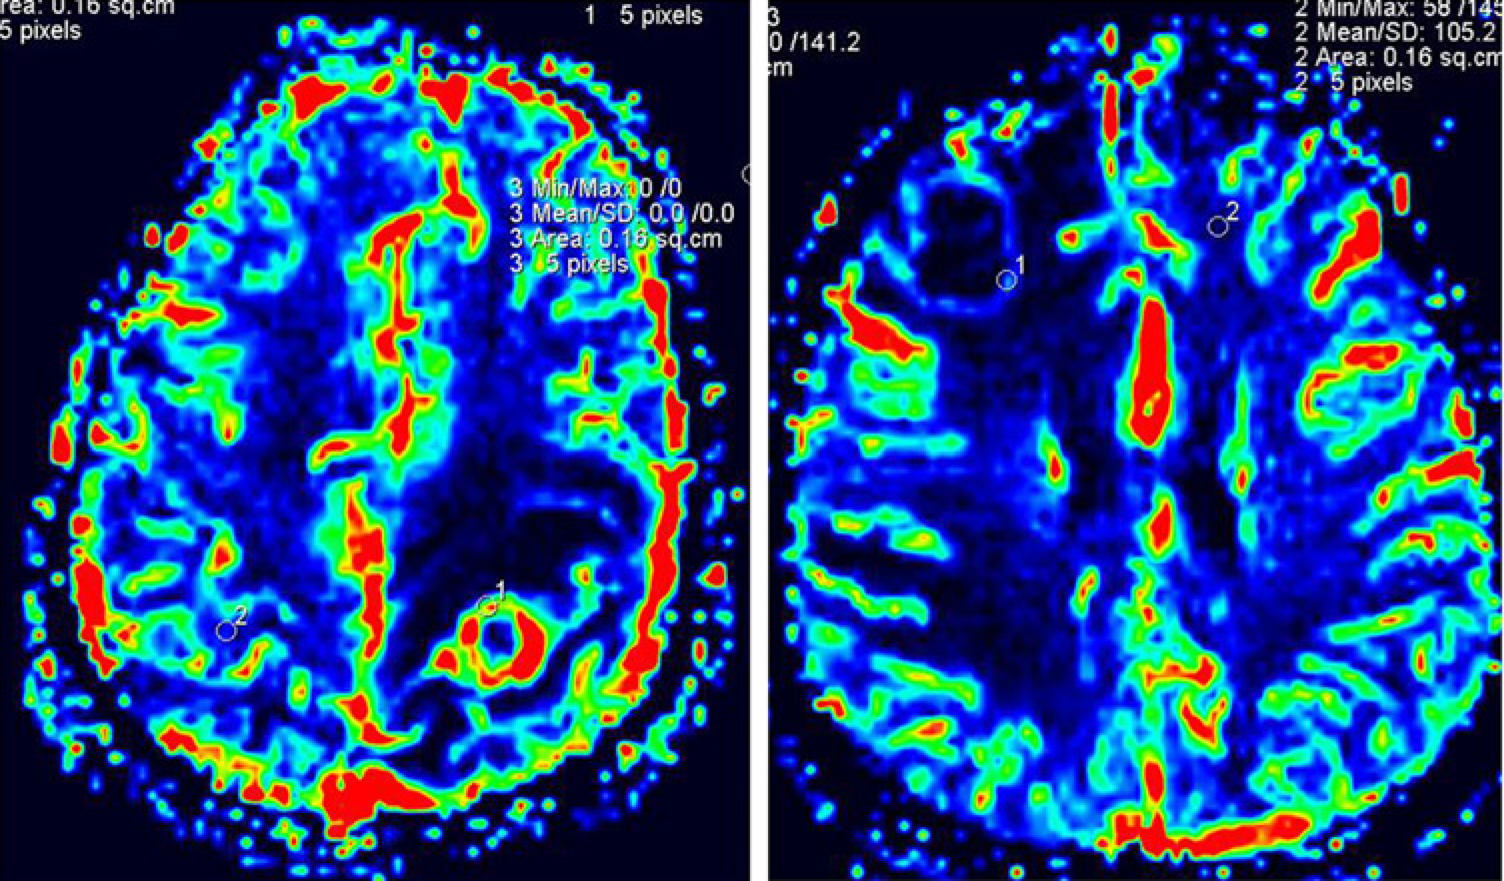
The results of the statistical analysis are summarized in Table3.
Summary of the analysis of Perfusion MRI findings in the study
Discussion
Intracranial tuberculomas are thought to arise from the conglomeration of tuberculous microgranulomas in an area of tuberculous cerebritis (5, 6). This initially leads to the formation of a non-caseating tuberculoma which then develops central solid caseous necrosis which may eventually liquefy. The conventional MRI appearance of the tuberculoma varies as per the stage of the disease (5–8). Non-caseating tuber-culomas are usually hyperintense on T2W and mildly hypointense on T1W images with homogenous contrast enhancement. Tuberculomas with solid caseation are iso- to hypointense on T2W and T1W images with a peripheral T2 iso- to hyperintense rim and shows rim enhancement. After the development of central caseation, the lesion appears T2 hyperintense with a peripheral hypointense rim and shows postcontrast rim enhancement. Thus, based on conventional imaging, the differential diagnosis of tuberculomas would include other infective lesions, metastases, gliomas, and lymphoma (6, 9).
Based on their imaging characteristics, the lesions we classified as NELs most likely represent non-caseating tuberculomas, while RELs represent tuberculomas with central caseation. Our data revealed NELs to have high rCBV values, whereas RELs had low central values. In a similar study by Batra et al. on 17 lesions, the mean rCBV value for the center of the lesion was 0.33 ±0.3 (mean ± SD), indicating that the lesions were hypoperfused (3). The study included four NELs, but it did not analyze RELs and NELs separately and revealed none of the tuberculomas to have central hyperperfusion. The study also revealed the peripheral wall to be hyperperfused with rCBV ratio of 2.5±1.42, while the perilesional white matter was hypoperfused (0.43±0.21), matching the findings of this study (3). A study by Chatterjee et al. found the peripheral wall of tuberculomas to be hypoperfused, with a mean rCBV of 0.90±0.49 (mean ± SD) (4). These data do not match this study nor the data of Batra et al. Only four patients with tuberculomas were included in the study, of which two had increased rCBV values (1.38 and 1.25) while two had decreased values (0.56 and 0.39).
Various studies on the perfusion characteristics of metastases have shown that these lesions have high rCBV values. Chatterjee et al. analyzed the rCBV ratio of ring-enhancing metastases in seven patients and found the mean rCBV to be 5.06 ± 2.13 (mean ± SD), concluding that rCBV ratios can help in differentiating between tuberculomas and metastases (4). A study of nine patients found the rCBV ratio in metastases to be 4.45 ± 1.87 (10), while another study of 17 metastases found it to be 3.21 ± 0.98 (11). We found the rCBV ratio in the peripheral wall to be 5.43 ± 2.1. This indicates that rCBV ratio can indeed be a useful tool in differentiating tuberculomas, which show relatively lower rCBV values, from metastases. We calculated a cut-off value of ≥ 3.745 for the same using ROC curve method for analysis.
In contrast to tuberculomas, other infective cerebral lesions have lower rCBV values as compared to the normal white matter. Ernst et al. studied the perfusion characteristics of five toxoplasmosis lesions and found them all to be hypoperfused, with rCBV ratio of 0.44 ± 0.24 (mean ±SD) (12). Chan et al. compared the perfusion findings of cerebral abscesses and infected brain tumors and demonstrated the wall of the abscess to be hypoperfused (0.45 ±0.11) whereas that of the neoplasm was hyper-perfused (2.9 ±0.62) (13). Thus perfusion MRI has great potential in helping differentiate tuberculomas from other cerebral infections. This can be particularly helpful in HIV-positive patients with RELs, where both tuberculomas and toxoplasmosis are diagnostic considerations.
This study revealed nodular enhancing tuberculomas to have high central rCBV values. This finding is similar to the perfusion characteristics of gliomas (10, 11.) Law et al. analyzed the perilesional rCBV values in high-grade gliomas and metastases and demonstrated high grade gliomas to have high values (mean ± SD: 1.31±0.97) as compared to metastases (mean ± SD: 0.30±0.19) (14). Bulakbasi et al. analyzed the diagnostic accuracy of MR perfusion in differentiating primary and metastatic solitary brain tumors and concluded that cut-off values of perilesional rCBV ratios of 1.1 and 1.2 were quite accurate in differentiating metastases from low-grade and high-grade glial tumors, respectively (10). Similarly, perilesional rCBV values can be used to differentiate glial tumors from nodular enhancing tuberculomas which showed low perilesional rCBV ratios in this study.
The raised rCBV values observed in tuberculomas are consistent with the histopathological progression of these lesions. The initial non-caseating tuberculoma consists of central epithelioid cells surrounded by mononuclear inflammatory infiltrate, giant cells, and fibroblasts. This then develops central caseation due to the body's immune response with resultant inflammation and reactive neovascularity (15, 16). The raised rCBV ratio in tuberculomas correlates with increased angiogenic activity in its cellular portion secondary to increased expression of vascular endothelial growth factor (17). The low rCBV value in the perilesional edema is due to vasoconstriction secondary to the raised interstitial pressure. A similar mechanism also leads to the low perilesional rCBV values found in metastases, whereas gliomas have high rCBV ratios due to microscopic tumoral infiltration beyond the outer enhancing margin visible on MRI (14). Thus, perilesional rCBV values can be used to differentiate tuberculomas from gliomas, but cannot be used to differentiate them from metastases.
One patient in this study with multi-drug resistant TB demonstrated a drastic increase in the rCBV value on the follow-up study (from 2.9 to 6.5). This indicates a potential role of serial perfusion MRI in early pick-up of drug resistant TB. On the other hand, follow-up studies of two patients showing clinicoradiological improvement on routine ATT demonstrated hypoperfused peripheral walls. The authors have seen two more proven cases of resistant tuberculoma having high perilesional rCBV values previously as well. This finding correlates with the study of Haris et al., which concluded that MR perfusion can help predict therapeutic response in patients of cerebral tuberculomas (18).
The limitation of this study was the lack of histopathologic correlation for confirmation of diagnosis, quantification of angiogenesis, and differentiation of non-caseating from caseating tuberculomas. Surgical resection of tuberculomas is rarely indicated over ATT, thus leading to difficulty in obtaining a pathological confirmation. Also, although the sample size in our study was much larger than that in other similar studies, a larger study would better establish these findings, particularly for NELs.
It is important to interpret these findings with caution, as there is a slight overlap between the values of highly perfused tuberculomas (and possibly drug-resistant tuberculomas) and metastases having relatively low perfusion obtained in the study. Another potential differential to be considered in immunocompromised patients would be ring-enhancing lymphomas, which may also show mild to moderate increased perfusion in the periphery (12). It should also be kept in mind that in patients with multiple tuberculomas, only the highest perfused tuberculoma was included in the study, and the other lesions may have low values.
In conclusion, perfusion MRI is clearly an added tool for the assessment of tuberculomas and is useful in lesion characterization and diagnosis. RELs and NELs show different perfusion characteristics. NELs have raised intralesional rCBV values similar to gliomas, but low perilesional rCBV values in the former help in differentiating the two. Peripheral wall rCBV values may help differentiate RELs from metastases. MR perfusion also has a potential role in monitoring therapy and for early detection of drug resistance. Further studies are required to ascertain and define these roles.