
Abstract
Background
Heterogeneity of arterial transit time due to cerebral artery steno-occlusive lesions hampers accurate regional cerebral blood flow measurement by arterial spin labeling (ASL).
Purpose
To assess the feasibility of regional cerebral blood flow measurement by ASL with multiple-delay time sampling in patients with steno-occlusive diseases by comparing with positron emission tomography (PET), and to determine whether regional arterial transit time measured by this ASL technique is correlated with regional mean transit time, a PET index of perfusion pressure.
Material and Methods
Sixteen patients with steno-occlusive diseases received both ASL and 15O-PET. The mean regional cerebral blood flow measured by ASL and PET, regional arterial transit time by ASL, and regional mean transit time by PET were obtained by a region-of-interest analysis. Correlation between regional cerebral blood flow by ASL and that by PET, and correlation between regional arterial transit time by ASL and regional mean transit time by PET were tested using Pearson's correlation coefficient for both absolute and relative values. A multivariate regression analysis was performed to test whether regional arterial transit time by ASL was a significant contributor in modeling regional mean transit time by PET after controlling the effect of regional cerebral blood flow by ASL.
Results
A significant positive correlation was found between regional cerebral blood flow by ASL and that by PET for both absolute (r = 0.520, P < 0.0001) and relative (r = 0.691, P < 0.0001) values. A significant positive correlation was found between regional arterial transit time by ASL and regional mean transit time by PET both for absolute (r = 0.369, P = 0.0002) and relative (r = 0.443, P < 0.0001) values. The regression analysis revealed that regional arterial transit time by ASL was a significant contributor in modeling regional mean transit time by PET after controlling regional cerebral blood flow by ASL (P = 0.0011).
Conclusion
The feasibility of regional cerebral blood flow measurement using ASL with multiple-delay time sampling was confirmed in patients with cerebral artery steno-occlusive diseases. Moreover, it was suggested that mapping of regional arterial transit time has the potential to detect hemodynamic impairment.
Arterial spin labeling (ASL) is an MR technique for regional cerebral blood flow (rCBF) measurement which utilizes magnetically labeled spins in the inflowing arterial blood as an intrinsic tracer (1). With its non-invasiveness and potential for quantitative rCBF measurement, ASL has been drawing much attention as a new imaging tool for clinical and basic research. A major limitation of the conventional ASL is its sensitivity to arterial transit time (ATT), which denotes the duration for the labeled blood to travel from the labeling region to the vascular compartment of imaging slices. Heterogeneity of ATT due to the presence of arterial steno-occlusive lesions and consequential development of collateral blood supply results in inaccurate rCBF measurements, especially with pulsed ASL methods (2, 3). In such cases, prolonged ATT may result in serious under-estimation of rCBF, or conversely in over-estimation of rCBF depending on the residual labeled blood in stagnant large vessels. In practice, such effects have severely hampered the clinical use of ASL for the evaluation of patients with steno-occlusive cerebrovascular diseases. Recently, ASL methods with multiple-delay time sampling have been developed to address this issue (4–6), and have been used to study patients with steno-occlusive lesions. However, the accuracy of these techniques is not yet established, and has rarely been validated by comparing with positron emission tomography (PET), the current gold standard technique for in-vivo cerebral perfusion measurement (7). With ASL with multiple-delay time sampling, parametric maps of regional ATT (rATT) can be obtained. It has recently been reported that rATT mapping revealed an altered hemodynamic status in patients with steno-occlusive lesions (8, 9). Thus, this ASL technique may provide, in addition to rCBF, useful information to detect hemodynamic impairment that may or may not be associated with rCBF reduction. However, the pathological changes in the rATT have never been compared with the quantitative hemodynamic index measured by other imaging modalities. We hypothesized that rATT correlates with the regional mean transit time (rMTT), a PET index for local perfusion pressure.
Therefore, our purposes in this study were: (i) to assess the feasibility of rCBF measurement by ASL with multiple-delay time sampling in patients with chronic steno-occlusive cerebrovascular diseases by comparing with PET; and (ii) to determine whether rATT by ASL is correlated with rMTT by PET.
Material and Methods
This analytical cross-sectional study was approved by the regional institutional review board. Clinical and imaging data of patients were reviewed retrospectively, and the need to obtain informed consent was waived.
Subjects
We retrospectively analyzed MR and PET images of 18 consecutive patients with chronic cerebral arterial steno-occlusive diseases who received MRI examination including ASL and
MR imaging
The MR imaging was performed on a 3 T imager and an 8-channel head array receiving coil (Achieva Quasar Dual, Philips Healthcare, Best, The Netherlands). ASL was performed using the quantitative signal targeting by alternating radiofrequency pulse labeling of arterial regions (QUASAR) (6). QUASAR is a pulsed ASL method with multiple-delay time sampling based on the Look-Locker technique (11, 12) proposed by Petersen et al. (6). The details of this technique have been published elsewhere (6). Our protocol consisted of 84 dynamics or 42 pairs of labeled and non-labeled image acquisitions. Seven transverse slices (slice-thickness/gap = 6/2 mm) covered a 54-mm-thick imaging volume above a plane including the anterior and posterior commisures (AC and PC). Along with ASL images, three-dimensional (3D) T1-weighted whole brain images and 3D time-of-flight MRA of the brain and neck were also obtained for each patient. The 3D T1-weighted images were reconstructed into 1-mm thick contiguous slices along the AC-PC line. Imaging parameters for each sequence are summarized in Table 1.
MR imaging parameters
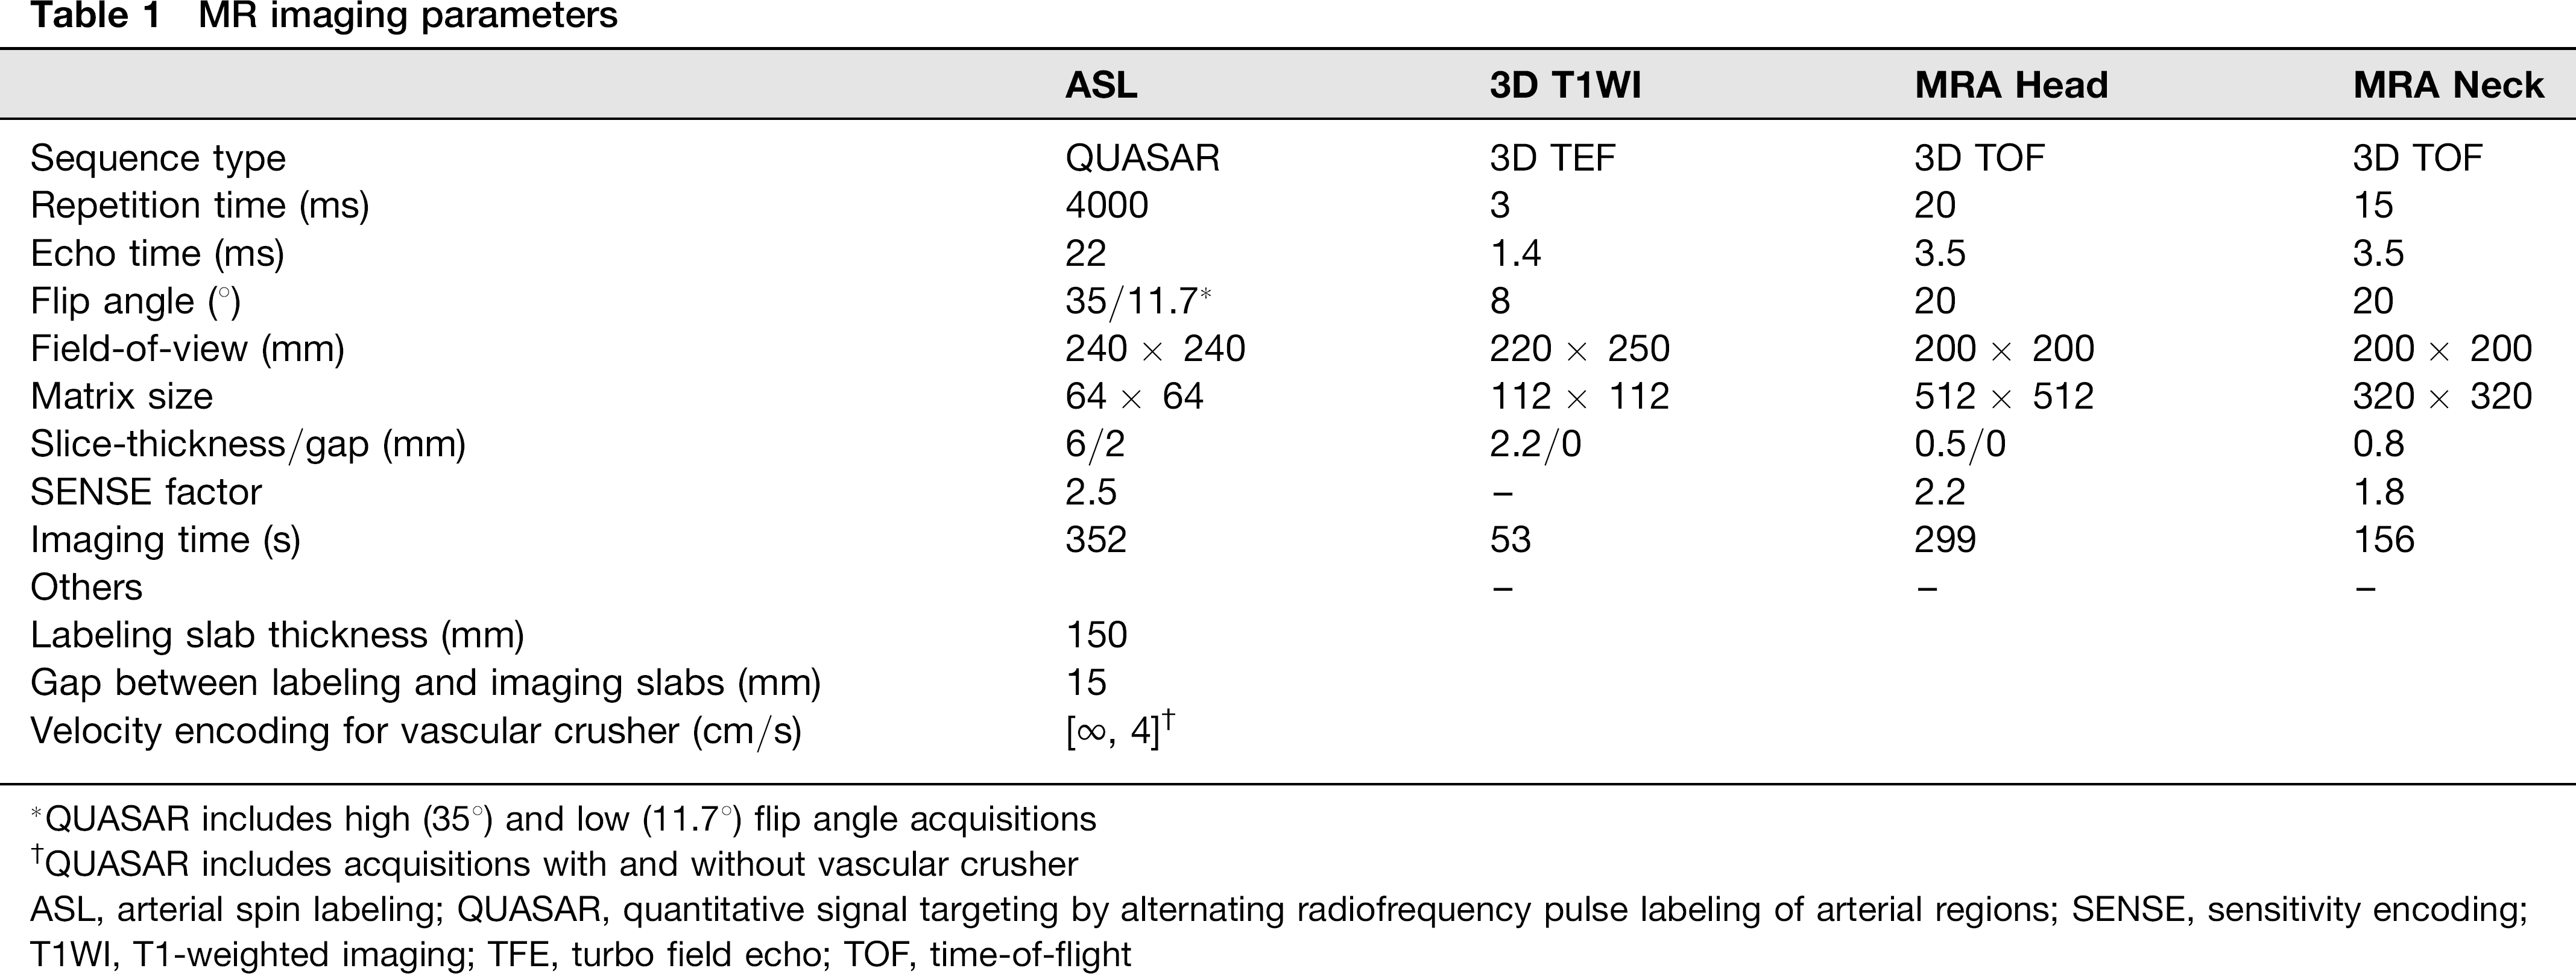
QUASAR includes high (358) and low (11.7°) flip angle acquisitions
QUASAR includes acquisitions with and without vascular crusher
ASL, arterial spin labeling; QUASAR, quantitative signal targeting by alternating radiofrequency pulse labeling of arterial regions; SENSE, sensitivity encoding; T1WI, T1-weighted imaging; TFE, turbo field echo; TOF, time-of-flight
Maps of rCBF and rATT were obtained by using dedicated software running on IDL (Research Systems, Boulder, CO, USA), which was developed and provided by Petersen (National Neuroscience Institute, Singapore). Perfusion-related signals were obtained by subtracting labeled data from non-labeled data. Absolute rCBF was calculated through deconvolution of the perfusion-related signal intensity in each voxel by the local arterial input function (AIF). AIF was obtained by subtracting the crushed data from non-crushed data. The following constants were used in the rCBF calculation: T1 of arterial blood, 1.65 s; inversion efficiency, 95%; blood-brain partition coefficients for gray and white matter, 0.98 and 0.82, respectively. rATT was measured by detecting the onset of the perfusion-related tissue-signal-intensity rise in each voxel in the non-crushed images by using the edge-detection algorithm proposed by Canny (13).
PET imaging
PET scans were performed with an ECAT EXACT HR + device (Siemens, Knoxville, TN, USA) having a spatial resolution of 4.2 mm in the full-width at half-maximum, and 63 contiguous slices were simultaneously obtained at intervals of 2.3 mm. A transmission scan was obtained for each subject for the attenuation correction. The rCBF was measured by the
Image analyses
The parametric maps obtained from ASL (rCBF and rATT) and PET (rCBF and rCBV) were co-registered to the 3D T1-weighted images of each subject using SPM2 software (Wellcome Trust Center for Neuroimaging, London, UK, http://www.fil.ion.ucl.ac.uk/spm/software/spm2/). The values of the four parameters were measured by region-of-interest (ROI) analysis on a single slice that coincided with the fourth slice of the ASL images from the most inferior slice including the AC-PC line. This slice approximately corresponded to the level of the body of the lateral ventricles (Fig. 1). In this slice of the T1-weighted image, six ROIs were placed in each hemisphere (12 for each brain) by a consensus of two board-certified radiologists who were blinded to the clinical and imaging information in the cortical regions in the anterior, middle, and posterior artery (ACA, MCA, and PCA) territories, anterior and posterior border zones (ABZ and PBZ), and cerebral white matter (WM), according to the established flow territory templates (Fig. 1) (14). The size of the ROIs ranged from 116 to 376 mm2 . Infarcted areas which showed a hypointensity on the T1-weighted image were manually avoided. These ROIs were subsequently transferred to the co-registered parametric maps for analysis. The mean values of respective perfusion parameters within each ROI were measured. MTT by PET was calculated as CBV/CBF for each ROI. In addition to the absolute value, the relative value of each parameter was obtained as the absolute value in each ROI divided by the total value in all the ROIs used for analysis. All 12 ROIs were used for the analysis of rCBF. For correlation between the rATT-ASL and rMTT-PET, only six ROIs (three for each hemisphere) in the bilateral ACA, MCA, and PCA territories were used. The ROIs in ABZ, PBZ, and WM were not used because rATT in these regions are known to be physiologically longer than those in the major vascular territories (15, 16). In addition, the ROIs for rATT-ASL measurement were classified into those with normal rMTT-PET and those with prolonged rMTT-PET. Based on the approximation of the previously published values of normal MTT in the cerebral cortex (17-20), ROIs with an rMTT-PET that equals to or shorter than 7 s were included in the ‘normal’ group, while ROIs with longer rMTT-PET were defined as the ‘prolonged’ group.

Statistical analyses
Correlation between rCBF measured by ASL and PET was tested using Pearson's correlation coefficient for both absolute and relative values. In addition, agreement of rCBF measurement between ASL and PET was evaluated by means of the intraclass correlation coefficient (ICC). The following criteria were used (21): ICC < 0.4, poor; 0.4 ≤ ICC ≤ 0.59, fair; 0.6 ≤ ICC ≤ 0.74, good; ICC ≥ 0.75, excellent. Furthermore, Bland-Altman plots were generated to display the spread of the data and the level of agreement.
Correlation between the rATT-ASL and rMTT-PET was analyzed using Pearson's correlation coefficient for both absolute and relative values. A multivariate regression analysis based on the least-square method was performed to test whether the rATT-ASL was a significant contributor in modeling the rMTT-PET after controlling the effect of rCBF-ASL. The mean rATT-ASL values were compared between the ROIs of normal and prolonged rMTT-PET using the t test. Nominal univariate logistic analysis was performed to determine whether longer rATT-ASL was significantly associated with prolonged rMTT-PET (>7 s). For comparison, rCBF-ASL and the vascular territory (ACA vs MCA vs. PCA) were also tested by the univariate logistic analysis. Multivariate logistic analysis was performed including rATT and vascular territory as independent variables. Bland-Altman plot was generated using GraphPad Prism 5.04 (GraphPad Software, La Jolla, CA, USA). The other analyses were performed using IBM SPSS Statistics 19 (IBM, Armonk, NY, USA). For all statistical analyses, P values < 0.05 were considered to be significant.
Results
One patient was excluded due to motion-related ASL image degradation. Additionally, one patient who presented with new neurologic symptoms between the MRI and PET examinations was excluded. Consequently, 16 patients (11 men, 5 women; age range, 24–79 years; median, 64 years) met the inclusion/exclusion criteria and were included in the study. The clinical characteristics of the study population are summarized in Table 2. Three patients had received a superficial temporal–middle cerebral artery (STA-MCA) bypass surgery. The interval between the ASL and PET ranged from 1 to 37 days (median, 11 days).
Patient characteristics

B, bilateral; ICA, internal carotid artery; L, left; MCA, middle cerebral artery; R, right; STA, superficial temporal artery
Scatter plots of rCBF-ASL against rCBF-PET for absolute and relative values are shown in Fig. 2a and b, respectively. A significant positive correlation was found between rCBF-ASL and rCBF-PET for both absolute (r = 0.520, P < 0.0001) and relative (r = 0.691, P < 0.0001) values. The agreement in absolute rCBF measurement between ASL and PET was fair: the ICC was 0.463 with a 95% confidence interval (CI) of 0.344–0.567, while the agreement for the relative rCBF was good: the ICC was 0.608 with a 95% CI of 0.511–0.690. Bland-Altman plot for the absolute rCBF demonstrated that the mean rCBF difference between ASL and PET was 0.43 mL/100 g/min and the standard deviation (SD) was 11.6 mL/100 g/min (Fig. 3a). The difference (rCBF-ASL minus rCBF-PET) tended to be positive when the average was high, suggesting the existence of a proportional bias (Fig. 3a). The plot for the relative rCBF displayed similar results to those for absolute rCBF. The mean difference in relative rCBF between the two modalities was 0 and the SD was 0.26 (Fig. 3b). A proportional bias was noted in a way that the difference tended to be positive when the average was high (Fig. 3b).
Absolute (a) and relative (b) regional cerebral blood flow (rCBF) values measured by arterial spin labeling (ASL) plotted against those measured by positron emission tomography (PET). The data are representative of all 16 patients (12 ROIs for each patient). In each graph, the solid line shows the line of equality Bland-Altman plots for the absolute (a) and relative (b) rCBF values to evaluate the agreement between ASL and PET measurements. In each plot, the broken line indicates the mean of the differences, and the solid line indicates ±1.96 x standard deviation (SD) of the differences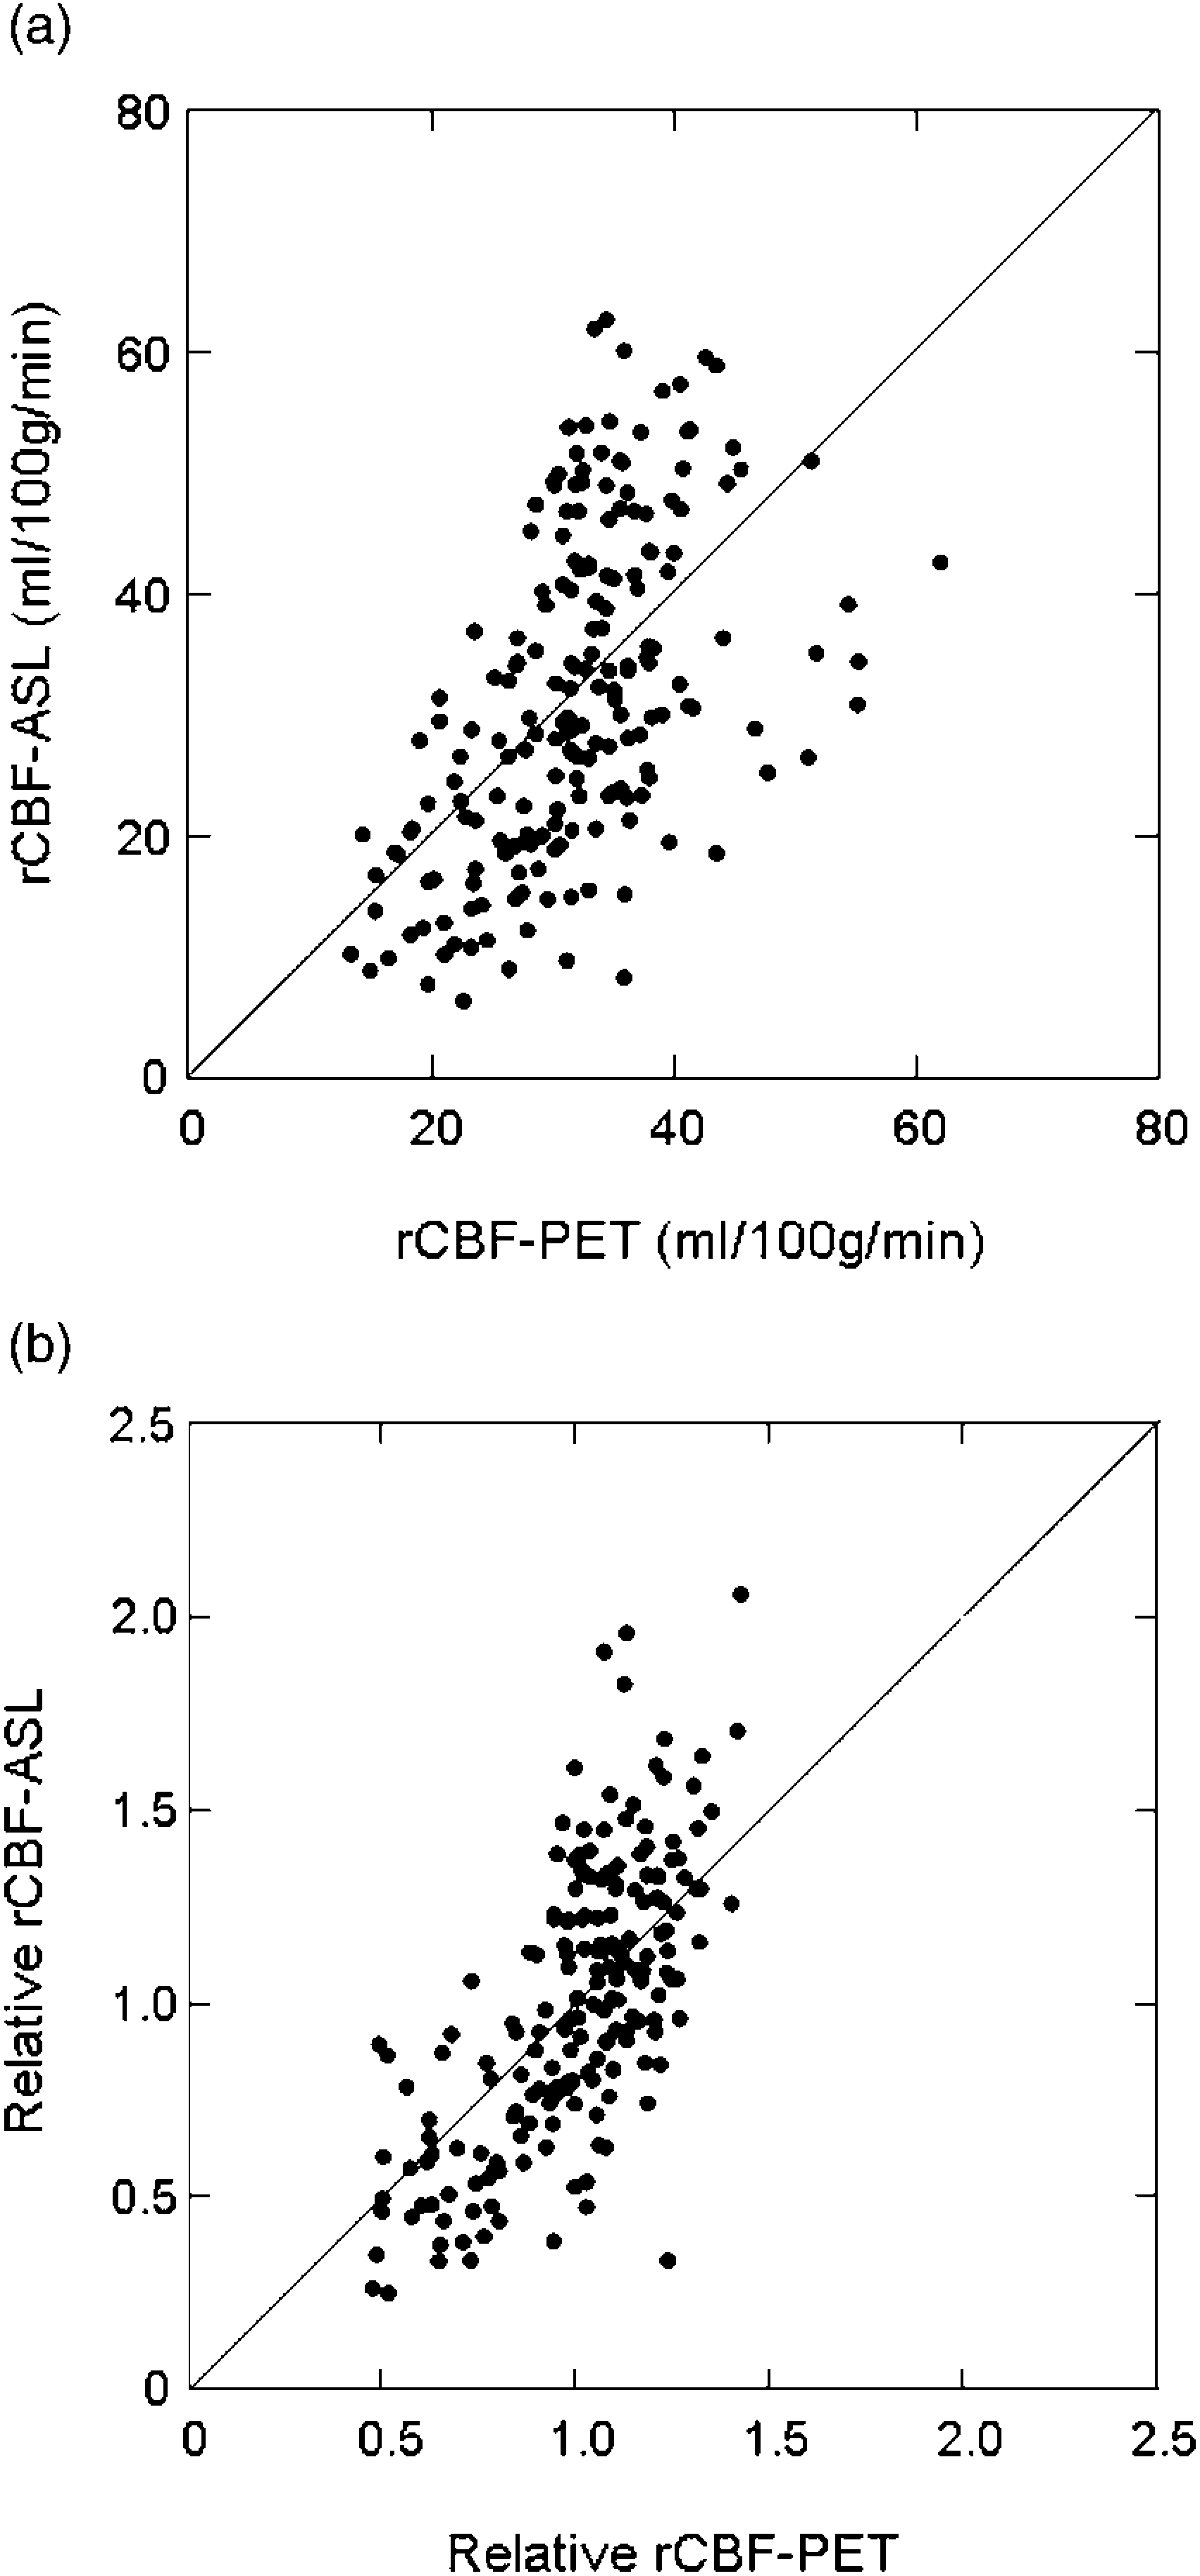

A significant positive correlation was found between the absolute rATT-ASL and absolute rMTT-PET (r = 0.369, P = 0.0002) (Fig. 4a) and between the relative rATT-ASL and relative rMTT-PET (r = 0.443, P < 0.0001) (Fig. 4b), respectively. The multivariate regression analysis revealed that the rATT-ASL was a significant contributor in modeling the rMTT-PET after controlling the effect of rCBF-ASL (P = 0.0011).
Comparison between regional arterial transit time (rATT) measured by ASL and regional mean transit time (rMTT) by PET for the absolute (a) and relative (b) values. The data are representative of all 16 patients (6 ROIs for each patient)
Thirty-two ROIs (7 ACA, 14 MCA, and 11 PCA) were classified into the prolonged rMTT-PET group while the remaining 64 were classified into the normal rMTT group. Comparison of rATT-ASL values resulted in significantly prolonged rATT-ASL (mean ± SEM = 0.390 ± 0.020 s) in the group with prolonged rMTT-PET compared with the normal group (mean ± SEM = 0.309 ± 0.014 s) (P = 0.0018). The univariate logistic analysis revealed that the longer rATT-ASL was significantly associated with prolonged rMTT-PET (P = 0.0039, Odds ratio = 4.25 × 10², 95% CI 2.18-10.49), whereas neither rCBF-ASL nor the vascular territory showed a significant association (P > 0.05). The multivariate logistic analysis showed that the association of rATT with prolonged rMTT remained significant after controlling for the effect of vascular territory (P= 0.0110, Odds ratio = 2.76 × 10², 95% CI 1.53-10.29).
Fig. 5 shows images of a patient with left internal carotid artery (ICA) occlusion.
Images of a patient with left internal carotid artery (ICA) occlusion (patient no. 2 in Table 2). The maps of rCBF by ASL (a) and rCBF by PET (c) show a decreased rCBF over the left cerebral cortex. Mapping of rATT by ASL shows a prolonged rATT in the left hemisphere (b). Mapping of regional cerebral blood volume (rCBV) by PET (d) shows an increased rCBV in the same region, revealing prolonged rMTT. A T1-weighted image at the corresponding level (e) and MR angiogram of the anterior circulation (f) are also shown. Note the occluded left ICA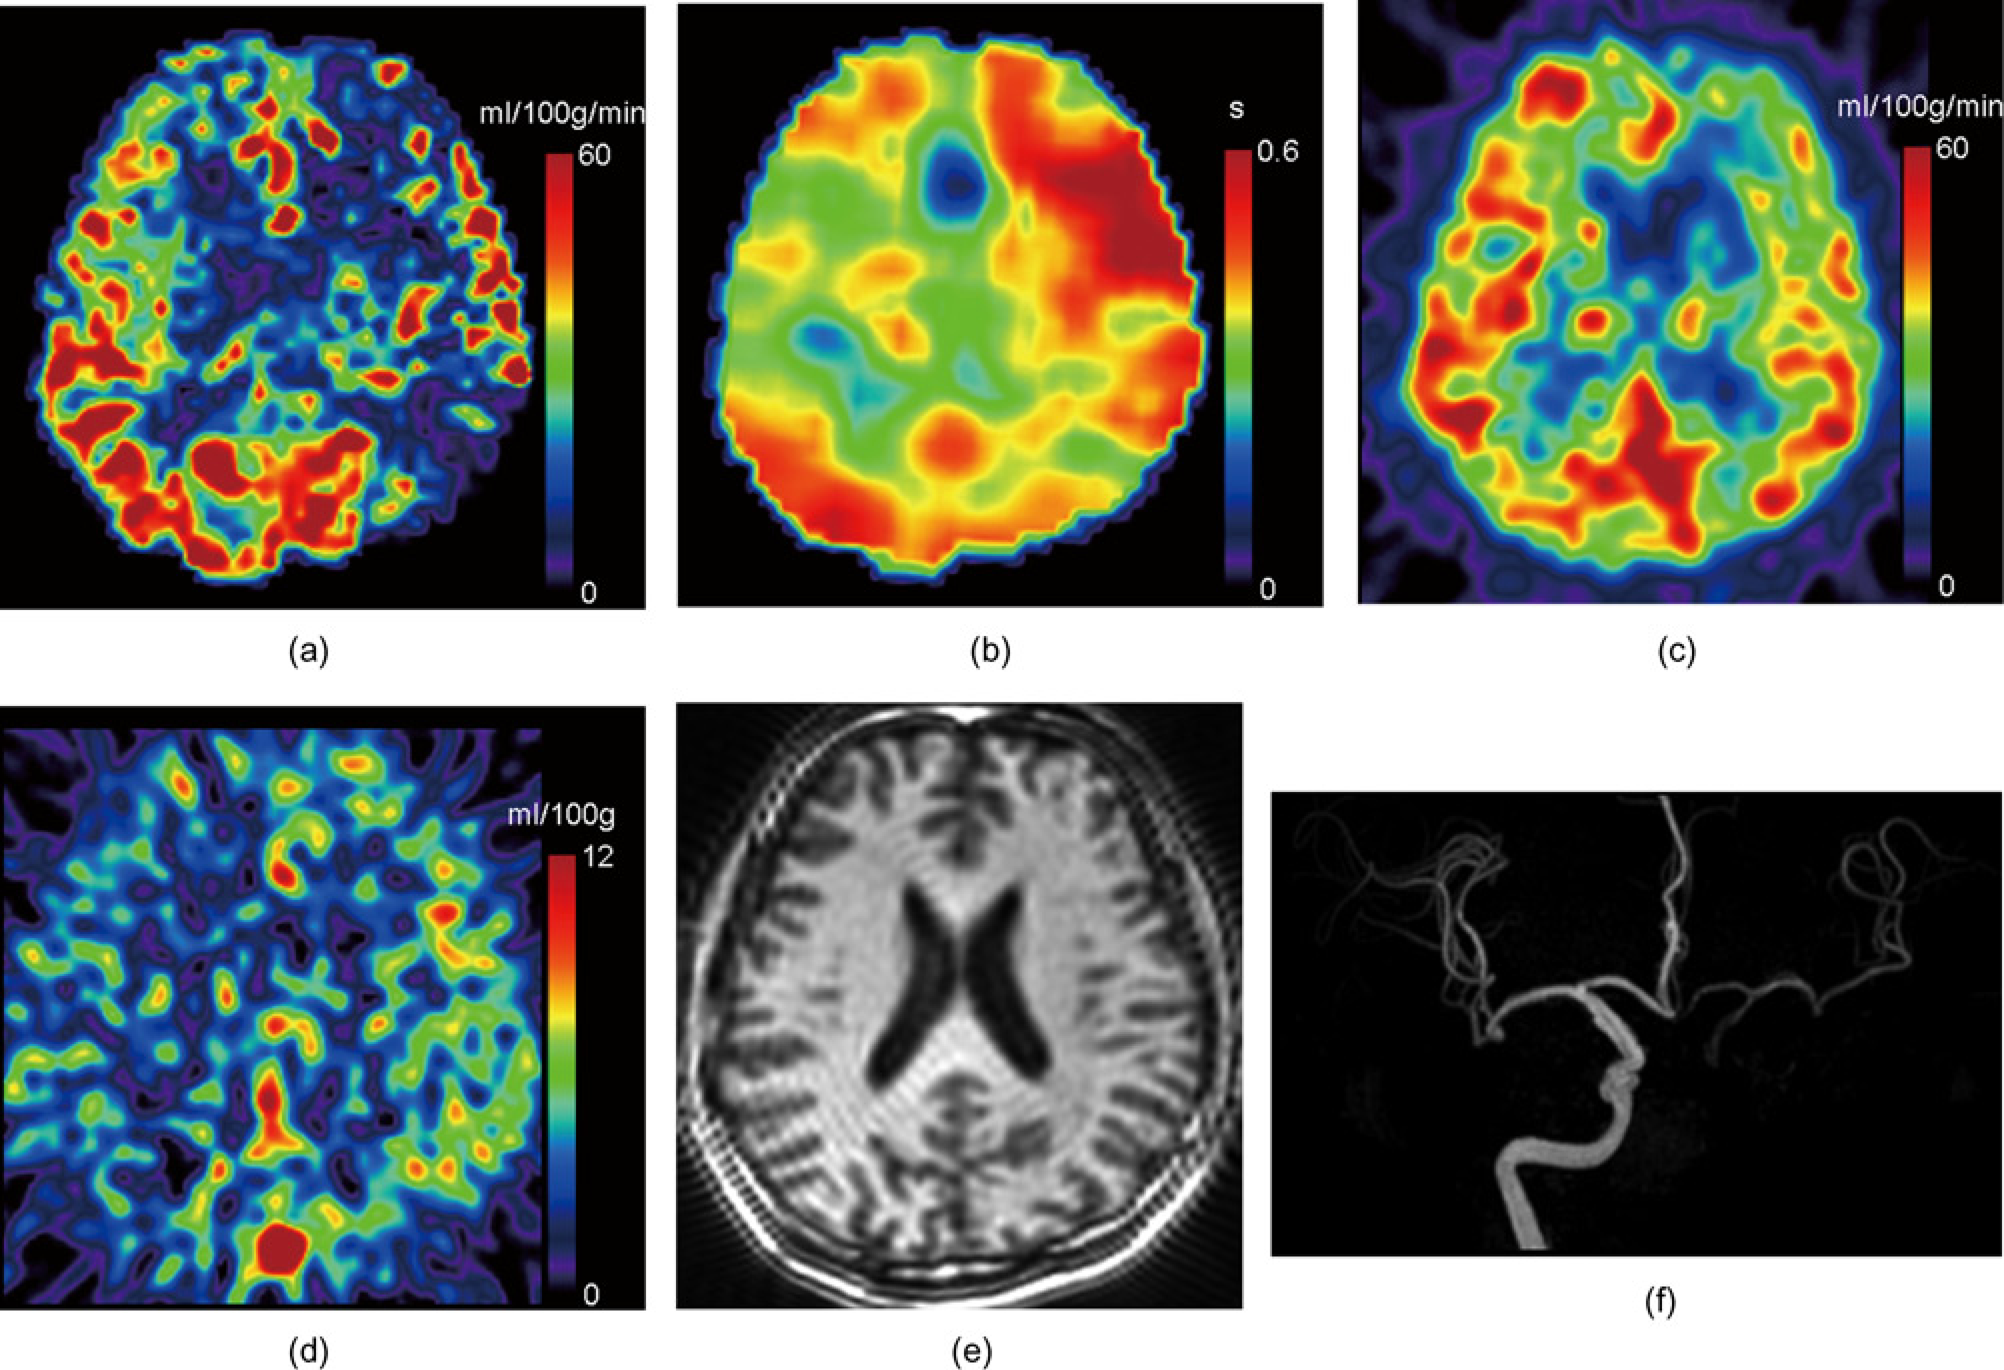
Discussion
Our ASL-PET comparisons showed a moderate correlation and fair agreement for absolute rCBF measurement. These results suggest that quantitative rCBF measurement using ASL with multiple-delay time sampling (QUASAR) is feasible in cases with steno-occlusive diseases. This is in line with a previous report by Bokkers et al. (7) who used a similar quantitative ASL technique but without vascular crusher gradients to evaluate patients with a symptomatic ICA occlusion, and found a moderate correlation (r = 0.58) between ASL and PET rCBF measurements.
Our results showed a better correlation and agreement between ASL and PET for relative rCBF measurement than for absolute rCBF measurement, demonstrating that ASL is more reliable when it is used to evaluate relative rCBF. This seems to be reasonable, since the normalization compensates for some portion of the measurement error, including that arising during scaling of the rCBF, such as inaccuracy in M0 measurement.
Bland-Altman plot suggested that there was no additive systematic error between rCBF-ASL and rCBF-PET (Fig. 3). Bokkers et al. (7) reported a systematic over-estimation in ASL measurement compared to the gold standard PET measurement. The rCBF over-estimation in ASL measurement has been attributed to the signals from the intravascular labeled blood (22). The lack of systematic over-estimation in our data was likely due to the use of a vascular crusher in our sequence (Table 1), which effectively suppresses intra-vascular signals. On the other hand, a proportional systematic error was found in both absolute and relative rCBF measurements by ASL: the difference (rCBF-ASL minus rCBF-PET) tended to be positive when the average was high (Fig. 3a and b). This error could be explained by either under-estimation of rCBF-ASL due to the residual effect of ATT prolongation in low rCBF regions that was not fully corrected by the multiple-delay time sampling scheme of QUASAR or over-estimation of rCBF-ASL due to the effect of intravascular labeled blood that the vascular gradients failed to crush, or both of the two.
We found a significant positive correlation between rATT-ASL and rMTT-PET for both absolute (Fig. 4a) and relative (Fig. 4b) values. Moreover, rATT-ASL in the ROIs with prolonged rMTT-PET was significantly longer than that in the ROIs with normal rMTT. The logistic analysis revealed that the rATT-ALS, but not rCBF-ASL was a significant predictor of rMTT-PET prolongation. These results suggest that ATT has the potential to detect hemodynamic impairment, which may not be associated with rCBF reduction. To the best of our knowledge, this is the first report correlating ATT with a quantitative hemodynamic index measured by other imaging modalities. Unlike MTT, ATT is not an inherently physiological parameter. Nevertheless, a few previous reports have shown that ATT provides useful information regarding the hemodynamic status in patients with cerebrovascular diseases. For example, Bokkers et al. (8) reported prolonged ATT in the ABZ and MCA territory on the affected side of patients with ICA occlusion. Macintosh et al. (9) reported asymmetrical prolongation of ATT in the affected cerebral hemisphere in patients with transient ischemic attack or minor stroke. These previous studies were successful in demonstrating the usefulness of ATT-ASL in visualizing the altered hemo-dynamic status by ICA occlusion. The present study suggests that prolonged ATT is related to hemodynamic impairment by showing that it is correlated with rMTT-PET, an index of perfusion pressure.
In CT- and MRI-based perfusion imaging, a few timing parameters have been widely used as simple and convenient indices of hemodynamic status. MR timing parameters such as the arrival time and the time-to-peak (TTP) have previously been correlated with hemodynamic parameters measured by other imaging modalities. Kajimoto et al. (10) compared MR perfusion imaging and PET in patients with chronic unilateral carotid occlusive disease, and reported a significant correlation between MR TTP delay (delay in TTP in the affected hemisphere compared to the unaffected) and CBF/CBV by PET. Moreover, van Osch et al. (23) reported that the time of appearance (TA) derived from MR perfusion imaging was significantly correlated with the CO2 cerebrovascular reactivity measured by transcranial Doppler ultrasonography. The TA denotes the timing of appearance of contrast agent in the imaging voxel, and is thus considered to be closely related to ATT measured by ASL.
Despite a significant correlation between the rATT-ASL and rMTT-PET, variation in their relationship was substantial (Fig. 4). This variation can arise from various origins. First, physiological variations in rATT might have affected the results. As stated earlier, rATT in border zones are physiologically longer than those in regions within the vascular territories (15). Our ROIs were placed according to the previously established map, and only ROIs in the vascular territories were included in the analysis, while those in the border zones and WM were discarded. Nevertheless, inter-individual variations in the extent of border zones might have resulted in contamination of voxels that belonged to the border zone. Second, contaminated large vessels with shorter rATT might have been another source of variations. Finally, inaccurate rATT measurement due to limited SNR might have distorted the results. Modifications in sampling and/or interpretation may enhance the value of rATT as a hemodynamic marker.
This study has several limitations. First, the number of subjects was limited. In addition, our study population was clinically inhomogeneous. In particular, two patients had Moyamoya disease while the other patients had presumed atheromatous disease. Moreover, three patients had received STA-MCA bypass surgery. This might have increased variation in our results. Future studies on more homogeneous patient population could better demonstrate the value of ASL measurement of rCBF and rATT. Interval between the ASL and PET examinations varied from case to case. Finally, images of digital subtraction angiography (DSA) were not available, and thus details about collateral vessels were not provided. Moreover, MRA assessment of the arterial stenosis severity is limited in accuracy compared to DSA, and differentiation between severe stenosis and occlusion is sometimes difficult. This limitation hampered accurate characterization of our patients. Nevertheless, it should not have distorted the results of our correlation analyses between ASL and PET.
In conclusion, our results confirmed that quantitative rCBF measurement by ASL with multiple-delay time sampling is feasible in patients with steno-occlusive cerebro-vascular diseases. ASL is more reliable when evaluating relative rCBF. rATT measured by ASL was significantly correlated with rMTT measured by PET, suggesting that ATT has the potential to detect hemody-namic impairment.
Footnotes
Acknowledgements
This study was supported in part by a Grant-in-aid from Japan Society for the Promotion of Science (No. 22591340).