
Abstract
Background
Diffusion-weighted imaging (DWI) magnetic resonance imaging (MRI) is most commonly performed utilizing a single-shot echo-planar imaging technique (ss-EPI). Susceptibility artifact and image blur are severe when this sequence is utilized at 3 T.
Purpose
To evaluate a readout-segmented approach to DWI MR in comparison with single-shot echo planar imaging for brain MRI.
Material and Methods
Eleven healthy volunteers and 14 patients with acute and early subacute infarctions underwent DWI MR examinations at 1.5 and 3T with ss-EPI and readout-segmented echo-planar (rs-EPI) DWI at equal nominal spatial resolutions. Signal-to-noise ratio (SNR) and contrast-to-noise ratio (CNR) calculations were made, and two blinded readers ranked the scans in terms of high signal intensity bulk susceptibility artifact, spatial distortions, image blur, overall preference, and motion artifact.
Results
SNR and CNR were greatest with rs-EPI (8.1±0.2 SNR vs. 6.0±0.2; P <10-4 at 3T).Spatial distortions were greater with single-shot (0.23±0.03 at 3T; P <0.001) than with rs-EPI (0.12±0.02 at 3T).Combined with blur and artifact reduction, this resulted in a qualitative preference for the readout-segmented scans overall.
Conclusion
Substantial image quality improvements are possible with readout-segmented vs. single-shot EPI - the current clinical standard for DWI - regardless of field strength (1.5 or 3 T). This results in improved image quality secondary to greater real spatial resolution and reduced artifacts from susceptibility in MR imaging of the brain.
Diffusion-weighted imaging (DWI) provides high sensitivity and specificity in the diagnosis of brain ischemia (1). The utility of DWI in magnetic resonance imaging (MRI) in other applications, in particular for the detection and assessment of malignant neoplasia continues to increase (2, 3). Single-shot echo planar imaging (ss-EPI) DWI is the current clinical standard due to its resistance to phase errors resulting from patient motion. However, susceptibility artifacts and image blur can be severe, particularly at 3 T, due to the long EPI readout and corresponding low bandwidth per pixel in the phase-encoding direction.
Multishot or readout-segmented EPI (rs-EPI) presents advantages relative to ss-EPI. In ss-EPI k-space is sampled line by line from signal generated from a single 90 degree radiofrequency excitation pulse. The less extensive coverage of the frequency encoding dimension per shot in rs-EPI reduces the echo spacing and thus susceptibility artifacts and image blur. However, multishot approaches are often hindered by shot-to-shot phase variations due to patient motion during diffusion encoding. The approach to rs-EPI herein was originally introduced by Porter et al. (4, 5) and relies on a navigator-based correction and reacquisition.
To achieve this, a variable prephasing readout gradient pulse is applied before the EPI echo train, defining a different position of the acquired readout segment along the frequency encoding axis at each shot. In addition, a 2D navigator readout segment is acquired at the center of k-space during the second echo for each shot. There is a small overlap between these readout segments in the frequency encoding direction to ensure no mismatches at these junctions and to facilitate the 2D navigator-based correction. A 2D navigator echo, repeatedly acquired at the center of k-space, accounts for shot-to-shot linear and non-linear phase errors arising from rigid and non-rigid body motion of the brain (6). Like all navigator-based corrections, this approach fails when data corruption is severe (i.e. signal voids appear in navigator images). In prior experience (6), linear phase errors can be adequately corrected without having to reacquire data as most data are not shifted beyond the k-space acquisition window. However, pulsatile events lead to non-rigid body motion and associated nonlinear phase errors which result in phase maps with regions of localized phase error with high spatial frequencies, corresponding to much larger k-space shifts and an unrecoverable loss of data. These very corrupt scans cannot be corrected adequately by the 2D navigator and thus must be reacquired.
The aim of the present study is to clinically evaluate a diffusion-weighted, multi-shot, readout-segmented EPI (rs-EPI) sequence that employs a two-dimensional navigator-based phase correction and reacquisition strategy to account for phase errors. The approach is compared to conventional single-shot EPI (ss-EPI) at 1.5 and 3 T in volunteers and in patients with acute and subacute brain infarctions.
Materials and Methods
Study population
Eleven healthy volunteers and 14 consecutive patients with focal diffusion restrictions consistent with acute or subacute infarctions were enrolled after informed consent in this Institutional Review Board (IRB) approved study. Imaging of the volunteers occurred at Scott and White Memorial Hospital and Clinic and patient scans were performed both there and at Methodist Hospital. This study was performed in accordance with the Declaration of Helsinki. Patients were included based on the presence of an intracranial focus of acute or subacute parenchymal brain ischemia as evidenced by restricted diffusion detected on a standard ss-EPI DWI examination performed during the patient's routine brain MR.
Data acquisition
Readout-segmented EPI (rs-EPI) and ss-EPI scans were first performed on a 1.5 T MR system (MAGNETOM Avanto, Siemens AG, Healthcare Sector, Erlangen, Germany) in 11 volunteers utilizing a 12-channel head coil (Siemens AG, Healthcare Sector, Erlangen, Germany). A fast-spin echo Propeller DWI sequence (trade name Blade) was also performed to serve as a reference scan without significant susceptibility-related spatial distortions (7).
The following parameters were held constant for all sequences and at both field strengths: field of view (FOV), 220 × 220 mm2; matrix size, 192 × 192; TR, 4200 ms; voxel size, 1.1 × 1.1 × 4.0 mm3 (readout × phase-encoding × slice thickness). Fourteen axial slices were acquired in all instances. Bandwidth per pixel in the phase-encoding direction was 16.0 Hz for the rs-EPI sequence (echo train length of 61.4 ms) and 10.7 Hz for the ss-EPI sequence (echo train length 93.1 ms). Imaging parameters are further detailed in Table1. The stated image acquisition time for the rs-EPI sequence includes the time for reacquisition of severely corrupted data determined by the navigator-based approach, which was limited to 20% of total scan time for the sequence. Minimal echo times available were chosen for the given parameters to maximize signal-to-noise (SNR). Full Fourier sampling was utilized with both ss-EPI and rs-EPIs to minimize image blur which is seen with the zero-filling approach to image reconstruction utilized in the manufacturer's partial Fourier algorithm (8). A preliminary study was performed in which levels of susceptibility artifact were determined to be prohibitively high in the ss-EPI without parallel imaging, and as such a parallel imaging acceleration factor of 2 was utilized implementing the GRAPPA technique (9). No parallel imaging was utilized with the rs-EPI, and a factor of 2 was used for the BLADE to reduce acquisition time to more reasonable levels. For both the rs-EPI and ss-EPI, a modified Stejskal-Tanner pulsing scheme was employed which allows reductions in echo time for a given b-value over conventional bipolar diffusion gradients (10). Each scan, consisting of an acquisition with b = 0 s/mm2 and three diffusion-weighted acquisitions with b = 1000 s/mm2 along mutually orthogonal directions was acquired twice to allow calculation of SNR using the subtraction method with the b = 1000 s/mm2 images. A trace-weighted image was generated by determining the geometric mean of the three images. Quantitative and qualitative analysis was then performed using the trace-weighted images.
Summary of sequence parameters
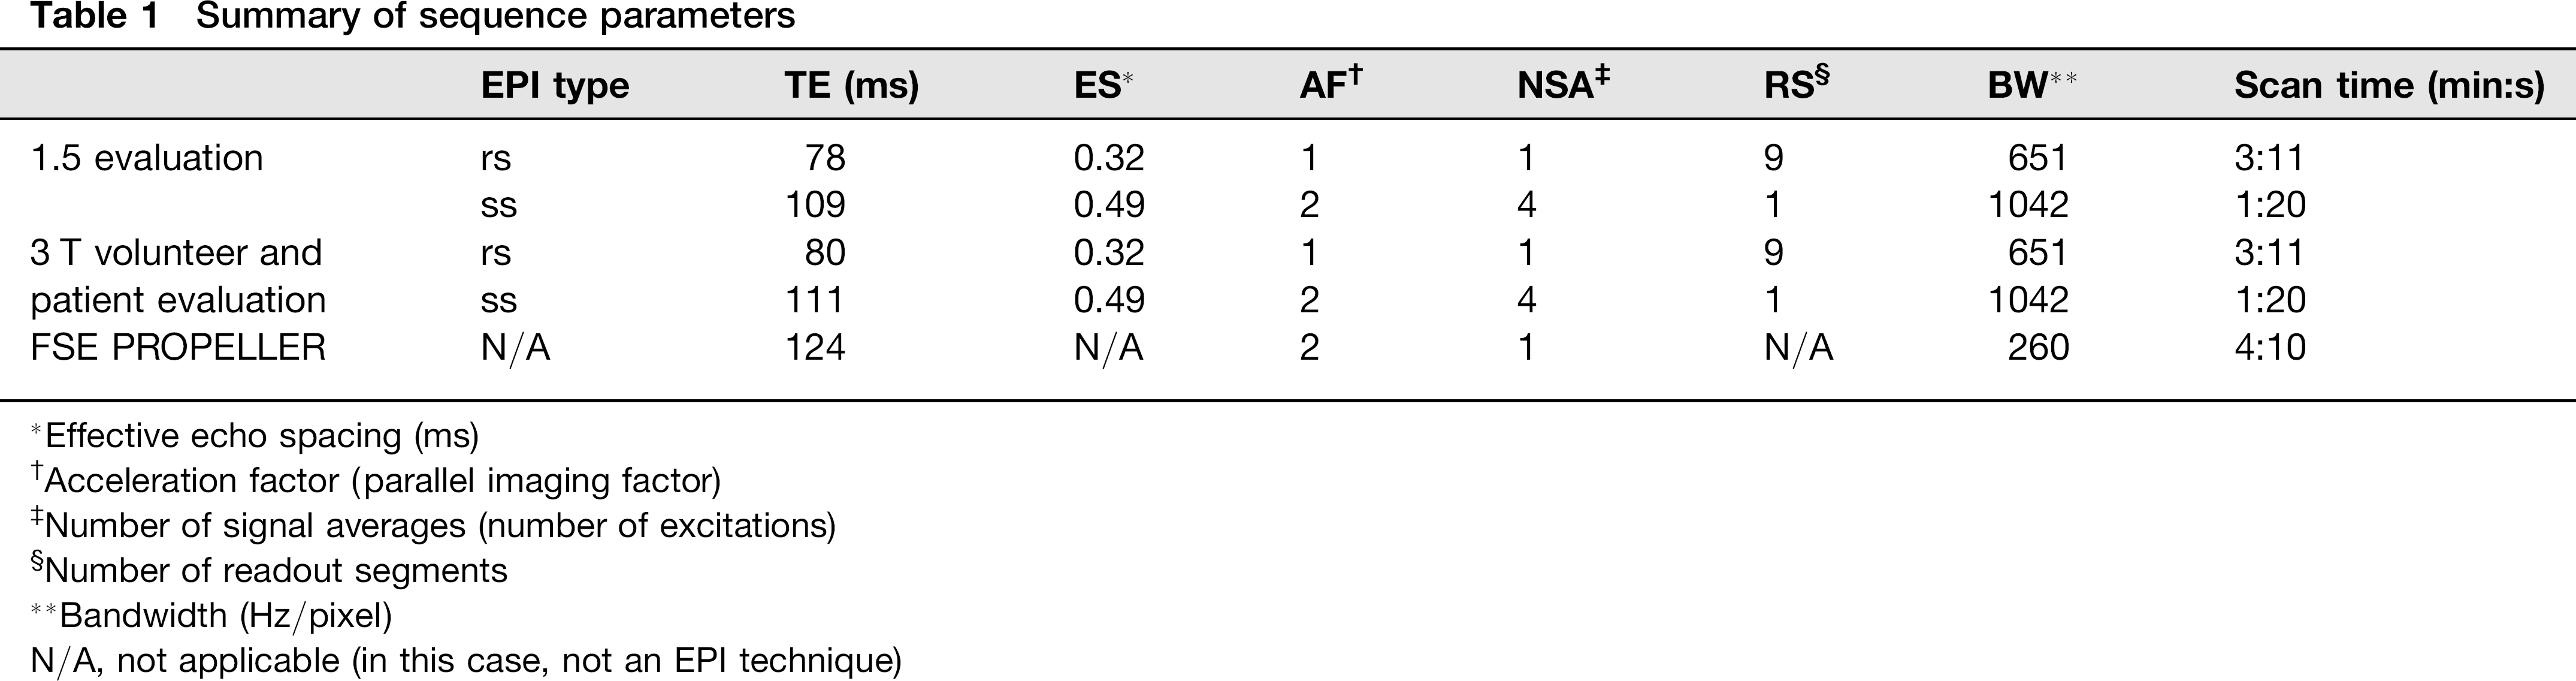
Effective echo spacing (ms)
Acceleration factor (parallel imaging factor)
Number of signal averages (number of excitations)
Number of readout segments
Bandwidth (Hz/pixel)
N/A, not applicable (in this case, not an EPI technique)
In the same 11 volunteers, the rs-EPI, ss-EPI, and BLADE sequences were acquired on a 3 T MR system (MAGNETOM Trio, Siemens AG, Healthcare Sector, Erlangen, Germany) utilizing a 12-channel head coil at one of the two hospitals noted above. Scan parameters were similar to those utilized for the 1.5 T measurements, detailed in Table1.
Fourteen consecutive patients were also scanned utilizing the same parameters as in the 3 T volunteer study for the rs-EPI and ss-EPI sequences (Table1). To reduce total scan time in this critically-ill patient group while preserving the study aims, rather than repeating b = 0 s/mm2 and b = 1000 s/mm2 scans, only the former were repeated, and the SNR estimated using the noise measurement from the b = 0 s/mm2 images only. Reacquisition of the b = 0 s/mm2 scan required much less time than repetition of both b = 0 s/mm2 and 1000 s/mm2 scans for both sequences. As time constraints were less pertinent in volunteers, it was possible to repeat the full acquisition. The noise term in the calculated contrast-to-noise ratio (CNR) was likewise estimated from the b = 0 s/mm2 scans.
Qualitative data evaluation
Data-sets for all studies were evaluated by a fellowship-trained neuroradiologist – a member of the American Society of Neuroradiology – with 6 years of experience in the field (reader 1, RR), in addition to a radiologist fellowship trained in MRI with 7 years of experience (reader 2, CG). The readers were blinded to all subject data, acquisition parameters, study rationale, and the specific types of pulse sequences being compared. All acquired slices were provided. A PACS workstation was used to view all images, the data-sets being displayed in randomized order on two four-quadrant display monitors. In the studies described above, the readers ranked ss and rs-EPI sequences in terms of bulk susceptibility artifact – manifest both as artifactual pontine stretching and high signal intensity artifact at sinus-parenchymal interfaces, image blur, and overall scan preference. The readers were specifically asked to assess image blur with respect to sharpness of anatomical boundaries, gray-white differentiation, and of the sulci. For the patient scans with diffusion abnormalities, the readers were also asked if there was a difference in visualization of the diffusion abnormality, and if so on which scan the abnormality was best visualized. The readers were also asked in the patient group whether artifacts from motion significantly affected scan quality. Interobserver agreement between the readers for each assessed qualitative parameter was evaluated via an unweighted Kappa test (MedCalc version 11.5, 2011).
Quantitative data evaluation
Quantitative data analysis was performed offline on a dedicated workstation (Leonardo, Siemens Medical Solutions USA). In the healthy volunteer and patient groups, signal intensity measurements were performed in well-defined supra- and infratentorial areas in the white matter of the right anterior forceps and the mid-pons. All regions of interest (ROIs) were drawn by the same author, blinded to image type. SNR was calculated using the subtraction method to account for the fact that the standard deviation of background noise may not represent the actual image noise when parallel imaging and multichannel coils are used (11, 12). For the volunteers, an image difference from each of the two complementary acquired b = 1000 s/mm2 scans was calculated. The noise level was determined as the standard deviation in a foreground region chosen at the location of the signal intensity measurement. In the patient group, the b = 0 s/mm2 images were analyzed in a similar manner. SNR was then determined using the following equation:
A CNR index was also calculated for each patient scan. Using the b = 1000 s/mm2 scans, a region of interest was drawn in the single dominant area of diffusion restriction and in a relatively homogeneous area of contralateral brain parenchyma. Image noise was calculated from subtraction images of the b = 0 s/mm2 scans at the location contralateral to the lesion described above. The index was then calculated as follows:
The values obtained initially for SNR and CNR utilizing the above formulae demonstrated signal levels not substantially greater than noise. In such situations, the distribution of noise becomes Rician rather than Gaussian (13). A correction factor was applied to account for the Rician noise distribution (13). SNR and the CNR indices were evaluated using multiple dependent Student t-tests with a Bonferroni correction factor. A scan was considered significantly different from the others when a P value, once corrected for the number of performed comparisons, was found to be P < 0.05 for a comparison involving the given scan.
Spatial distortion was quantified in volunteers by measuring the anterior-posterior length of the pons along the midline at the level of the olivary nucleus for all compared sequences. For a given subject, the measurements for the ss-EPI and readout-segmented scans were subtracted by the pontine length measurement of the BLADE scan, the latter measurement being reflective of true pontine length given the lack of spatial distortions from tissue susceptibility differences with this technique. The absolute value of each difference was divided by the pontine length measured on the BLADE scan to yield a percentage of absolute difference from the BLADE with each sequence. These percentages were compared utilizing a dependent Student t-test.
Results
Subject profile and lesion distribution
In evaluation of the volunteers (four women and seven men; mean age, 24.7±2.9 years) no acute intracranial pathology was identified. In the 14 patients imaged (five men, nine women; mean age, 57.9±20.4 years), only one infarction demonstrated an infratentorial component, and the rest were supratentorial. Three infarctions involved more than one arterial distribution.
Evaluation of readout-segmented EPI in volunteers
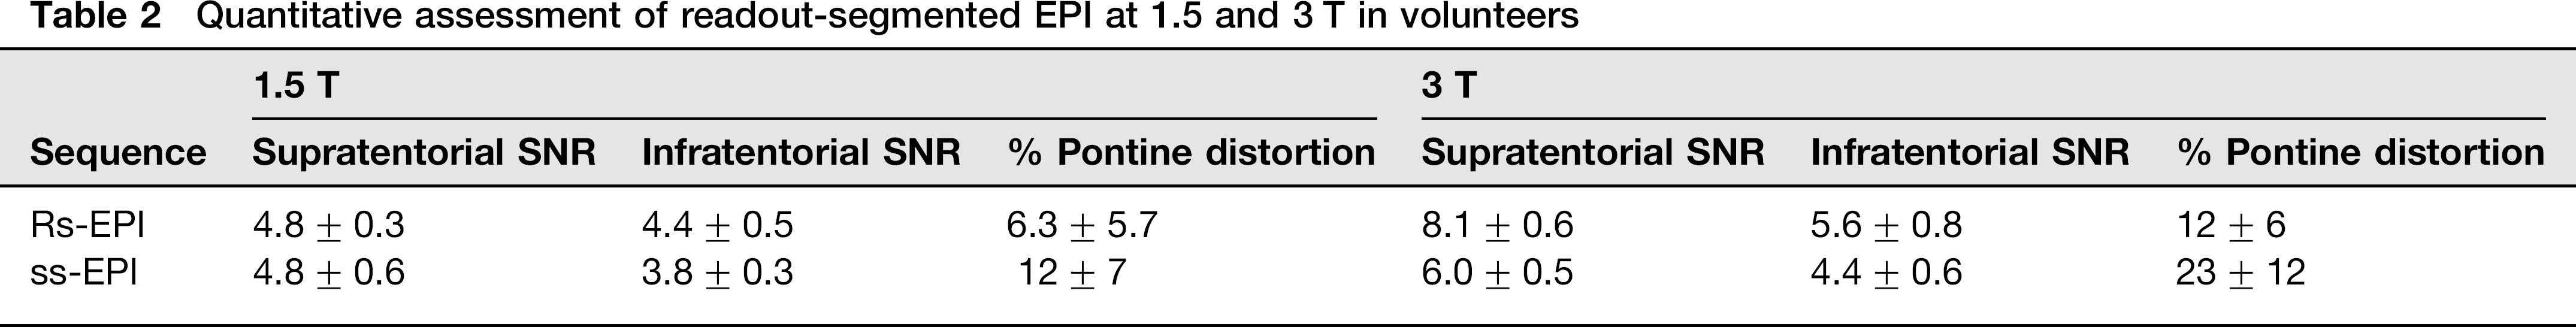
Quantitative results at 1.5 T are provided in Table2. Supratentorial SNR was not statistically significantly different between rs and ss-EPI (P = 0.97). Infratentorially, the rs-EPI SNR was statistically significantly greater than ss-EPI SNR (P <0.001). The rs-EPI also exhibited statistically significant less artifactual pontine distortion than did the ss-EPI sequence (P <0.03). Representative images are provided in Figs. 1 and 2.
Quantitative assessment of readout-segmented EPI at 1.5 and 3 T in volunteers
Representative images from volunteer studies at 1.5 T (top row) demonstrate increased prominence of high signal intensity artifact at the interface of the temporal lobe and mastoid air cells with (a) ss-EPI vs. (b) the rs-EPI and (c) BLADE sequence, the latter provided to illustrate images without such artifacts. Similar findings are present at 3 T (bottom row) with the (d) ss-EPI, (e) rs-EPI, and (f) BLADE sequences. Compared to 1.5 T, SNR is overall improved and bulk susceptibility artifacts overall worsened at 3 T Representative images at the mid-pons from volunteer studies at 1.5 T (top row) demonstrate increased artifactual pontine stretching at its interface with the sphenoid air cells with (a) ss-EPI vs. (b) the rs-EPI. (c) The BLADE sequence is provided to illustrate images without such artifact. Similar findings are present at 3 T (bottom row) with the (d) ss-EPI, (e) rs-EPI, and (f) BLADE sequences. SNR is overall improved and bulk artifactual pontine distortion overall worsened at 3 T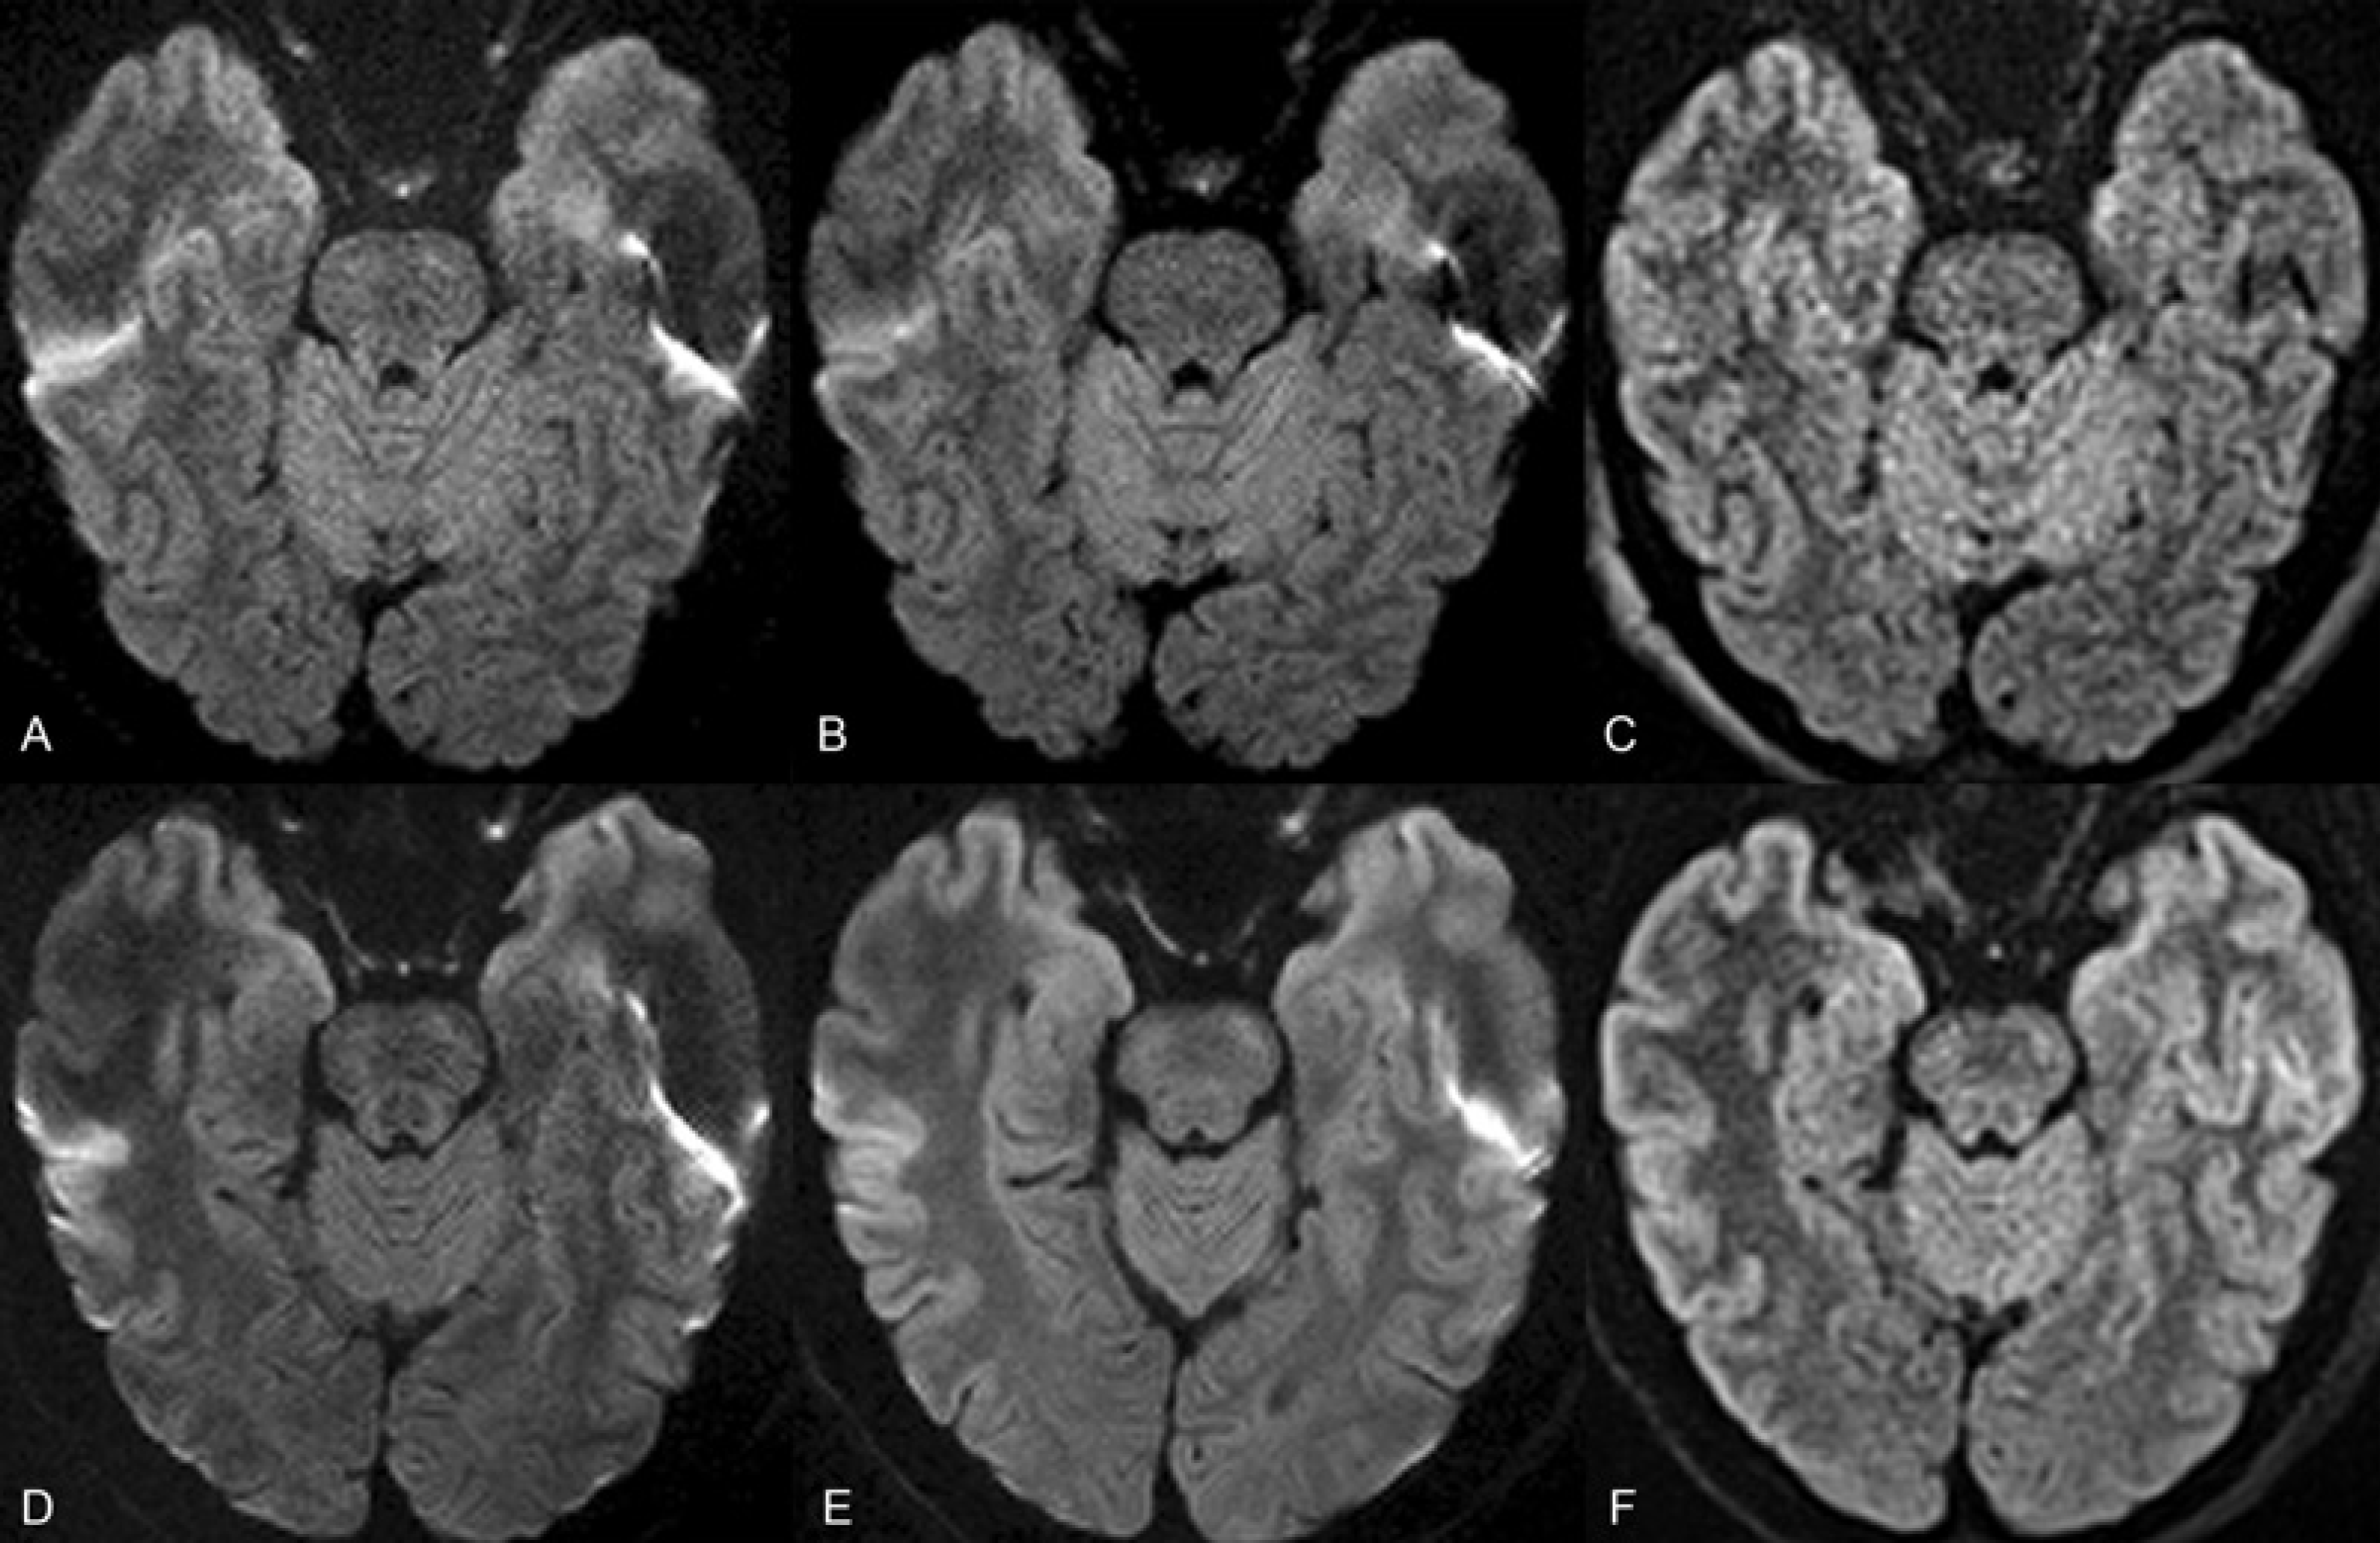

At 1.5 T reader 1 found less blur, pontine distortion, and high signal intensity susceptibility artifact in every case (11/11) with rs-EPI vs. ss-EPI. For each volunteer scan (11/11), reader 1 preferred rs-EPI overall to ss-EPI. Reader 2 found less blur and pontine distortion with rs-EPI in 91% of cases (10/11). With rs-EPI, reader 2 found less high signal artifact in 82% of cases (9/11). In 91% of cases (10/11), reader 2 preferred the rs-EPI overall to ss-EPI. Inter-observer agreement was excellent for both blur and pontine distortion (kappa = 0.82), good for high signal artifact (kappa = 0.64), and excellent for overall scan preference (kappa = 0.82).
Quantitative results at 3 T are provided in 2. Supratentorial and infratentorial SNR were statistically greater with rs-EPI than with ss-EPI (P <10–6, P <0.02). As at 1.5 T, rs-EPI exhibited statistically significantly less artifactual pontine distortion than did the single-shot sequence (P <0.001). Figs. 1 and 2 present representative images from these scans.
The rankings of reader 1 at 3 T were identical to those obtained at 1.5 T. Reader 2 found less blur and high signal intensity artifact with rs-EPI in 91% of cases (10/11) and less pontine distortion in all cases (11/11). Reader 2 preferred rs-EPI overall in 91% (10/11) cases. Inter-observer agreement was excellent for blur, high signal intensity artifact, and overall image quality (kappa = 0.82) and perfect for pontine distortion (kappa = 1.0).
Evaluation of readout-segmented EPI in patients at 3 T
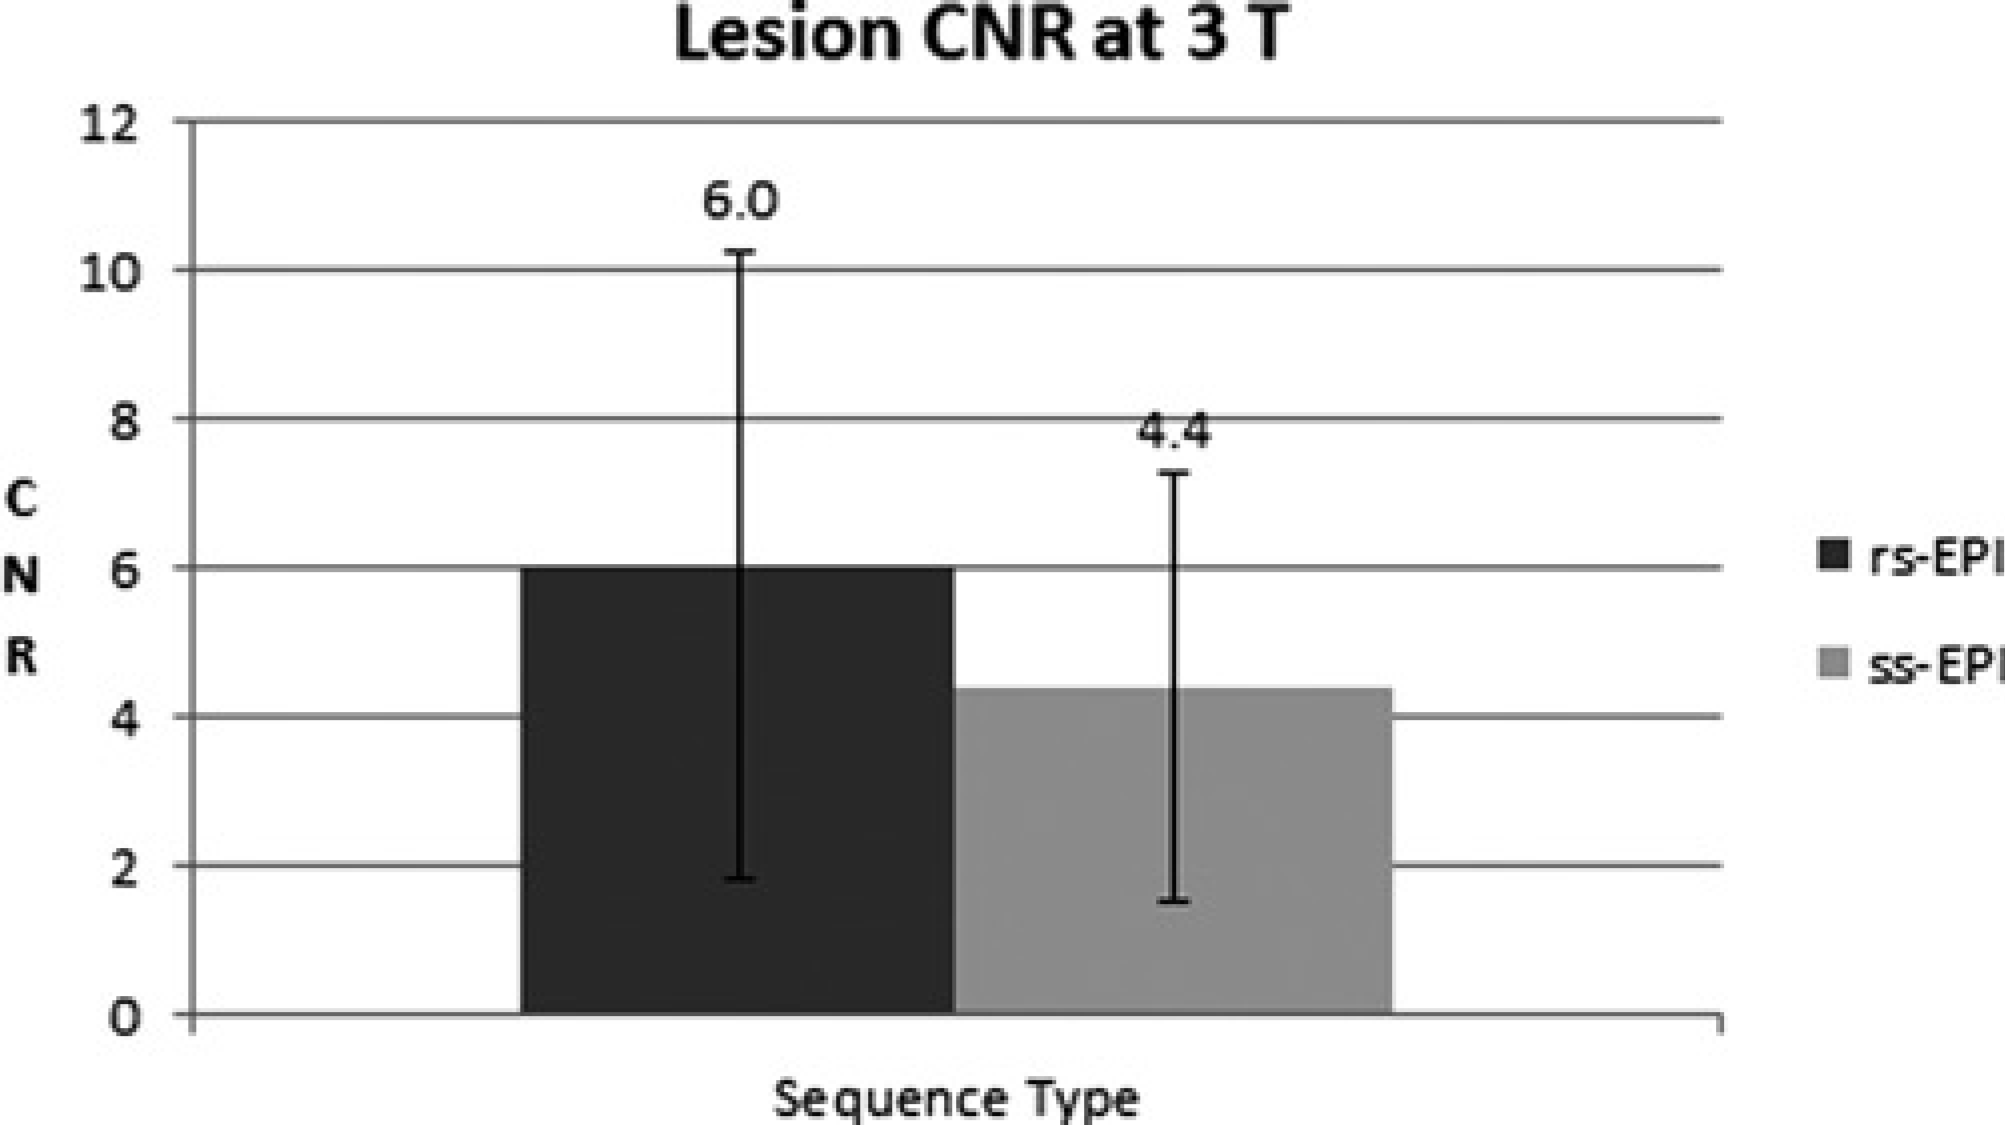
For the examinations performed in patients, SNR was found to be statistically greater with the rs-EPI in both the anterior forceps (7.0±2.1 vs. 5.6±1.3, P <0.01) and pons (4.6±1.5 vs. 3.8±0.8, P <0.05) as shown in Figure 3. CNR was likewise found to be greater with the rs-EPI (6.0±4.2 vs. 4.4±2.8, P <0.03) than with the ss-EPI as illustrated in Fig. 4.
Differences in SNR measured at the anterior forceps in the 3 T experiment in patients. The rs-EPI demonstrated a significantly significant increase in SNR vs. the ss-EPI sequence (P <0.01). Differences in SNR measured at the mid pons in the 3 T experiment in patients. The rs-EPI demonstrated a significantly significant increase in SNR vs. the ss-EPI sequence (P <0.05) Differences in lesion CNR index in the 3 T patient experiment. The rs-EPI sequence demonstrated a significantly significant increase in CNR vs. the ss-EPI sequence (P <0.03)
In the patient exams, reader 1 and 2 both ranked the rs-EPI scans as being preferred overall, having less high signal intensity susceptibility artifact, and having less pontine distortion than the ss-EPI sequences in all but one individual case (93%; 13/14). This was likewise the only case in which patient motion was felt to degrade scan quality with either sequence, in particular the rs-EPI scan. Agreement was perfect (kappa = 1.0) in these assessments. In 93% of cases (13/14), apparent spatial resolution was found by both readers to be greater with rs-EPI than with ss-EPI. Inter-observer agreement was high (kappa = 0.86). Reader 1 found an improvement in lesion visualization with the rs-EPI sequence in 2/14 cases and reader 2 in 1/14 cases. A representative patient image is provided in Fig. 5.
Representative images demonstrate an acute right posterior cerebral artery territory infarction as visualized on (a) ss-EPI and (b) rs-EPI DWI images at 3 T. Improved visualization is present in the latter, owing to the decreased prominence of high signal intensity susceptibility artifacts overlying the pons and right temporal lobe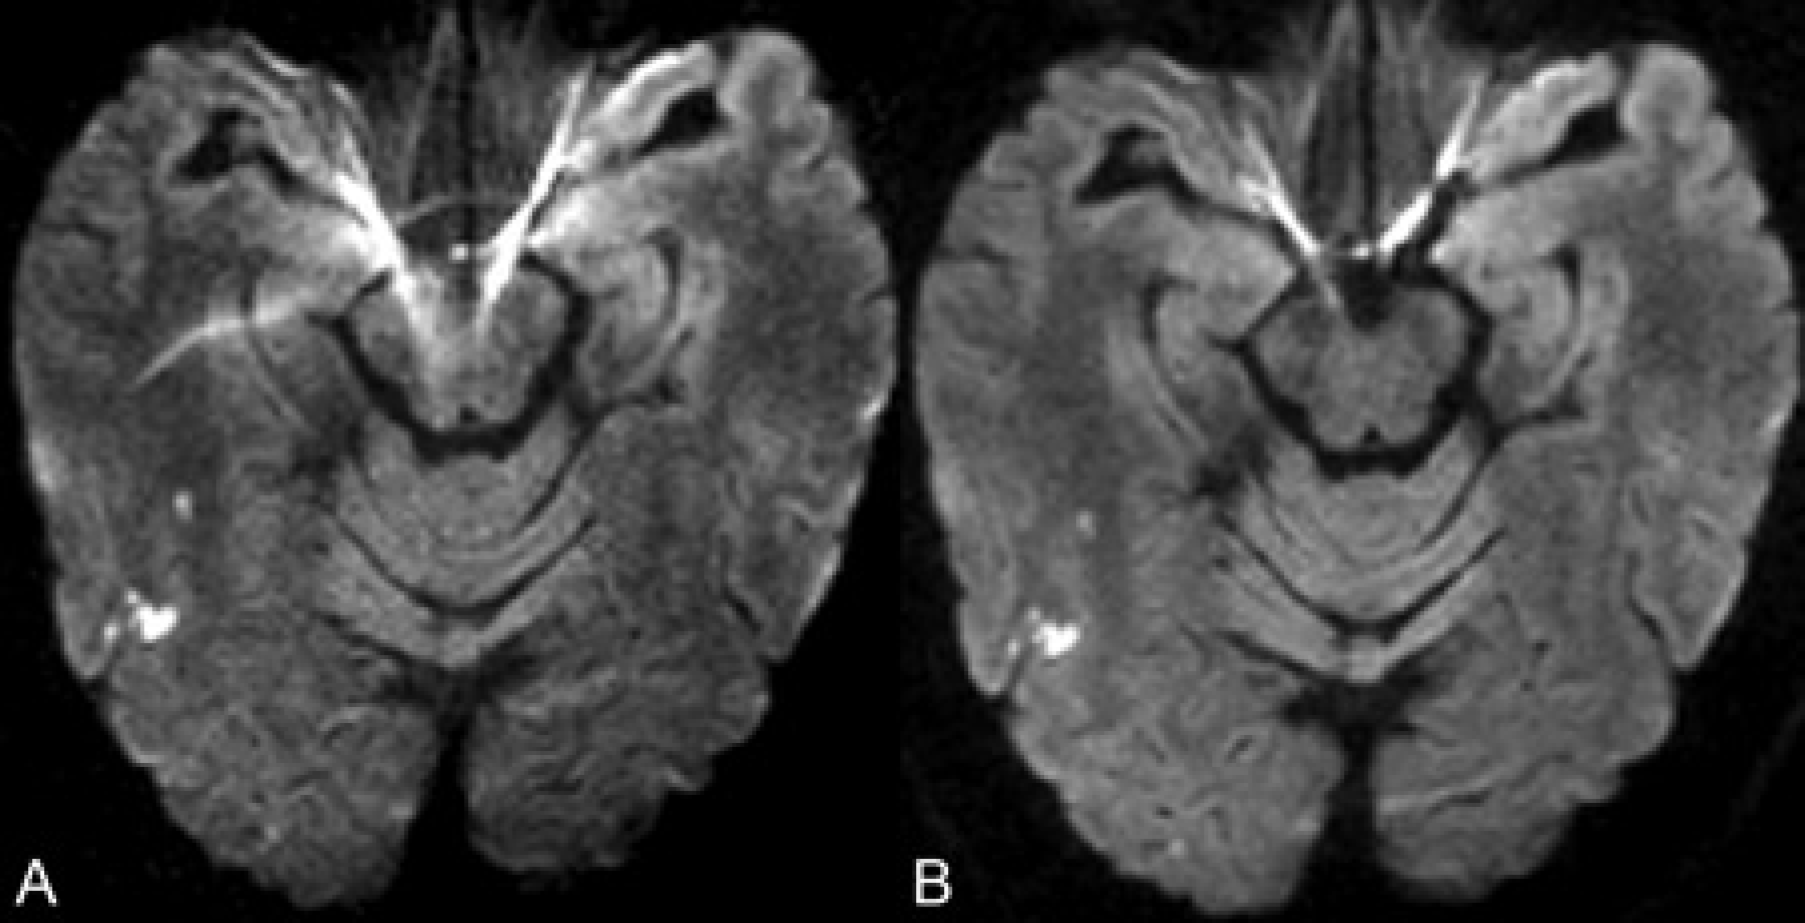
Discussion
The present study demonstrates at both 1.5 and 3 T the improvement in overall scan quality with a readout-segmented approach to DWI as opposed to ss-EPI. The rs-EPI exhibited increased SNR in volunteers and patients at 3 T vs. the single-shot EPI and an improvement in the lesion CNR index in patients. This study represents the largest clinical work to date utilizing the rs-EPI sequence described and is also the only multicenter trial to date; although a prior work examined the sequence in a much smaller number of patients, focusing on head-coil selection (14). Qualitative and quantitative measures of susceptibility artifacts and distortions were less with the rs-EPI sequence as compared to single-shot EPI, whereas observed spatial resolution was also improved with the former. The rs-EPI sequence does increase acquisition time (by ∼2 min) vs. the ss-EPI, a factor of particular concern in stroke patients. Previous clinical studies of DWI in this setting utilized scan acquisition times between ∼1 and 2.5 min (10, 15), the former being the acquisition time utilized clinically at the above-noted institutions. Implementation of the rs-EPI sequence in combination with parallel imaging should aid in reducing the requisite scan time. Additionally with further improvements in rs-EPI image quality, it may be possible to substitute the b = 0 s/mm2 images, which possess T2 but not diffusion weighting, in place of routinely acquired T2-weighted images. As expected, although not directly compared as it was not the focus of the study, SNR on a sequence-matched basis was greater at 3 T vs. 1.5 T, as were quantitative measures of spatial distortion.
By dividing the readout into smaller segments with limited coverage of the frequency encoding axis, the readout-segmented EPI technique decreases echo spacing and thus the above noted artifacts. In the protocol utilized in this study, effective echo spacing (accounting for the parallel imaging factor of 2) with the single-shot EPI sequence is 0.49 msec vs. 0.32 msec with the readout-segmented EPI. Motion-induced phase error is a major challenge in multi-shot diffusion-weighted imaging; this is dealt with in the present approach by correcting linear and non-linear phase errors through use of a 2D navigator echo. Data with a high level of motion-induced phase error are preferentially reacquired. No artifacts stemming from a failure of the rs-EPI to sufficiently account for corrupted data were detected by either reader. These findings are consistent with prior experience suggesting that the incidence of failing to detect and correct such highly corrupted data sets is fairly low (4).
A readout-segmented approach to DWI has been evaluated in a smaller clinical series; although phase errors in that study were compensated by utilizing wider readout segments with significant overlap, up to 50% (16). This approach limits the reduction in echo spacing otherwise obtainable, limiting the benefit of the readout-segmented approach. For both rs-EPI and ss-EPI sequences, the present study also used a diffusion preparation with a single RF refocusing pulse, based on the original Stejskal-Tanner scheme (10), rather than the dual-bipolar approach with two RF refocusing pulses that was utilized in the aforementioned study to reduce image distortion due to eddy currents (17). This modified Stejskal-Tanner approach has previously been shown to be beneficial in ss-EPI DWI (10).
While susceptibility artifacts and spatial resolution were improved with the readout-segmented EPI sequence, the appearance of such artifacts could be further reduced via application of parallel imaging or partial Fourier methods. Implementation of the former has been shown to be feasible in initial volunteer studies (4), but was not available clinically at the time of the present study. In distinction to the rs-EPI scans, parallel imaging was utilized for the single-shot EPI exams as a preliminary study showed that acquisition of such sequences without parallel imaging lead to an unacceptable level of susceptibility artifact and image blur, especially at 3 T. Partial Fourier imaging was not utilized in either the single-shot EPI or the readout-segmented EPI due to potential detrimental effects from image blur (8) which we attempted to minimize in this study to facilitate comparison of the two techniques. This may have disproportionately adversely affected the SNR in ss-EPI as decreases in echo time with such methods are likely to be more significant in that sequence relative to the rs-EPI, given the already relatively shorter echo train of rs-EPI. The reference BLADE scans in this study could also be utilized for clinical imaging, and have been examined previously to this end showing insensitivity to motion and little susceptibility artifact. However, the previous experience of our group with this application has shown the technique to be somewhat limited by poor SNR and lengthy acquisition times (7, 18); although other authors have implemented a similar PROPELLER sequence with relatively short (∼ 2 min) acquisition times (15). PROPELLER techniques have been shown useful in DWI applications which would otherwise be limited by susceptibility artifact, such as in the detection of recurrent cholesteatomas (19).
The quantification of susceptibility distortion is an additional potential limitation to the present study. Although possibly more accurate methods for such quantification have been suggested (10), the chosen, more intuitive approach was utilized to minimize scan time. For similar reasons, in patients, calculation of the SNR and CNR used the noise term from b = 0 s/mm2 images due to the fact that reacquisition of such images required considerably less time than would have a full repetition of the scan. In the volunteer studies, where there were fewer time constraints, it was possible to repeat the full scan, so that the SNR of the DWI images could be estimated directly without using the b = 0 s/mm2 scan to provide a noise reference. Despite this difference, the obtained values for SNR with the ss- and rs-EPI sequences, as would be expected, were similar between the volunteer and patient studies. The noise term of the CNR index was also derived from the b = 0 s/mm2 images in the patient studies, providing a relative assessment of CNR between the evaluated sequences. Overall, low SNR levels obtained regardless of sequence utilized, which resulted in a correction factor being applied to account for the Rician distribution of noise in such conditions (13). Of course, the relative SNR values between the sequences were the interest of this work rather than calculations of absolute SNR obtainable. The low absolute SNR values here are on the order of magnitude of those obtained in other studies in which the subtraction method was utilized with DWI for such calculations (7, 10, 18). The image subtraction technique may artifactual decrease SNR measurements if there is patient motion between repeated scans (10), and this may have reduced SNR estimates in the present study. Echo times were also not matched but rather, minimal times within the confines of the other given parameters were chosen so as to maximize SNR. As a result, the longer effective echo times utilized with the ss-EPI may result in greater T2 (as opposed to diffusion) weighting than with the rs-EPI sequence, a further potential advantage to the latter.
Further considerations of motion correction techniques are warranted with respect to rs-EPI. The 2D navigator correction and reacquisition used in this study addresses the problem of motion occurring during the diffusion preparation leading to phase inconsistency, but no correction was applied for possible motion between the acquisitions of readout segments. In the present study, artifacts from motion only affected scan quality with the rs-EPI scan in one case. Single-shot EPI can, of course, also be affected by blurring if there is motion between averages or between the acquisitions of the individual diffusion-weighted images that are used to calculate the trace-weighted image. A sequence's susceptibility to patient motion is a difficult variable to assess, and further clinical experience will dictate whether additional measures for motion correction with the rs-EPI are warranted. If loss of image detail due to data misregistration from motion between readout segment acquisition is found to be problematic, self-navigated motion correction techniques could be implemented, as have been done in the past for PROPELLER sequences (20).
In conclusion, despite these potential limitations, the readout-segmented approach to DWI described herein improved visualization of acute brain ischemia secondary to its reduced susceptibility artifacts and improvements in spatial resolution. Although further studies are needed, this may clinically result in improved diagnostic accuracy with the technique at 1.5 and especially 3 T.
Footnotes
Acknowledgements
The authors thank the staff and faculty in the Department of Radiology at Methodist Hospital in San Antonio.