




Abstract
Clinical governance refers to a system or a framework through which National Health Service (NHS) organizations are accountable for continuously improving the quality of their services and safeguarding high standards of care, by creating an environment in which clinical excellence will flourish. Various ‘dashboards’ or ‘score cards’ are currently being promoted with an intention of improving patient care and outcomes. It is believed that a closer observation of selected parameters, on a regular basis, may facilitate timely action, thereby avoiding adverse incidents. It is, therefore, hoped that such ‘dashboards’ or ‘score cards’ may also help clinicians, managers, trust boards, commissioners and patients to identify areas of good clinical practice and also to recognize areas that require improvement.
The Maternity Dashboard is a clinical performance and governance score card, which was initially designed to improve clinical outcomes and patient safety at a hospital in London. It has also been recommended by the Chief Medical Officer (CMO) of the UK to improve maternal and perinatal outcomes. The Royal College of Obstetricians and Gynaecologists (RCOG) subsequently published a ‘Good Practice Guideline’ on the Maternity Dashboard and it is currently being used by many maternity units in the UK to improve patient care and outcomes.
What is the Maternity Dashboard?
In essence, the Maternity Dashboard is a clinical performance and governance score card that enables monitoring of various parameters of clinical governance ‘on the ground’, at a regular (monthly) interval. This would help not only to identify and promote areas of good clinical practice in maternity care, but also detect and rectify areas that need further improvement or, rarely, to identify dangerous practice. An example of the Maternity Dashboard is given in Figure 1.

Maternity Dashboard 2007 (available in colour online)
What are the parameters that should be monitored on the Maternity Dashboard?
It is desirable to monitor certain ‘general’ parameters that would facilitate comparison of performance with other (similar) maternity units. This may include normal birth rate, Caesarean section rate and instrumental vaginal birth and induction of labour rates as well as the rate of massive obstetric haemorrhage. However, the vast majority of parameters that need to be monitored on the Maternity Dashboard should be determined locally, preferably by a multidisciplinary team (such as the obstetric risk management team). The parameters selected should reflect the local need with regard to areas of clinical care that require monitoring or improvement, based on clinical observation. For example, if there is an increase in emergency Caesarean sections or risk incidents (injury to babies or third-degree perineal tears), parameters such as ‘failed instrumental vaginal births’ need to be monitored. This may help identify a ‘training issue’ with regard to instrumental vaginal births that could be easily rectified by conducting ‘one-to-one’ hands-on training. Similarly, if there is an increase in negative patient feedback pertaining to a specific clinical area of the maternity service, patient ‘complaints and compliments’ pertaining to that area could be monitored.
In our experience, the Maternity Dashboard has been a useful tool that has helped us monitor certain ‘mandatory requirements’ in maternity services. These include: midwives:births ratio; weekly resident obstetric consultant presence in labour wards; percentage of staff who have undergone mandatory training in skills and drills based on Trust's own training needs analysis; and percentage of women who are booked before 12 weeks and 6 days of gestation. Monitoring such ‘mandatory requirements’ would not only help inform the staff but also provide quality assurance to the Trust management as well as to the users and commissioners of maternity services.
The Maternity Dashboard is a tool that is designed to help continuously improve patient care and outcomes. Hence, it is desirable to monitor and analyse ‘patient complaints and compliments’ on a monthly basis. This may help identify specific issues that may contribute to poor patient satisfaction such as ‘attitude and behaviour’ of staff, organizational or ‘resource’ issues that may contribute to poor patient experiences (e.g. estates, staffing levels, availability of equipment) or existing systems and processes that may make it difficult for patients to access care with ease and convenience.
While there may be certain ‘permanent’ parameters on the Maternity Dashboard that may need to be constantly and continuously monitored, it is essential to ensure that the parameters monitored reflect the priorities and needs of the individual maternity unit. Therefore, once compliance with the ‘locally set’ standard has been achieved and monitored for some time, a parameter may be removed from the Maternity Dashboard and be monitored through the risk management process. If there is any deterioration of this parameter, it may be re-introduced into the Maternity Dashboard for further monitoring. Similarly, based on clinical observation, risk incidents, patient complaints or if the local multidisciplinary team feels that a specific area needs to be closely monitored, this ‘new’ parameter may be added on to the Maternity Dashboard. Hence, it is vital to use the Maternity Dashboard as a ‘dynamic’ clinical governance tool.
The individual parameters monitored on the Maternity Dashboard may be grouped under broad categories (e.g. ‘clinical activity’, ‘workforce’, ‘risk management’ and ‘responsive care’) for convenience.
Setting the ‘standards’ or ‘goals’ on the Maternity Dashboard
It is important to set a ‘standard’ or ‘goal’ for each parameter that is monitored on the Maternity Dashboard as it will help assess the quality of maternity care provided and to identify shortcomings, if any. National, RCOG evidence from published literature or the local guidelines may be used to set these standards. Modifications of National Standards may be needed in view of the local case-mix or population characteristics. For example, a tertiary institution that delivers care to a high-risk population or receives in utero transfers for complex maternal and fetal conditions may have higher operative delivery rates compared with a low-risk institution. These local issues should be taken into consideration when setting the standards, and when such deviations from National Standards are deemed necessary, it is good practice for a local multidisciplinary team (such as the risk management team) to be involved in setting the standard after critically analysing and discussing the local factors. Data from units with comparable case-mix may also be obtained to help set the standards.
Once the standards or goals are determined, individual maternity units should set upper and lower thresholds for each of the standards or goals to assess conformance to the set standards. A suggested approach is to use the ‘traffic light’ system with green (to indicate when the goals are met, i.e. within the lower threshold), amber (to indicate that the goals are not met. i.e. above the lower threshold, but still within the upper threshold) and red (when the upper threshold is breeched). Such a colour-coded system may help providers, commissioners and users of the maternity service to easily understand the overall care provided by the maternity unit and also to identify areas of care that require immediate attention to improve patient safety and quality of care.
Collection of data
The most crucial factor that determines the success of any clinical dashboard, including the Maternity Dashboard, is the availability and reliability of data. Information could be obtained from software systems (Euroking, Datix) and many maternity units do have a designated person in charge of data (e.g. IT midwife or a data analyst). It is vital to cross-check the data obtained from such systems for accuracy and relevance. For example, the number of elective Caesarean sections obtained from the electronic maternity system such as Euroking could be cross-checked with the book (or an electronic system) that is used to book elective Caesarean sections. Similarly, the number of patient complaints and compliments could be obtained from the Complaints Department or patient advisory and liaison service (PALS). For these reasons, a strong clinical leadership and ownership is essential to ensure that the data disseminated through the Maternity Dashboard are reliable, relevant and are of a very high quality. It is also useful to ‘explain’ the data, if necessary, on the comments section of the Maternity Dashboard to ensure clarity. We cross-checked the data obtained through our Maternity IT System by comparing them with the entry in our Theatre Book, our electronic system for booking elective Caesarean sections and induction of labour as well as by directly obtaining data from our Paediatric Physiotherapy Department.
What to do when a parameter scores ‘amber’ or ‘red’?
The main objective of the Maternity Dashboard is not only to focus on provision of good clinical care but also to identify areas where the maternity care provided falls short of ‘set standards’. The latter would necessitate a swift action to avoid adverse outcomes. If a parameter scores ‘amber’, it requires a closer scrutiny and necessary action to bring this parameter back to ‘green’.
A closer observation of the parameter to identify any trends in subsequent months may be all that is required. Frequent or repeated ‘ambers’ in any single parameter should necessitate a careful scrutiny. Failure to do so may result in ‘amber’ deteriorating to ‘red’ in subsequent months.
A parameter that scores ‘red’ requires urgent action as it has breached the upper limit of the locally set standard and, hence, may pose an impending threat to patient safety or adversely affect the quality of maternity care provided. Urgent action may involve conducting an audit to obtain more information and to formulate an action plan, staff training if clinical issues are identified or a review of current practice. Non-compliance with mandatory requirements would require urgent and ‘high-level’ action to ensure that the maternity service meets statutory requirements and National Safety Standards.
Three-year experience with the Maternity Dashboard at a tertiary teaching hospital, in London
The Maternity Dashboard was introduced at St George's Hospital, London, in January 2007, as a tool to monitor various aspects of clinical governance and to help continuously improve patient care and outcomes. Initially parameters were monitored under three broad headings: Activity; Workforce; and Clinical Indicators. Weekly resident consultant presence was monitored from June 2007 (Figure 1).
Usefulness of the Maternity Dashboard in improving patient care
Tool for dissemination of information
The Maternity Dashboard has been a useful tool to disseminate information about the overall performance of the maternity unit to all staff, management, commissioners and the users of the service. Every month, the Maternity Dashboard is sent electronically to the leads of clinical areas for dissemination to all staff, trust management including our chief executive, local primary care trust (PCT) commissioner as well as to our ‘user representative’. It is also widely discussed in our multidisciplinary obstetric risk management meeting, our obstetrics and gynaecology care group meeting, our ‘Maternity Task Force’(chaired by our chief executive or director of nursing) as well as at our Maternity Services Liaison Committee (MSLC) meeting. The monthly report is sent to members of the maternity team and to our senior management. An example is shown in Box 1.
An example of the Maternity Dashboard monthly report
Dear Colleagues,
Please find our Maternity Dashboard for July 2009 (attached)—I am very pleased to say that, as a Maternity Unit, we are doing very well in most areas.
We have continued to maintain and increase the number of deliveries in Carmen Suite (58) and also, the intrapartum transfer rate from Carmen Suite to Labour Ward (LW) has stabilized. We have been able to maintain and increase prospective LW consultant cover of (from 65 in June to 69 hours per week in July) without the help of post CCT trainees – thanks to the continued support of management. With the help of trainees, who have completed their CCT, we have been able to have 86 hours of ‘Post-CCT’ cover (CNST Requirement states post-CCT holder). Our Trust has kindly approved funding for the appointment of additional consultants and hopefully we could start moving towards achieving 98 hour resident LW consultant cover, as per our CNST/Safer Childbirth requirements. Our Caesarean section rate has shown a downward trend and is now ‘green’ – 22.6%. This was after 26.5% at the beginning of the year and it was due to instituting measures such as hands on ventouse training and daily review of maternity notes of emergency Caesarean sections as well as ensuring that our protocols for inductions are strictly adhered to. I wish to thank all my colleagues for their hard work and continued support in achieving this reduction. Our overall C-section rate for this year is 23.6% – we have one of the lowest C-section rates in London and in the South West Thames region. Our perceived increase in third-degree tear observed over the last few months is back to green again. We did an analysis last month, which showed that there is no association with operative vaginal delivery. Out of 16 third-degree tears (3.3% of deliveries) in July, 15 of them (93.7%) are Grade 3a tears (<50% of external sphincter involvement). Midwifery staffing levels, instrumental vaginal delivery and induction rates have scored amber. There is a recruitment process going on to improve our midwifery staffing level. Last week, our new Deputy Head of Midwifery assumed duties and it is likely that the numbers will gradually get better in future. Although we scored amber, analysis of induction of labour reveals that we have continued to maintain a very low induction rate for postdate induction (4.4%) and most inductions were performed for medical/obstetric indications. Failed instrumental deliveries – our ever-vigilant risk management team has identified an individual training issue and one-to-one hands-on training has been organized to assist with training needs. HIEs – we had two babies who were diagnosed to have HIE in July. One of them had evidence of chronic anaemia. I had a discussion with the neonatologists – the MRI scan has shown evidence of posterior cerebellar infarct, possibly secondary to chronic anaemia – hence, it is unlikely that it is an intrapartum hypoxia-related event. The second baby had normal APGAR score and normal cord blood gases at birth but had convulsions in the postnatal ward and was diagnosed to have hypoglycaemia. MRI has shown signs suggestive of possible hypoxic changes. We are continuing to experience capacity issues (increased booking/deliveries) over the last few months – after reviewing this with our Head of Midwifery, it appears that this increase that is being observed is mainly due to our ‘catch-up’ booking to meet the 12 weeks +6 days target. Hence, most likely, this will normalize after sometime and should not cause a significant increase in overall number of deliveries.
Tool for recognizing good clinical care
The Maternity Dashboard helped our team to recognize areas of good practice and optimum performance. These include our Caesarean section, instrumental vaginal delivery, induction of labour rates and hypoxic ischaemic encephalopathy (HIE) rates. We were also able to recognize that after effectively utilizing a dedicated ‘interventional radiology’ service for management of massive postpartum haemorrhage, our rate of postpartum hysterectomy returned to 0.
Tool for improving clinical care/practice
The Maternity Dashboard helped us to identify and scrutinize clinical areas that scored ‘amber’ or ‘red’. Two specific examples include increase in the incidences of third-degree perineal tears and shoulder dystocia, both of which scored ‘red’ in 2007. Analysis of third-degree perineal tears revealed that the majority of these were associated with instrumental vaginal births involving a single clinician. Measures were put in place to safeguard patient safety, while support and one-to-one training was offered to the clinician concerned. We also organized ‘hands-on’ one-to-one training to all obstetric trainees to improve their skills and techniques in conducting instrumental vaginal births. This parameter returned to green in subsequent months after this intervention (i.e. hands-on training). Analysis of shoulder dystocia revealed incorrect data entry as ‘difficulty in delivering the shoulders’ on the dropdown list in the electronic data entry system was often entered without any clinical evidence of shoulder dystocia. We educated our staff through ‘labour ward coffee mornings’ and ‘clinical governance days’ regarding the RCOG definition of shoulder dystocia. We also removed ‘difficulty of delivering shoulders’ from the data entry system. These measures resolved the issue and this parameter returned to green, and all cases of shoulder dystocia were monitored by cross-checking with the maternity notes.
Similarly, monitoring the views of the users of our service through the Maternity Dashboard helped us to highlight areas that required improvement. Our maternity unit organized ‘customer care training’ for our staff and introduced patient experience tracker (PET) tools to ensure that we deliver a high quality, responsive care.
Tool for improving systems and processes
The Maternity Dashboard has been a very good ‘evidence tool’ in our arguments to improve our facilities, staffing, resources as well as our policies and protocols. We were able to highlight our increasing number of bookings, births, shortfalls in midwifery and obstetric staffing levels as well as patient feedback with regard to the state of the estates/environment by regularly monitoring and reporting these parameters using our Maternity Dashboard. It was a useful tool to keep the senior management of our trust about the ground situation in maternity services. We were invited to present our Maternity Dashboard at Trust Board Meetings and we received strong support and assistance from our chief executive, chair, director of nursing, director of estates, medical directors and entire the trust board to improve our services. There was considerable and very significant investment in maternity services. Since the inception of the Maternity Dashboard in 2007, we have opened a co-located midwifery-led unit, refurbished our labour ward and postnatal wards, increased capacity in our labour ward, opened a second obstetric theatre and a new high dependency unit (HDU bay) within our labour ward. We have appointed six new obstetric consultants and achieved a midwife:birth ratio of 1:30 and a midwife:supervisor of midwife ratio of 1:14. In addition, we have appointed specialist midwives for HIV, perinatal mental health, diabetes and maternal medicine.
Tool for engagement of the multidisciplinary team
Our Maternity Dashboard has offered us an excellent opportunity to interact as a multidisciplinary team. Neonatologists, midwives, obstetricians, anaesthetists, practice educators, paediatric physiotherapy department (for data on Erb's Palsy), complaints department, our management and data management teams work closely to collect, collate and share data. Dissemination of data helps members of the multidisciplinary team to understand and appreciate areas of good practice as well as the challenges faced by various areas in maternity services.
Evolution of the Maternity Dashboard
Having used this tool for over three years, we strongly believe that the Maternity Dashboard should constantly evolve to monitor and address new challenges that may arise in a maternity unit. New parameters could be added to the Maternity Dashboard and areas where good clinical practice has been achieved could be taken off from the Maternity Dashboard and monitored separately. Our Maternity Dashboard for 2010 (Figure 2) includes our performance for the same parameters in the same month in years 2007, 2008, 2009 as this may help us to identify any ‘trends’ over the last three years. Improvements and deterioration, if any, of the care provided may also be evident. Our Maternity Dashboard for 2010 (Figure 2) has considerably ‘evolved’ from its predecessor in 2007 (Figure 1). Our current Maternity Dashboard monitors the ‘morbidity of shoulder dystocia’ (i.e. Erb's Palsy/neonatal admissions) instead of ‘total number’ of shoulder dystocia. In view of serious untoward incidents (SUI) involving interpretation of cardiotocograph (CTG) and use of syntocinon (oxytocin) to augment labour, these parameters are also now monitored.
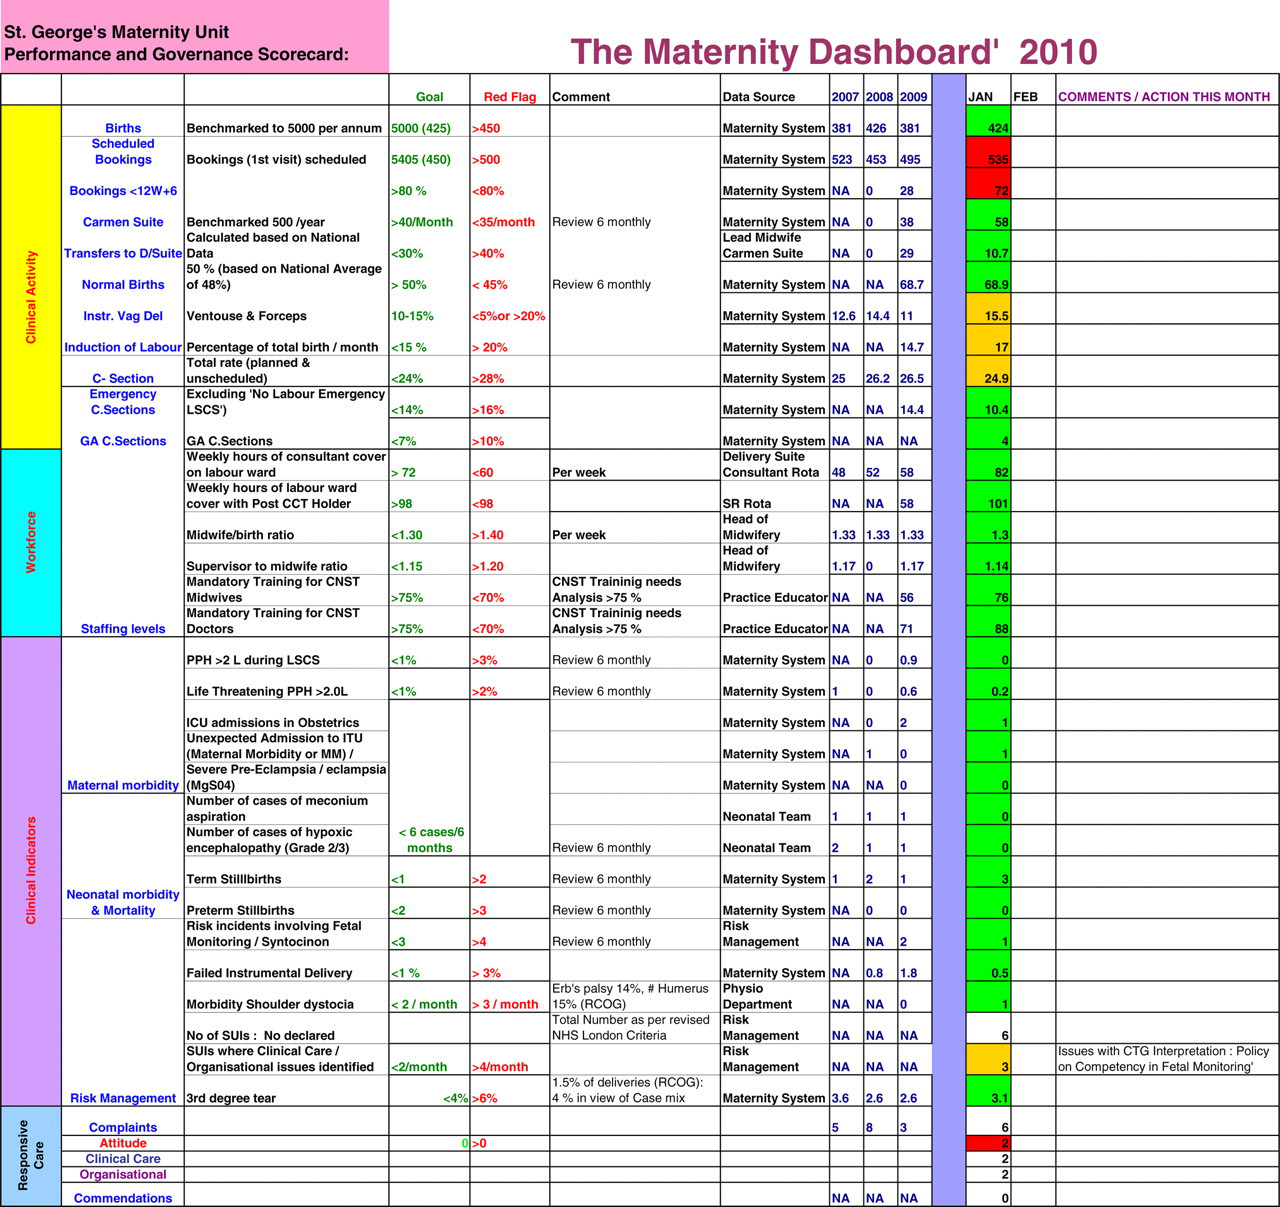
Maternity Dashboard 2010 (available in colour online)
Potential challenges in using the Maternity Dashboard
Multidisciplinary, multiprofessional maternity teams should agree on the parameters that need to be monitored, the standards or goals that should be set for each of the parameters and the individuals who could be contacted at the end of each month to obtain data. While it is desirable to accommodate the requests of every member of the team, it is also paramount to ensure that the Maternity Dashboard is not overloaded with many parameters. Failure to do so may defeat its entire purpose and make it just another ‘paper exercise’ that may attract little engagement with the stakeholders. Strong motivation and leadership by the core maternity team to ensure the success of the Maternity Dashboard is essential for its survival. Needless to say this requires a considerable investment in terms of time and effort. It is also recommended that the Maternity Dashboard is accompanied by a report (Box 1) to inform the team of the overall performance.
One of the challenges of using any monitoring tool is setting the ‘local standards’ against which the performance should be measured. We removed ‘peripartum hysterectomy’ from our Maternity Dashboard as we have developed a 24-hour interventional radiology service for the management of major obstetric haemorrhage. This has, in effect, reduced the need for this procedure in our Maternity Unit. However, it is important to recognize that peripartum hysterectomy still remains a life-saving procedure in many situations, especially if universal interventional radiology service is not available. If a Maternity Unit continues to score ‘amber’ or ‘red’ for ‘peripartum hysterectomy’, it may be useful to critically analyse the options available for the management of postpartum haemorrhage in that unit.
It is not possible to scientifically prove that the Maternity Dashboard definitely helps to improve patient care. Conducting a comparative study with other clinical dashboards is difficult as the parameters monitored in each dashboard may be different. There are several variables that determine good clinical outcomes. One may also argue that similar results may be achieved by strong and effective leadership without the use of the Maternity Dashboard. It is important to appreciate that delivery of Maternity Care involves a multiprofessional, multidisciplinary approach with several stakeholders.
Conclusion
Monitoring of performance against set standards or goals forms a cornerstone of good clinical practice. Clinical performance and governance score cards may help to recognize good clinical practice and also identify areas that require attention and action to promote patient safety and satisfaction.
Our three-year experience with the Maternity Dashboard at St George's Healthcare NHS Trust, London shows that, if used appropriately to engage all the stakeholders in Maternity Care, the Maternity Dashboard could be a valuable tool to improve patient care and outcomes. While strong clinical and managerial leadership are essential to provide a high quality service, monitoring outcomes and complications against local and national standards are also equally important to ensure a maternity service that is safe, effective and patient-centred. The Maternity Dashboard is a tool that may help inform all stakeholders about the performance of a maternity unit so that good practice may be safeguarded and areas that need improvement may be identified and rectified.