




Abstract
Magnetic fluid hyperthermia is a promising cancer therapy in which magnetic nanoparticles are acted upon by a high-frequency oscillating magnetic field. While the accepted mechanism is localized hyperthermia, it is plausible that shear stresses due to nanoparticles rotating near a cell membrane may induce rupture, enhancing the effectiveness of the treatment. With the goal of understanding this further, molecular dynamics simulations were carried out on a model cell membrane. A bilayer composed of dipalmitoylphosphatidylcholine lipids was subjected to an incremental tension as well as an incremental shear stress. In both cases, it was found that the bilayer could withstand a surface tension of approximately 90 mN/m prior to rupture. Under tension, the bilayer ruptured at double its initial area, whereas under shear, the bilayer ruptured at 1.8 times its initial area. The results show that both incremental tension and incremental shearing are able to produce bilayer rupture, with shear being more injurious, yielding a larger surface tension for a smaller deformation. This information allows for comparison between the estimated energy required to rupture a cell membrane and the energy that a magnetic nanoparticle would be able to generate while rotating in a cellular environment. Our estimates indicate that magnetically blocked nanoparticles with diameters larger than 50 nm may result in rupture due to shear.
Introduction
Current treatments for cancer are either highly invasive, such as surgery, or very taxing on the patient, as in radiation and chemotherapy. In some cases, the side-effects associated with treatment result in patients foregoing such treatment. Also, for many types of cancer, established treatments have very low success rates. These limitations stimulate the development of alternative treatments, and recently, the application of nanotechnology and nanoparticles in the early stage detection and treatment of cancer. 1 One promising alternative is magnetic fluid hyperthermia (MFH), in which magnetic nanoparticles are delivered to a cancer tumor and a high-frequency oscillating magnetic field is applied. When subjected to an oscillating magnetic field, the nanoparticles' non-equilibrium response results in energy dissipation and a localized rise in temperature, usually to a target temperature above 46°C. Because cancer cells are more susceptible to heat damage than healthy cells, the treatment has been shown to result in tumor suppression. Jordan et al. 2,3 examined iron oxide nanoparticles functionalized with either dextran or silane for the treatment of breast cancer cells in vitro. When the cells were subjected to a high-frequency alternating magnetic field, a local temperature increase was observed. It was determined that maintaining a tumor temperature of 47°C resulted in cell death. A similar study was conducted by Johannsen et al. 4 to determine the effect of rotating nanoparticles in vivo to treat prostate cancer in mice. Although the authors were able to shrink the tumors, substantial peripheral heating of healthy tissue surrounding the tumor was also observed. Using the heat generated from magnetic nanoparticles to kill cells resulted in the authors coining the term MFH.
Although energy dissipation is widely accepted as the dominant mechanism leading to cell death, it is possible that shear due to rotation of nanoparticles near the cell membrane may lead to membrane rupture, especially for larger nanoparticles with magnetic dipoles that are locked into the nanoparticle crystal structure (i.e. magnetically blocked nanoparticles). There are reports in the literature which indicate that a rise in temperature is not required to induce cell death. In a study conducted by Halbreich et al. 5 magnetic nanoparticles in an oscillating magnetic field were used to damage mouse liver cells in vivo. Cell death was found to occur in the absence of any observable temperature increase, leading to the possibility that mechanical means were involved. In this paper, we aim to estimate the magnitude of the energy required to induce membrane rupture due to shear stresses, and gain understanding of how nanoparticle physical parameters may be engineered to improve the effectiveness of MFH. Molecular dynamics (MD) simulations are performed in the absence of heating and have the ultimate goal of predicting whether a rotating particle interacting with the cell membrane could induce membrane rupture.
As a first approximation, it is possible to model the cell membrane as a lipid bilayer in water. This system has been previously studied using MD simulations, and researchers have been able to reproduce experimental results for many equilibrium thermodynamic properties such as density, area and volume per lipid, bilayer repeat distance, etc. (see Tieleman et al. 6 and Feller 7 for reviews). MD has also been used to study pore formation and stability of lipid bilayers subject to stress. 8,9 Tieleman et al. 10 induced pore formation using an applied mechanical stress. They found that when tension was applied in the form of a lateral pressure >−200 bar, a pore would form in the bilayer. This pore would grow rapidly in size until the bilayer became destabilized. Leontiadou et al. 11 performed a similar study. They began with a bilayer containing a pre-existing pore and subjected the bilayer to a tension in the form of a lateral pressure. They found that at varying levels of stress, up to a surface tension of 38 mN/m, the pores were stable at a particular size that was correlated to the applied stress. If the applied stress was >38 mN/m, the pores would grow indefinitely, resulting in bilayer rupture. The speed of rupture depended on the magnitude of the applied stress. Additionally, in comparison to a bilayer without a preformed pore, Leontiadou et al. 11 found results consistent with Tieleman et al., in that a very high stress of approximately 90 mN/m (−200 bar lateral pressure) is required to form an unstable pore. This led to the conclusion that pore formation and expansion, and hence bilayer strength, is dependent on the loading rate of the stress. This is consistent with the theory of Evans and Heinrich, 12 who hypothesized that at low loading rates, pore expansion becomes rate limiting, whereas at high loading rates, pore formation is rate limiting. Groot and Rabone 13 took a more in-depth look at the rupture of a lipid bilayer. Using dissipative particle dynamics (DPD) 14 they looked at bilayer rupture in the presence of surfactants. To do so, they subjected the bilayer to normal strain increments while monitoring the surface tension of the bilayer. When the surface tension reached a peak and subsequently sharply decreased, this was taken as signifying rupture of the bilayer. Their simulations showed that a lipid bilayer could withstand a surface tension of 67 mN/m prior to rupture.
Similar systems have also been studied experimentally. The most common procedure for examining properties such as area expansion, area compressibility modulus and rupture tension is through the micropipette aspiration technique. 15–19 Here, a small portion of a vesicle is sucked through the tip of a micropipette under a defined pressure drop, and the vesicle deformation and rupture tension can be measured using a high-speed camera. Generally, lipid vesicles rupture following an area expansion of ∼5% and an external tension on the order of 10–30 mN/m. Even very tough bilayers made from high molecular weight diblock co-polymers cannot sustain more than 20% area expansion prior to rupture. 20 However, values for the rupture tension and area expansion are both dependent on the loading rate. 15–19
None of the aforementioned studies focused on the rupture of lipid bilayers under shear, which is what may occur in MFH. The existing literature pertaining to simulations of lipid bilayers under shear is sparse. Blood et al. 21 simulated the response of a solvent shear flow producing a force on the bilayer of 2.9×10⁻³ pN, finding that the flow increased the order of the lipids in the bilayer. Shkulipa et al. 22 used Lees–Edwards sliding boundary conditions 23 to obtain the surface shear viscosity and intermolecular friction of amphiphilic bilayers containing lipids of varying tail lengths. To the best of our knowledge, simulations of lipid bilayer rupture under shear stress are non-existent. In addition, given that intermolecular interactions of a bilayer under tension are different from those occurring under shear, it is not a straightforward expectation that a bilayer would have the same strength for rupture in these two cases.
The paper is organized as follows: the next section describes the system we are using and the methodology employed to simulate it. The following subsections describe the simulation methodology of a bilayer under tension and explains the methodology for subjecting a bilayer to a shear stress. The subsequent section gives the results for each method and compares the two, discussing the results. And finally we have the conclusions.
Materials and methods
All MD simulations are performed with the software package GROMACS, version 3.3.1. 24 The force field used was developed by Berger et al. 25 and is based on the united-atom version of the optimized potential for liquid simulations force field. 26 In this approach, all the CH x groups (with x = 1, 2 or 3) are modeled as single units, while other heavy atoms are modeled as exact atoms. For water, the Simple Point Charge (SPC) model of Berendsen et al. 27 is used. We chose a cut-off for Lennard–Jones interactions of 1.4 nm and electrostatics were treated using a 1.0 nm cut-off and the particle mesh Ewald algorithm 28 for long-range interactions.
The cell membrane in our simulations is modeled as a lipid bilayer, taken from the website of Dr P Tieleman, 29 consisting of 128 dipalmitoylphosphatidylcholine (DPPC) lipids (64 lipids/leaflet) and 3655 SPC water molecules, yielding a fully solvated bilayer. All simulations began by performing an energy minimization on the bilayer, followed by a 5 ns equilibration period in an NPT (fixed pressure P, temperature T and number of atoms N) ensemble (Berendsen temperature coupling at 310°K and isotropic Berendsen pressure coupling at 1 bar 30 ). Figure 1 shows the lipid bilayer following energy minimization and equilibration with a resulting simulation cell size of L x × L y × L z = (6.4 nm) 3 , the initial configuration for all rupture runs.
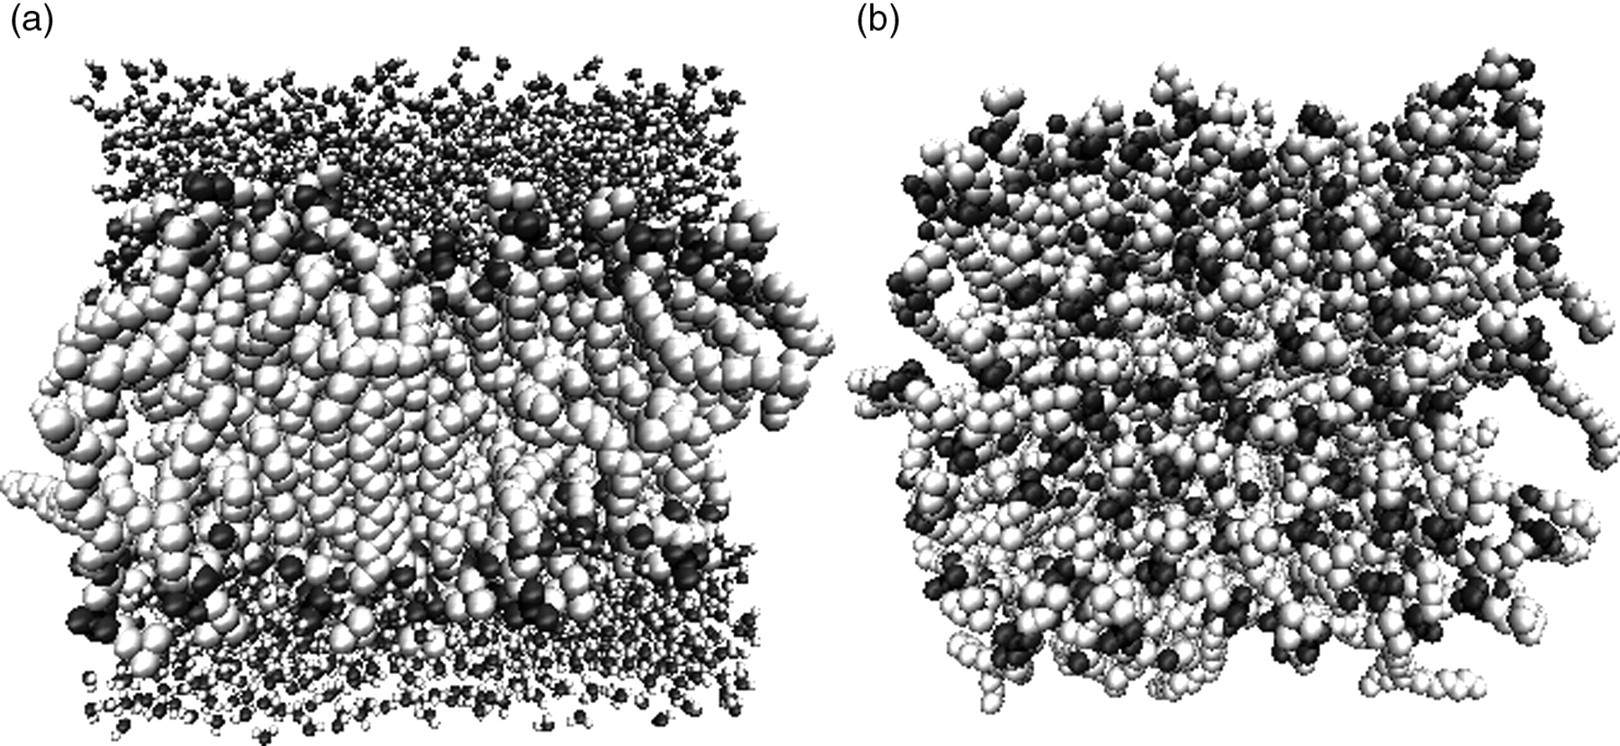
Dipalmitoylphosphatidylcholine (DPPC) lipid bilayer following energy minimization and 5 ns of equilibration time. (a) Side view of the bilayer. (b) Top-down view of the bilayer, with water molecules omitted for clarity
Assessment of bilayer rupture is performed in three ways. First, we perform direct examination of the simulation snapshots for a qualitative view of the rupture. Second, we compute variations in the surface tension as a function of bilayer area. Finally, we also monitor the diffusion coefficient of water molecules through the bilayer.
The surface tension of a bilayer with a surface normal in the z-direction can be found from the pressure tensor P through the relation
31
:


To determine the diffusion coefficient, we calculate the mean-squared displacement (MSD) of the water molecules in the z-direction during each relaxation period. A least-squares fit is used to fit the MSD to a straight line, and the Einstein relation can then be used to calculate the diffusion coefficient D,

Bilayer rupture by incremental tension
Following equilibration, incremental stretches are performed on the bilayer. The x- and y-coordinates of all atoms are incremented by a stretch factor of λ, while the z-coordinates are divided by a stretch factor of λ 2. This transformation conserves the total volume of the bilayer. A stretch is applied instantaneously and followed by an NPNAT relaxation period, which keeps the area of the bilayer fixed and a constant normal pressure of 1 bar. Performing the simulation in this manner allows the bilayer to respond to the applied stress, maintaining quasi-equilibrium. We have analyzed three different values of λ: λ = 1.03, 1.04 and 1.05. For every value of λ, each stretch is followed by a 3 ns relaxation period and an average measure of the surface tension of the bilayer is calculated over this relaxation period to obtain an estimate of the surface tension associated with that particular value of the bilayer area.
Bilayer rupture by incremental shearing
The rotation of a nanoparticle responding to a magnetic field interacting in a cellular environment would likely result in a shear stress imparted on the cell surface. In our simulations, an acceleration is applied in the x-direction over the whole simulation box with the form

Results
We have looked at bilayer rupture using two methods, an in-plane stretch of the bilayer as in reference, 13 and shearing the surface of the bilayer, a process more akin to the forces that a rotating nanoparticle would likely create.
Bilayer rupture by incremental tension
Figure 2 presents the response of the lipid bilayer surface tension to the imposed strain as a function of time for the case λ = 1.03. The value plotted is the running average of the surface tension over each strain increment. The instantaneous surface tension directly following each stretch is quite large; hence, the axes of Figure 2 have been truncated in order to show the physically relevant region in which the bilayer surface tension has reached its equilibrium value after each stretch. The equilibrium value is used in Figure 3, which shows the surface tension of the bilayer as a function of the normalized area of the bilayer.
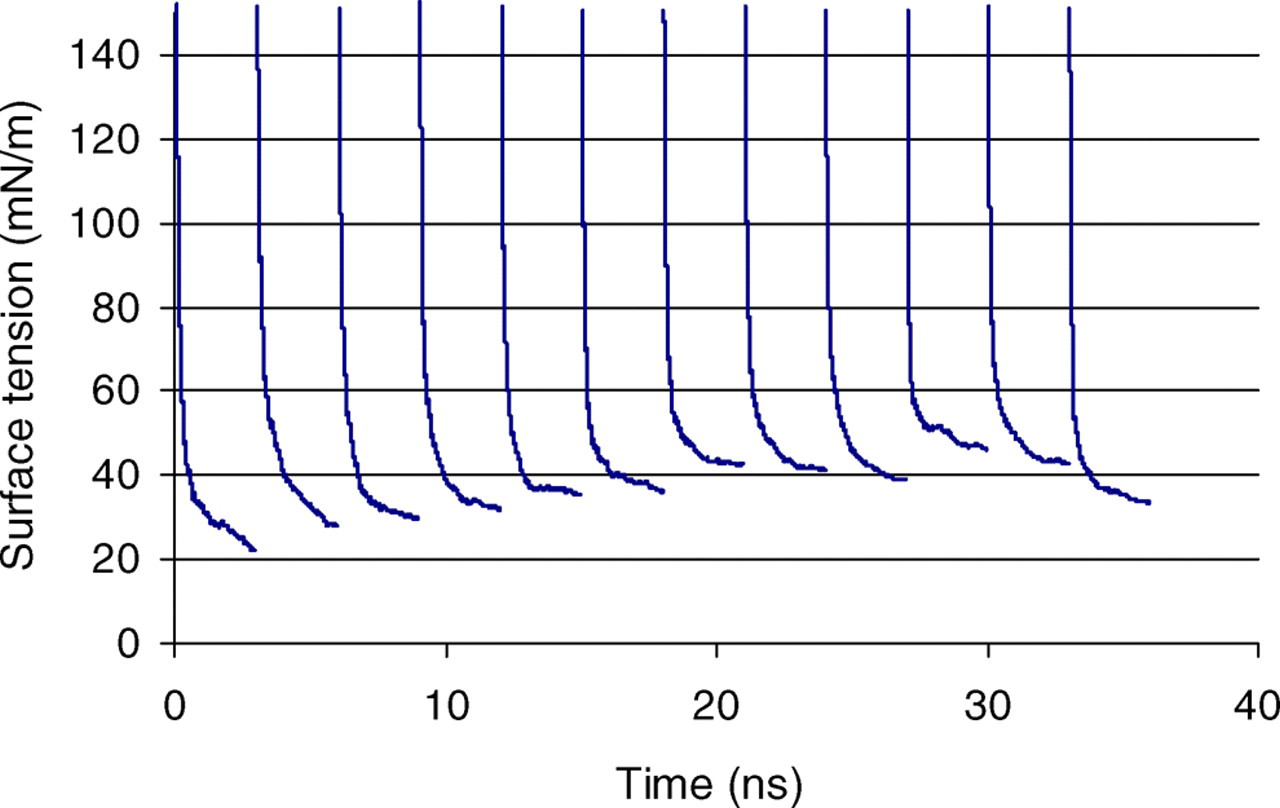
Running average of the surface tension following each bilayer stretch for λ = 1.03, corresponding to an area increase of 6% (A color version of this figure is available in the online journal)

Surface tension versus stretch area for a dipalmitoylphosphatidylcholine (DPPC) bilayer stretched in its principal directions for stretch values λ = 1.03, 1.04 and 1.05 (A color version of this figure is available in the online journal)
Figure 3 shows the change in surface tension of the bilayer with respect to the area of the membrane for each magnitude of strain examined. The abscissa is normalized to the area of an equilibrated bilayer, taken as the result of the equilibration run. As the area of the bilayer increases, the surface tension also increases up to a peak value. Further stretching of the bilayer beyond the peak value results in a decrease in surface tension. Interestingly, the bilayer ruptured at roughly the same tension, independent of the magnitude of the strain. For each strain value, the bilayer could be stretched to approximately double its initial area, with a corresponding surface tension of approximately 90 mN/m.
Figure 4 shows typical snapshots of the evolution of bilayer structure during a simulation. For the first several increments, stretching the bilayer does not seem to induce any noticeable pore formation. With subsequent stretches, small pores in the bilayer begin to develop. These pores are transient and reseal within tens to hundreds of picoseconds. Eventually, the pores in the bilayer become very large, as indicated in Figure 4c. Pores of this size are stable throughout the entire relaxation period of 3 ns and were observed under conditions that led to bilayer rupture.
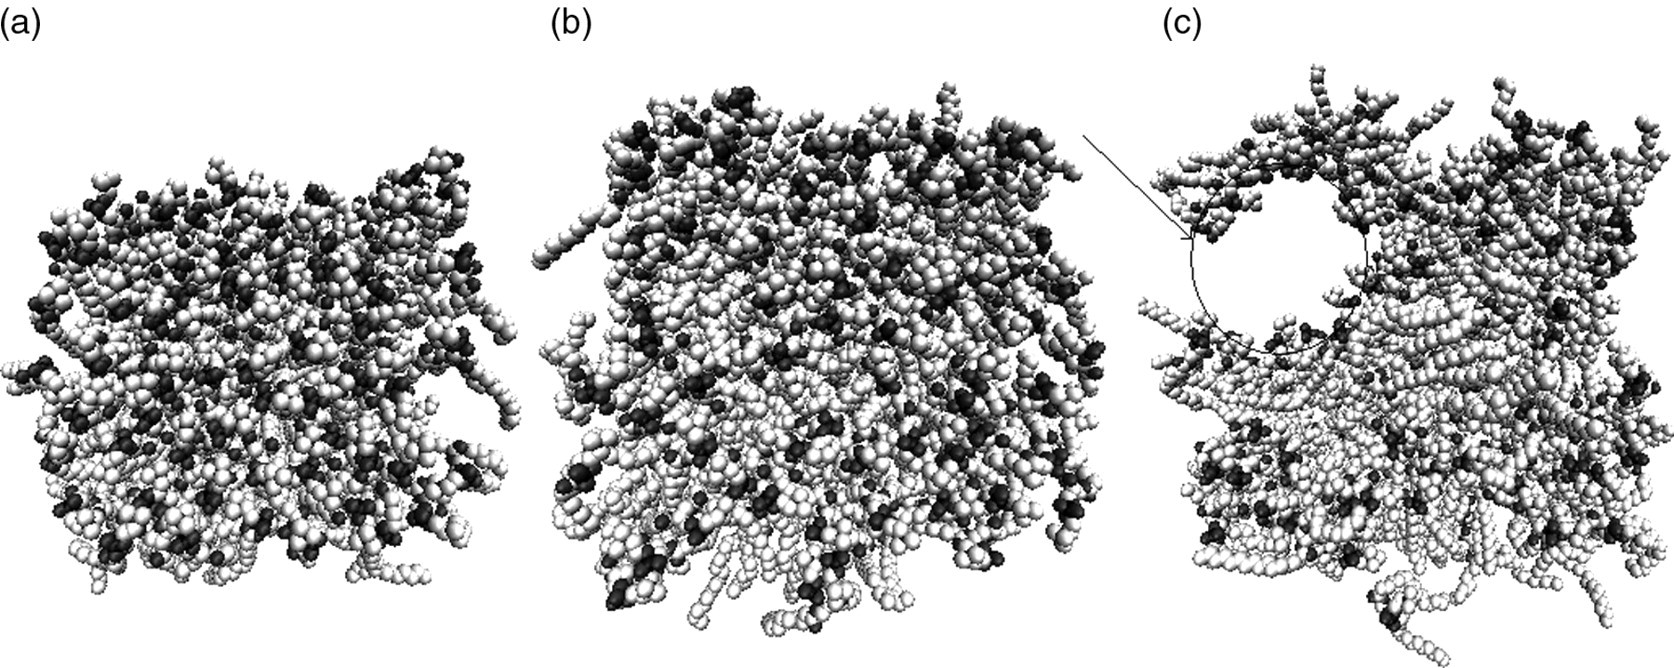
Representative snapshot of pore formation in the bilayer during incremental strain with λ = 1.04. (a) Initial configuration of the bilayer, (b) following five stretches (15 ns) and (c) following 9 stretches (27 ns). In all pictures, water molecules are omitted for clarity
Figure 5 shows the transverse diffusion coefficient of water molecules as a function of bilayer area. When stretched to double the initial area, the diffusion coefficient perpendicular to the bilayer increased by roughly an order of magnitude, indicating water molecules flowing through the pores in the bilayer, and thus rupture. Initially, the diffusion of water perpendicular to the bilayer is quite small, ∼3 × 10⁻⁷ cm2/s, compared with the diffusion coefficient of bulk SPC water, 2.3 × 10⁻⁵ cm2/s. 27 The small but noticeable downward trend present in the figure is a simulation artifact resulting from periodic boundary conditions and the progressive shrinking of the water layer as the bilayer area expands.
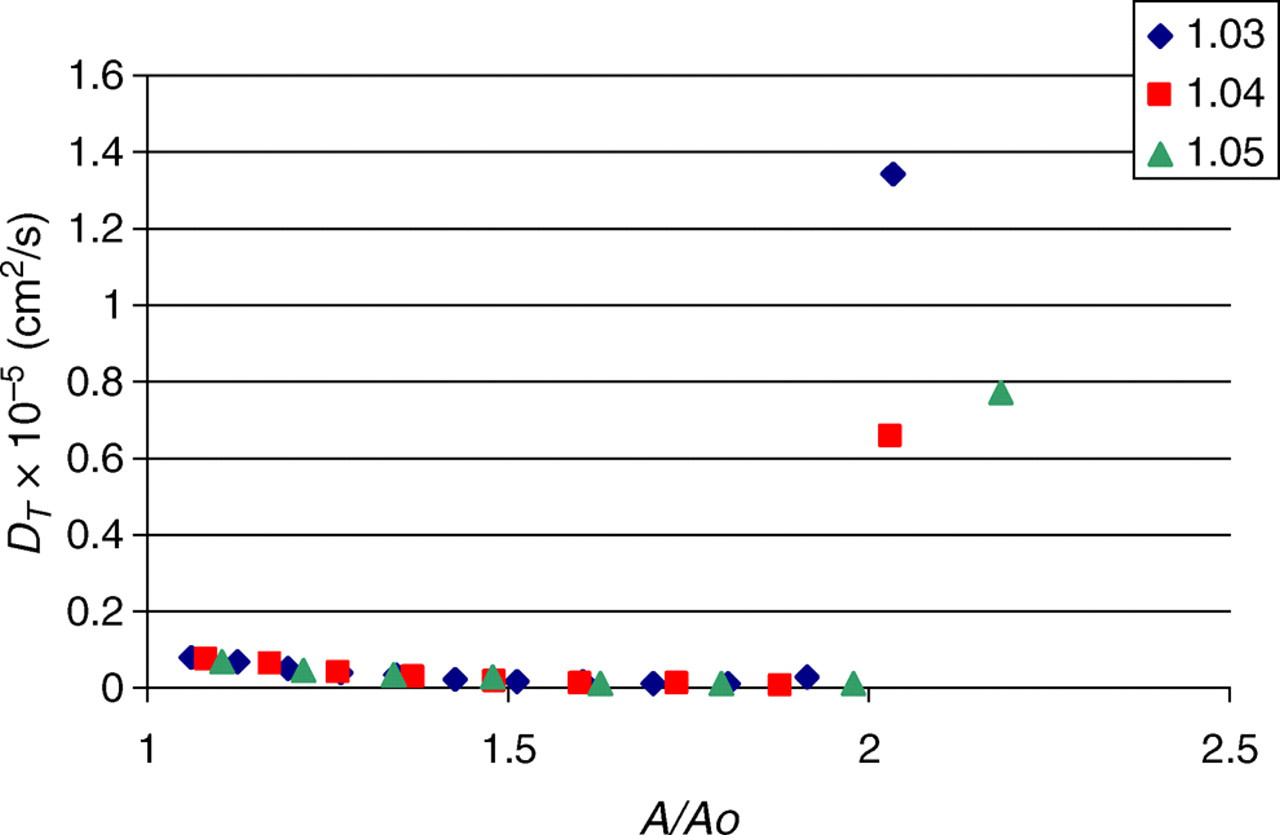
Diffusion coefficient perpendicular to the bilayer surface as a function of normalized bilayer area (A color version of this figure is available in the online journal)
Our results are consistent with those found in reference, 13 in that the bilayer can be stretched to double its initial area before stable pores begin to develop. This is not entirely unexpected because even though different approaches were used, the volumes of each lipid molecule are roughly the same. Stretching the bilayer causes an increase in the average distance between lipid molecules, leading to an increase in the potential energy of the system. Eventually, the increase in intermolecular lipid distance becomes large enough that it is energetically favorable to form a stable pore. The value for the bilayer in our system to rupture is slightly higher than the one found in reference, 13 largely due to the fact that we are working with different lipids. In addition, the authors in reference 13 used DPD, while our simulations were carried out with MD. Systems studied with MD are generally smaller and inherently more stable, and will therefore require larger forces for rupture.
Bilayer rupture by incremental shearing
We have looked at rupture of a lipid bilayer under strain to determine the maximum surface tension it can withstand in order to obtain an estimate of the energy that a rotating nanoparticle would need to produce to rupture a cell. However, a nanoparticle rotating in a cellular milieu would likely induce a shear force, rather than a tension on the lipid bilayer. Thus, it is of interest to study the response of a lipid bilayer to a shear stress.
Figure 6 shows the running averages of the surface tension for each shear–relax iteration. In total, 20 shear–relax iterations were performed. The plot shows an oscillation in the surface tension during the shearing phase followed by a relaxation period of 3 ns, where the surface tension decays. The equilibrium value of the surface tension is taken as the final average value during the relaxation period prior to a subsequent shear increment. Thus, each of these averages corresponds to a point value in surface tension in Figure 7. Initial trials were run with different values of the relaxation time, and it was determined that 3 ns was sufficient for the surface tension to decay to a constant value following a particular shear increment.
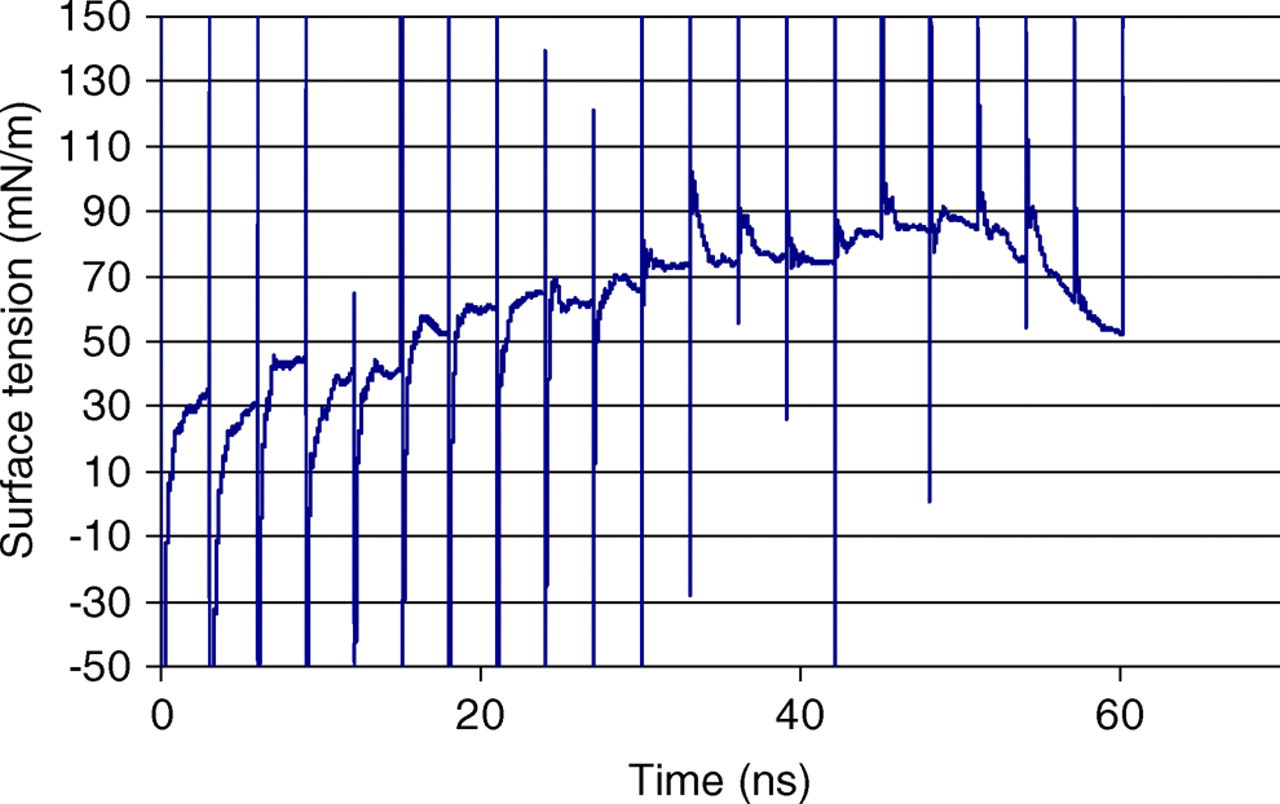
Running average of the surface tension as a function of time for each shear increment (A color version of this figure is available in the online journal)
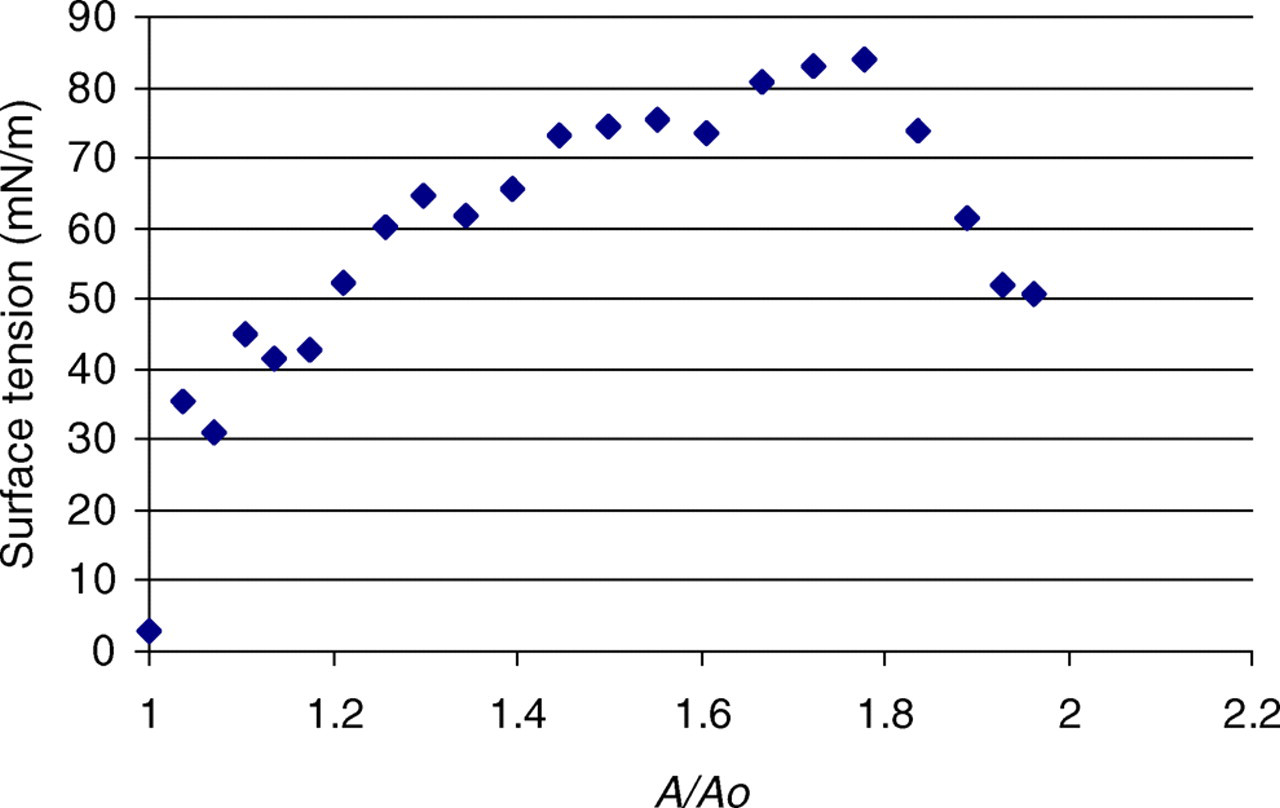
Surface tension versus area for a dipalmitoylphosphatidylcholine (DPPC) bilayer subjected to incremental shearing (A color version of this figure is available in the online journal)
Figure 7 shows a plot of the surface tension of the bilayer versus its area. As can be seen, the surface tension increases with increasing area until approximately 84 mN/m, whereupon it begins to sharply decrease down to 52 mN/m. This decrease is indicative of bilayer rupture. At this point, a large number of water molecules are able to flow through the pores in the bilayer, neutralizing the tension that was imparted by the shearing. The surface tension does not decrease to its initial value at the start of the simulation due to the structure that is still present in the bilayer.
Figure 8 shows the evolution in structure of the bilayer during the shearing simulations. Figure 8a shows the initial configuration of the bilayer prior to any external stimulus. Figure 8b shows the bilayer following 10 shear increments. Evident in the snapshots is that the bilayer is still much intact, although at times one does see small transient pores starting to develop during the 3 ns relaxation period. Figure 8c shows the bilayer following 20 shear increments, with a large pore that is stable over the entire 3 ns relaxation period. This provides visual confirmation that bilayer rupture has in fact occurred. The transverse water diffusion coefficient is plotted in Figure 9, obtaining similar results to the strain simulations.
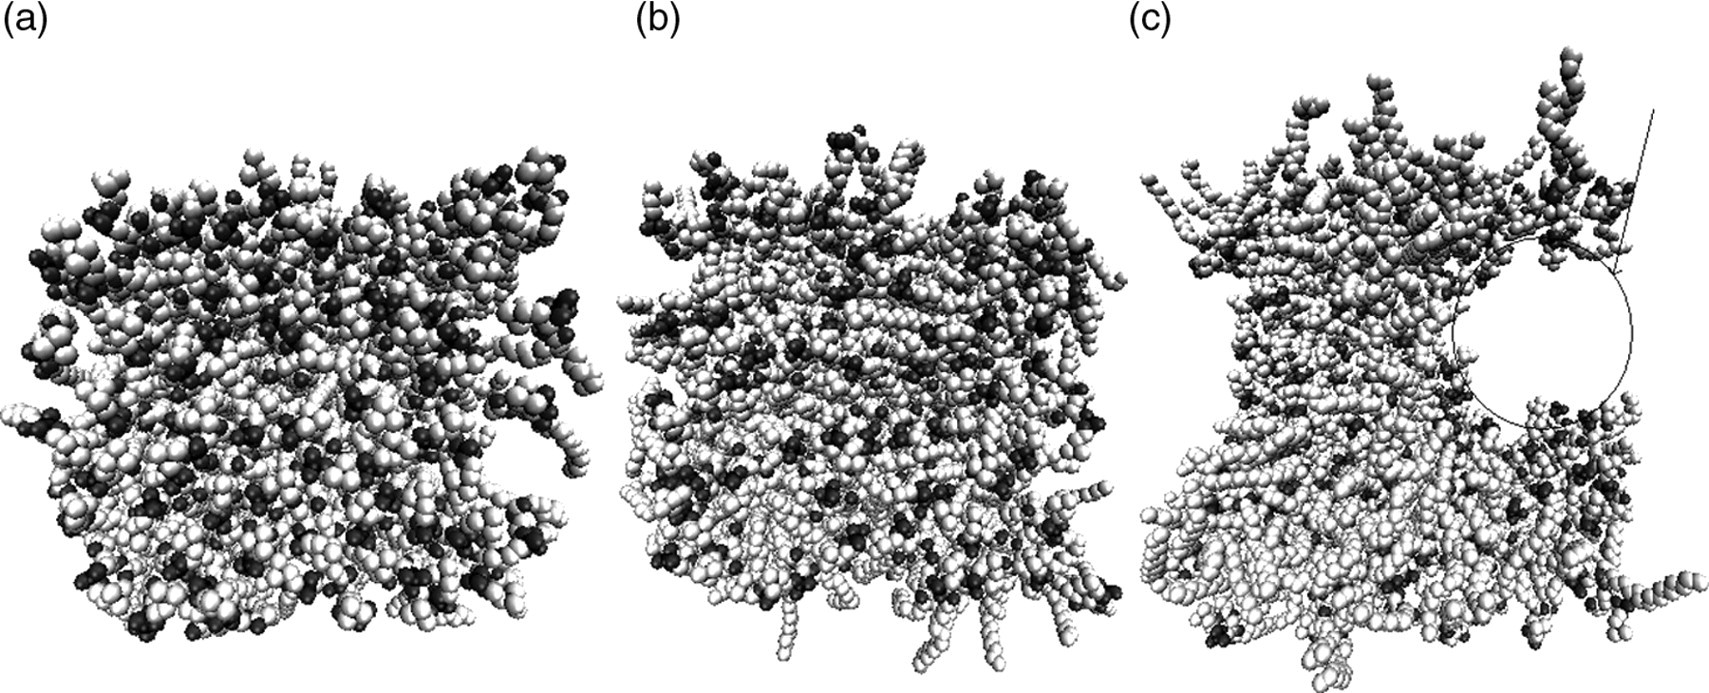
Representative snapshot of pore formation in the bilayer during incremental shearing. (a) Initial configuration of the bilayer following equilibration. (b) The bilayer following 10 shear increments (30.1 ns). (c) The bilayer following 20 shear increments (60.2 ns). The surface tension at this point is 52 dyn/cm. In all pictures, water molecules are omitted for clarity
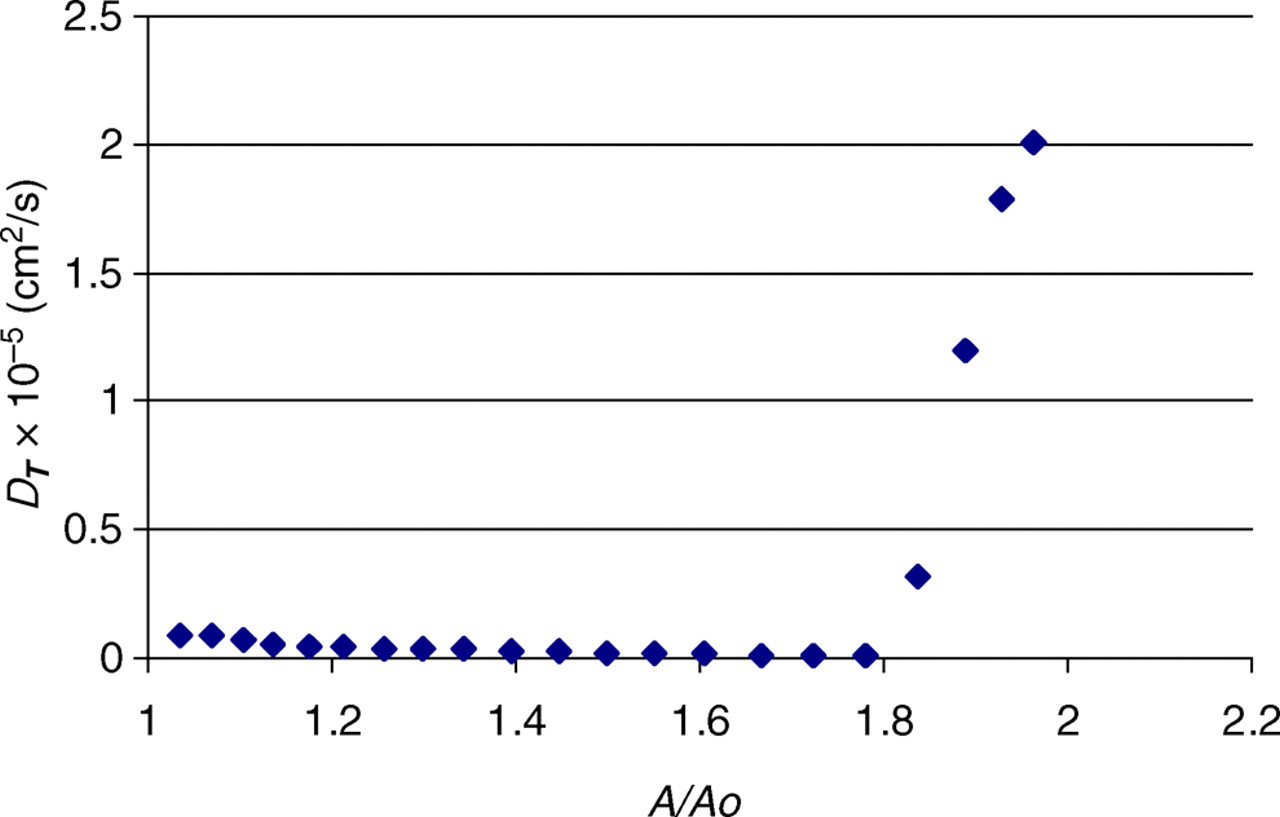
Diffusion coefficient perpendicular to the bilayer surface as a function of normalized bilayer area for the case of a bilayer under shear (A color version of this figure is available in the online journal)
We have found that we can produce bilayer rupture through incremental shearing as evidenced by the surface tension and water diffusion measurements. In comparing our shearing simulations to the incremental stretching simulations, it is seen that the two different methods of producing rupture do not behave in the same way. The strain and shearing simulations showed bilayer rupture at slightly similar values of the surface tension, 84 and 90 mN/m, respectively; however, the bilayer under shear ruptured at approximately 1.8 times its initial area, lower than that for the strain simulation. This suggests that a shear stress is more injurious to a lipid bilayer than in-plane stretching, i.e. lipid bilayers rupturing under shear sooner than in tension indicates that the rotating magnetic nanoparticles will require less energy to produce cell membrane rupture.
Comparison with experimental results
The small system size and fast loading rate present in our simulations have a large influence on the system. In our simulations we are examining a very small portion of a lipid bilayer, not an entire vesicle or cell. In a laboratory setting, the area expansion and rupture tension are generally measured using a micropipette aspiration technique. 15–19 In these studies the area expansion is rarely >5%. However, this value is relative to the entire vesicle rather than the small portion in contact with the micropipette and is dependent on loading rate. 18
Additionally, the micropipette aspiration studies
15–19
report the surface tension at which rupture occurs in the order of 5–10 times lower than the value reported here. This is also as a result of the applied loading rate in our system, which is 7–9 orders of magnitude higher than in the experiments. In fact, using the theory of Evans et al.
17
for the dependence of rupture tension on loading rate, we can estimate a theoretical rupture tension for our applied loading rate (1.4 mN/m/ns). For the high loading rate regimen, Evans et al. derive the relation:

Estimate of the energy required to rupture a cell membrane
Using the results of our simulations, we can estimate the energy required to produce rupture in a lipid bilayer. The surface tension, γ, is defined as the amount of energy needed to increase the area of a surface by a value δ A. Thus, multiplying the surface tension at which rupture occurs by the normalized bilayer area increase results in the energy needed for rupture. In our shearing simulations, δγ = 81.2 mN/m and δ A = 32.2 nm2 yielding an energy for rupture of 6.3 × 10⁻² J/m2. In our simulations, this energy can be thought of as an upper bound. Our system consists of a bilayer film in a simulation cell with cross-sectional area of ∼40 nm2. As such it is unable to undergo thermal fluctuations and undulations with wavelength larger than the length of the simulation cell. A much larger 3D bilayer on the other hand undergoes periodic long wavelength undulations and fluctuations that could enhance the formation of pore–nucleation sites. In our stretching simulations with λ = 1.04, the energy for rupture is calculated as 7.8 × 10⁻² J/m2. We have performed additional simulations with a bilayer half the size (64 lipids) and confirmed that the force increases with decreasing bilayer size. Our simulations on the smaller bilayer result in an energy for rupture of 1.1 × 10⁻¹ J/m2. This is in accordance with the findings of Marrink and Mark, 33 who found that as a result of the size dependence of the area compressibility modulus, the surface tension of stressed bilayers decreases with increasing system size.
Our calculated value of the energy needed to rupture a lipid bilayer under shear can be compared with the energy imparted on a rotating nanoparticle due to an applied oscillating field. From this comparison, an estimate of the size of magnetic nanoparticles needed to induce membrane rupture can be obtained. When a magnetic nanoparticle with a rigidly locked dipole is placed in a magnetic field, the magnetostatic energy is given by
34

Conclusions
We have modeled two plausible mechanisms that may lead to cell membrane rupture during MFH, with the goal of estimating the energies needed to produce rupture of the lipid bilayer and relating these to particle size. Our simulations of membrane rupture via incremental shear stress yield a value for the surface tension of the bilayer equal to 80–90 mN/m, with energy for rupture of 6.3 × 10⁻² J/m2. These results are consistent with previous results obtained for similar systems in the literature. 13 Under conditions representative of experimental MFH studies, the estimated energy required to produce rupture obtained from our simulations yielded a required nanoparticle diameter of 80 nm. This is 5–10 times larger than typical particle diameters used in MFH. However, a particle size of 80 nm is plausible for biomedical applications, in which the widely accepted upper limit is between 100 and 200 nm. We also note that these estimates are based on the value of the energy required to rupture a lipid bilayer of approximately 36 nm2. This energy can be considered an upper bound, since at the nanoscale size (40 nm2) the bilayer is more stable resulting from reduced thermal fluctuations as compared with a real bilayer; therefore, the force and the energy necessary to rupture real cells in vivo might be lower.
Our next step is to increase the complexity of the system to better model a realistic natural environment. Cell membranes are much more complicated than the simple lipid bilayer system simulated here. For example, cellular membranes in vivo contain a significant amount of cholesterol, which acts to order the lipids resulting in a more solid-like membrane. Similarly, cellular membranes also contain several types of lipids, proteins and surface attached carbohydrates. All of these factors could contribute to the stability of a membrane in response to an applied stress.
Future simulations will involve the addition of ions to the system to simulate the chemical and electrical potential gradient that is present across all cells, for it is the loss of an ion gradient that will ultimately lead to the death of a cell. Following this, it would be beneficial to study the interaction of the magnetic nanoparticle with the cell membrane. As the nanoparticles will likely include a polymeric coating such as dextran, silane, polyethylene glycol, polyvinyl alcohol, etc., simulating the interaction of the polymers coating the nanoparticle with a lipid bilayer would provide useful insights for the study of MFH.
Footnotes
Acknowledgements
The authors would like to thank the NSF NIRT Grant CBET-0609117 and NSF IGERT Nanopharmaceutical Engineering and Science Grant #0504497 for funding this research.