
Abstract
Preliminary clinical trials have recently shown that phenytoin, an antiepileptic drug, may also be beneficial for treatment of bipolar disorder. To examine molecular mechanisms of action of phenytoin as a potential mood stabilizer, DNA microarrays were used to study the effect of phenytoin on gene expression in the hippocampus and frontal cortex of Sprague–Dawley rats. While our particular interest is in bipolar disorder, this is the first DNA microarray study on the effect of phenytoin in brain tissue, in general. As compared with control rats, treated rats had 508 differentially expressed genes in the hippocampus and 62 in the frontal cortex. Phenytoin modulated the expression of genes which may affect neurotransmission, e.g. glutamate decarboxylase 1 (Gad1) and γ-aminobutyric acid A receptor, alpha 5 (Gabra5). Phenytoin also exerted an effect on neuroprotection-related genes, namely the survival-promoting and antioxidant genes v-akt murine thymoma viral oncogene homolog 1 (Akt1), FK506 binding protein 12-rapamycin associated protein 1 (Frap1), glutathione reductase (Gsr) and glutamate cysteine ligase catalytic subunit (Gclc). The expression of genes potentially associated with mechanisms of mood regulation such as adenylate cyclase-associated protein 1 (Cap1), Glial Fibrillary Acidic Protein (Gfap) and prodynorphin (Pdyn) was also altered. Some of the above genes are regarded as targets of classical mood stabilizers and their modulation supports the clinical observation that phenytoin may have mood-stabilizing effects. The results may provide new insights regarding the mechanism of action of phenytoin and genes found differentially expressed following phenytoin administration may play a role in the pathophysiology of either bipolar disorder or epilepsy.
Introduction
Bipolar disorder, or manic–depressive illness, is a common condition with a life-time prevalence of 1–2%. 1,2 Its episodic course with intervening full recovery belies the severe impact of this disorder. The cumulative effects of recurring bouts of mania and depression lead to an increased rate of marital and family breakdown, unemployment, impaired career progress and consequent financial difficulties. About 15% of bipolar patients commit suicide, and mortality rates due to physical disorders are also increased. 3,4
Drugs administered to treat bipolar disorder include lithium salts and anticonvulsant drugs such as valproate, carbamazepine and lamotrigine. 5,6 In particular, valproate is one of the most widely used drugs for bipolar disorder treatment. 7 In addition to their effect on voltage-gated sodium channels, 8 anticonvulsants have also been suggested to exert their antiepileptic effect by reducing neuronal excitability through the modulation of glutamate and γ-aminobutyric acid (GABA) neurotransmission. 9,10 This latter mechanism of action has been hypothesized to be involved in the antimanic effect produced by these drugs in bipolar patients. 11,12 The neuroprotective action of anticonvulsant drugs may also contribute to their mood-stabilizing effect. 11
Phenytoin is an anticonvulsant that has successfully been used to treat epilepsy for many years, but its potential as a mood stabilizer has only recently been evaluated in a controlled manner. 13–15 In double-blind controlled trials phenytoin administration to bipolar patients induced anti-manic properties 13 and a prophylactic effect. 14 In a double-blind controlled trial in patients with unipolar depression, phenytoin was as effective as fluoxetine in the overall rate of response and the onset of response. 16 Yet, phenytoin's molecular mechanism of action as a mood stabilizer has not been studied. Phenytoin shares with other anticonvulsants the ability of blocking voltage-gated sodium channels, 17,18 but this effect is, most probably, not the only mechanism of action of this drug. It has been suggested that modulation of glutamate and GABA release contributes to the anticonvulsant effect of phenytoin. 19
To investigate phenytoin's molecular mechanisms of action as a potential mood stabilizer, we used the hypothesis-free DNA microarray methodology and analyzed gene expression profiles in the hippocampus and frontal cortex of rats chronically treated with phenytoin as compared with untreated rats. We investigated whether modulation of gene expression by phenytoin supports a clinical mood-stabilizing effect.
Materials and methods
Animals and phenytoin treatment
The animals used in this study were adult male Sprague–Dawley rats (Harlan, Israel). Owing to changes induced by the estrous cycle in female rodents, studies of drug effects are usually conducted on male animals. 20,21
Prior to any experimental manipulation the rats were acclimatized for one week in the animal house facility of the Psychiatry Research Unit of Ben-Gurion University. All experimental procedures were approved by the Ethical Committee on Animal Experiments of Ben-Gurion University and all the animals were taken care of according to the NIH Guide for the Care and Use of Laboratory Animals.
Three rats of about 250 g body weight were treated with 6 g phenytoin/kg food for one month, which resulted in mean plasma levels of 16.1 ± 2.2 μg/mL, within the therapeutic range as a mood stabilizer 16 and an antiepileptic 22 in human subjects and an antiepileptic in rat models. 23 Three control rats were fed with regular food under parallel housing conditions.
The rats were sacrificed by guillotine, brains immediately separated and hippocampus and frontal cortex dissected. The tissue samples were flash frozen, sent to the University of Pisa under dry ice and stored at –80°C until their use.
Preparation of RNA and microarray hybridization
Total RNA was isolated from brain specimens using the RNeasy Mini kit (Qiagen, Valencia, CA, USA). Residual DNA was eliminated by on-column DNase digestion using the RNase-Free DNase Set (Qiagen).
The concentration and purity of total RNA were measured by 260 nm UV absorption and by 260/280 ratio, respectively, using a NanoDrop ND-1000 Spectrophotometer (NanoDrop Technologies, Wilmington, DE, USA). All RNAs displayed a 260/280 optical density ratio >1.9.
RNA integrity was assessed by the Agilent 2100 Bioanalyzer (Agilent Technologies, Palo Alto, CA, USA). All RNAs displayed a RNA Integrity Number (RIN) >7.
Five hundred nanograms of total RNA from control and treated animals were amplified and labelled with Alexa 647 (red) or Alexa 555 (green) dyes (Invitrogen, Carlsbad, CA, USA) by using the Amino Allyl MessageAmpTM II aRNA Amplification kit (Ambion, Austin, TX, USA) according to the manufacturer's protocol. The Alexa 647 and Alexa 555 dye incorporation rates were measured by ultraviolet absorption at 647 and 555 nm, respectively. Both fluorophores showed a comparable incorporation efficiency ranging between 3 and 4 dye molecules per 100 nucleotides. Consequently, 500 μL of hybridization mixture containing 0.75 μg of Alexa 555-labelled amplified RNA (corresponding to 80–100 pmol of Alexa 555 dye), 0.75 μg of Alexa 647-labelled amplified RNA (corresponding to 80–100 pmol of Alexa 647 dye), 50 μL of 10× control target, 10 μL of 25× fragmentation buffer and 250 μL of 2× hybridization buffer (the three latter ones from the In situ Hybridization kit Plus, Agilent Technologies) were hybridized to each Whole Rat Genome Oligo Microarray (Agilent Technologies) that contained 44,000 60-mer oligonucleotide probes representing 41,015 transcripts of rat. The array hybridization was performed at 60°C in the oven (Agilent Technologies) for 17 h under constant rotation. Then, the arrays were washed consecutively in 6× saline sodium citrate, 0.005% Triton X-102 solution (In situ Hybridization kit Plus, Agilent Technologies) for 10 min at room temperature and in 0.1× saline sodium citrate, 0.005% Triton X-102 solution for five minutes on ice and air dried.
Experimental design
The differential gene expression between treated and untreated samples was determined in a blind manner: the identity of the samples was revealed to the experimenters at the University of Pisa only after the statistical analysis was completed.
A microarray loop experimental design was applied for each brain area: each sample, labelled one time with Alexa 555 and the other with Alexa 647, was hybridized on two distinct arrays and compared with two different samples as indicated in Table 1. Two experimental replicas in dye swap per sample were thus produced.
Microarray experimental design
Microarray scanning and data analysis
Microarray images were acquired by Axon 4000B dual-laser scanner (Molecular Devices, Sunnyvale, CA, USA) at 5 μm resolution, 100% power and photomultiplier tube gain depending on the needed color balancing.
Intensity raw data were extracted from TIF images using the GenePix Pro 6.0 software (Molecular Devices) and analyzed by three different statistical methods: Significance Analysis of Microarrays (SAM),
24
LInear Model of MicroArray data (LIMMA)
25
and MicroArray ANalysis Of VAriance (MAANOVA).
26
All of these packages are add-in libraries of Bioconductor (
Before the statistical analysis, raw data were background-subtracted using the ‘minimum’ method by LIMMA, which sets any null or negative intensity value generated by the classical background subtraction, equal to half the minimum of the positive corrected intensity values for that array. The application of this method was necessary because MAANOVA package does not accept negative intensity values in the input file.
Data analyzed by LIMMA and SAM were normalized with the ‘LOWESS’ method by LIMMA (SAM does not provide any normalization method). Files analyzed by MAANOVA were normalized by the ‘linlog’ and ‘rlowess’ methods, which are both included in the MAANOVA package.
Three normalization strategies and statistical methods of analysis were used in order to independently generate three lists of differentially expressed genes to be compared with each other in a cross-informatics validation approach. In LIMMA only genes with B-statistic 27 >0 and moderated t-statistic 28 with adjusted P value 29 ⩽ 0.01 were considered. In SAM a False Discovery Rate (FDR) threshold of 0.01 was used. In MAANOVA a linear model was fitted accounting for dye and treatment main effects and gene-specific effects. F-statistics 30 and adjusted P value 29 ≤0.01 were applied.
To achieve the highest statistical confidence in the results, we considered for further analysis only those genes that were indicated as differentially expressed by LIMMA and at least one of the other two methods.
In order to compare the responsiveness of hippocampus and frontal cortex to phenytoin treatment, we carried out a principal component analysis (PCA) using the gene expression similarity investigation suite Genesis. 31
We plotted the first two principal components of normalized and background-subtracted intensity values and used Euclidean distance to evaluate the similarity among samples.
The pathway analyses were performed using two distinct tools: Pathway Express (
Owing to limited information on gene functional annotations currently retrievable from databases, only a small group of genes was mapped by these tools. To identify other genes that might have a relevant role in the etiology of bipolar disorder and its treatment, we also analyzed the list of differentially expressed genes by an accurate investigation of the literature. To this end, we used a Gene Network for Navigating the Literature, the information Hyperlinked Over Proteins (iHOP) (
Validation of microarray data by reverse transcriptase-quantitative polymerase chain reaction
For reverse transcriptase-quantitative polymerase chain reaction (RT-qPCR) experiments, RNA samples were pooled and reverse transcribed with random and oligo-dT primers using the QuantiTect Reverse Transcription kit (Qiagen). The following PCR primers (forward and reverse) were designed with Beacon Designer 4.0 software (Premier Biosoft International, Palo Alto, CA, USA) and synthesized by Invitrogen.
Grina: 5′ AACTGGGACAAGAGCATTCG 3′ and 5′ AGATGAAGAAGATGGCGTAGG 3′; Gad1: 5′ GCAATTACTAAGGGCTAACCATC 3′ and 5′ ATCCATCATCCATCCATTCAGG 3′; Cap1: 5′ TCTGGCTCTGACGACTCTG 3′ and 5′ CTTCTTTGTGGCTGGTTTGG 3′;
Gclc: 5′ ACATCTACCACGCAGTCAAG 3′ and 5′ AACATCGCCGCCATTCAG 3′; Akt1: 5′ CAGGAGGAGGAGACGATGG 3′ and 5′ AGGATCTTCATGGCATAGTAGC 3′; Impa1: 5′ GGAGTGCTGCTGGATGTG 3′ and 5′ GCTGGATGCGGTTCTACG 3′; Mapk10: 5′ TCAGAAGAGAAGACTAAGAACGG 3′ and 5′ GCTGTCAGTGTCGGATGC 3′; Fyn: 5′ AGAGCGAAACCACCAAAGG 3′ and 5′ TAGACGGCAGCAGAGACC 3′; Rapgef4: 5′ AGGAGCCAGCCATTCAATC 3′ and 5′ AGCAACACAGTCAGTAGTAGC 3′;
Prkce: 5′ CAAGCAACATCCATTCTTCAAGG 3′ and 5′ ACAAGTGTAAGTATTGGCTCTTCC 3′;
Frap1: 5′ ACAGATTGACACTTGGTTACAGG 3′ and 5′ TGTTCTTCAGGATCTTGTTGGC 3′;
B2mg: 5′ TCAAGTGTACTCTCGCCATCC 3′ and 5′ GCAAGCATATACATCGGTCTC 3′; and
Mapk6: 5′ TGACTGAGCCACACAAACC 3′ and 5′ TCGTCCACTTCGTCTTCTATG 3′.
RT-qPCR was performed using Platinum SYBR Green qPCR Supermix UDG kit (Invitrogen, Carlsbad, CA, USA) and the iCycler iQ instrument (Bio-Rad, Hercules, CA, USA). The thermal cycling program consisted of two minutes' incubation at 50°C with uracil-DNA glycosylase, 1.5 min at 95°C (DNA polymerase activation), 40 cycles at 95°C per 15 s (denaturation step) and 58–60°C (depending on primer T m) per 30 s (annealing–extension step). Consequently, a gradual increase in temperature from 55°C to 95°C at a rate of 0.5°C/10 s was utilized to build a melting curve. SYBR green fluorescence was detected during the annealing–extension step. For each primer pair we tested the amplification efficiency using five serial dilutions of cDNA carried out in duplicate. All primer pairs displayed efficiency between 90% and 100%.
Beta-2 microglobulin (B2 m) and mitogen-activated protein kinase 6 (Mapk6) were used as reference genes to normalize the expression of the genes of interest. B2 m had been used as a house-keeping gene in previous studies, 36 while Mapk6 has been recommended as a brain control gene in a paper dealing with the selection of rat reference genes for gene expression studies. 37 The expression of these two genes in phenytoin-treated samples versus untreated samples did not significantly change in our microarray and RT-qPCR experiments.
Each sample was run in triplicate and for each gene the standard deviation for the three experimental replicates was less than 0.4 arbitrary units. The expression ratios of target genes in treated samples relative to untreated samples were calculated with the Pfaffl method 38 using the Gene Expression MacroTM 1.1 application (Bio-Rad) and reported as fold increase or decrease.
Results
Microarray results
Prolonged administration of phenytoin altered rat gene expression in the hippocampus and, to a lesser extent, in the frontal cortex. In particular, 508 genes were differentially expressed in the hippocampus, 465 up-regulated and 43 down-regulated. In the frontal cortex 62 genes were differentially expressed, 56 up-regulated and six down-regulated. Six genes were differentially expressed in both brain areas. The complete information concerning the microarray experiments and results can be retrieved from the ArrayExpress database at the European Bioinformatics Institute (EBI) (
To study the different results in the two brain areas we carried out PCA of the expression profiles of the hippocampus and frontal cortex (Figure 1). The first principal component (PC1), which accounts for 92% of the total variance, separates the samples according to the brain area. The distance between the two groups of control samples indicates a considerable difference in global gene expression between the frontal cortex and the hippocampus. There was an almost complete overlap between treated and untreated frontal cortex samples implying that phenytoin does not strongly affect frontal cortex gene expression. On the other hand, as evidenced from the greater distance between the untreated and treated groups of hippocampal specimens, there was a preferential gene expression effect of phenytoin on this brain region.
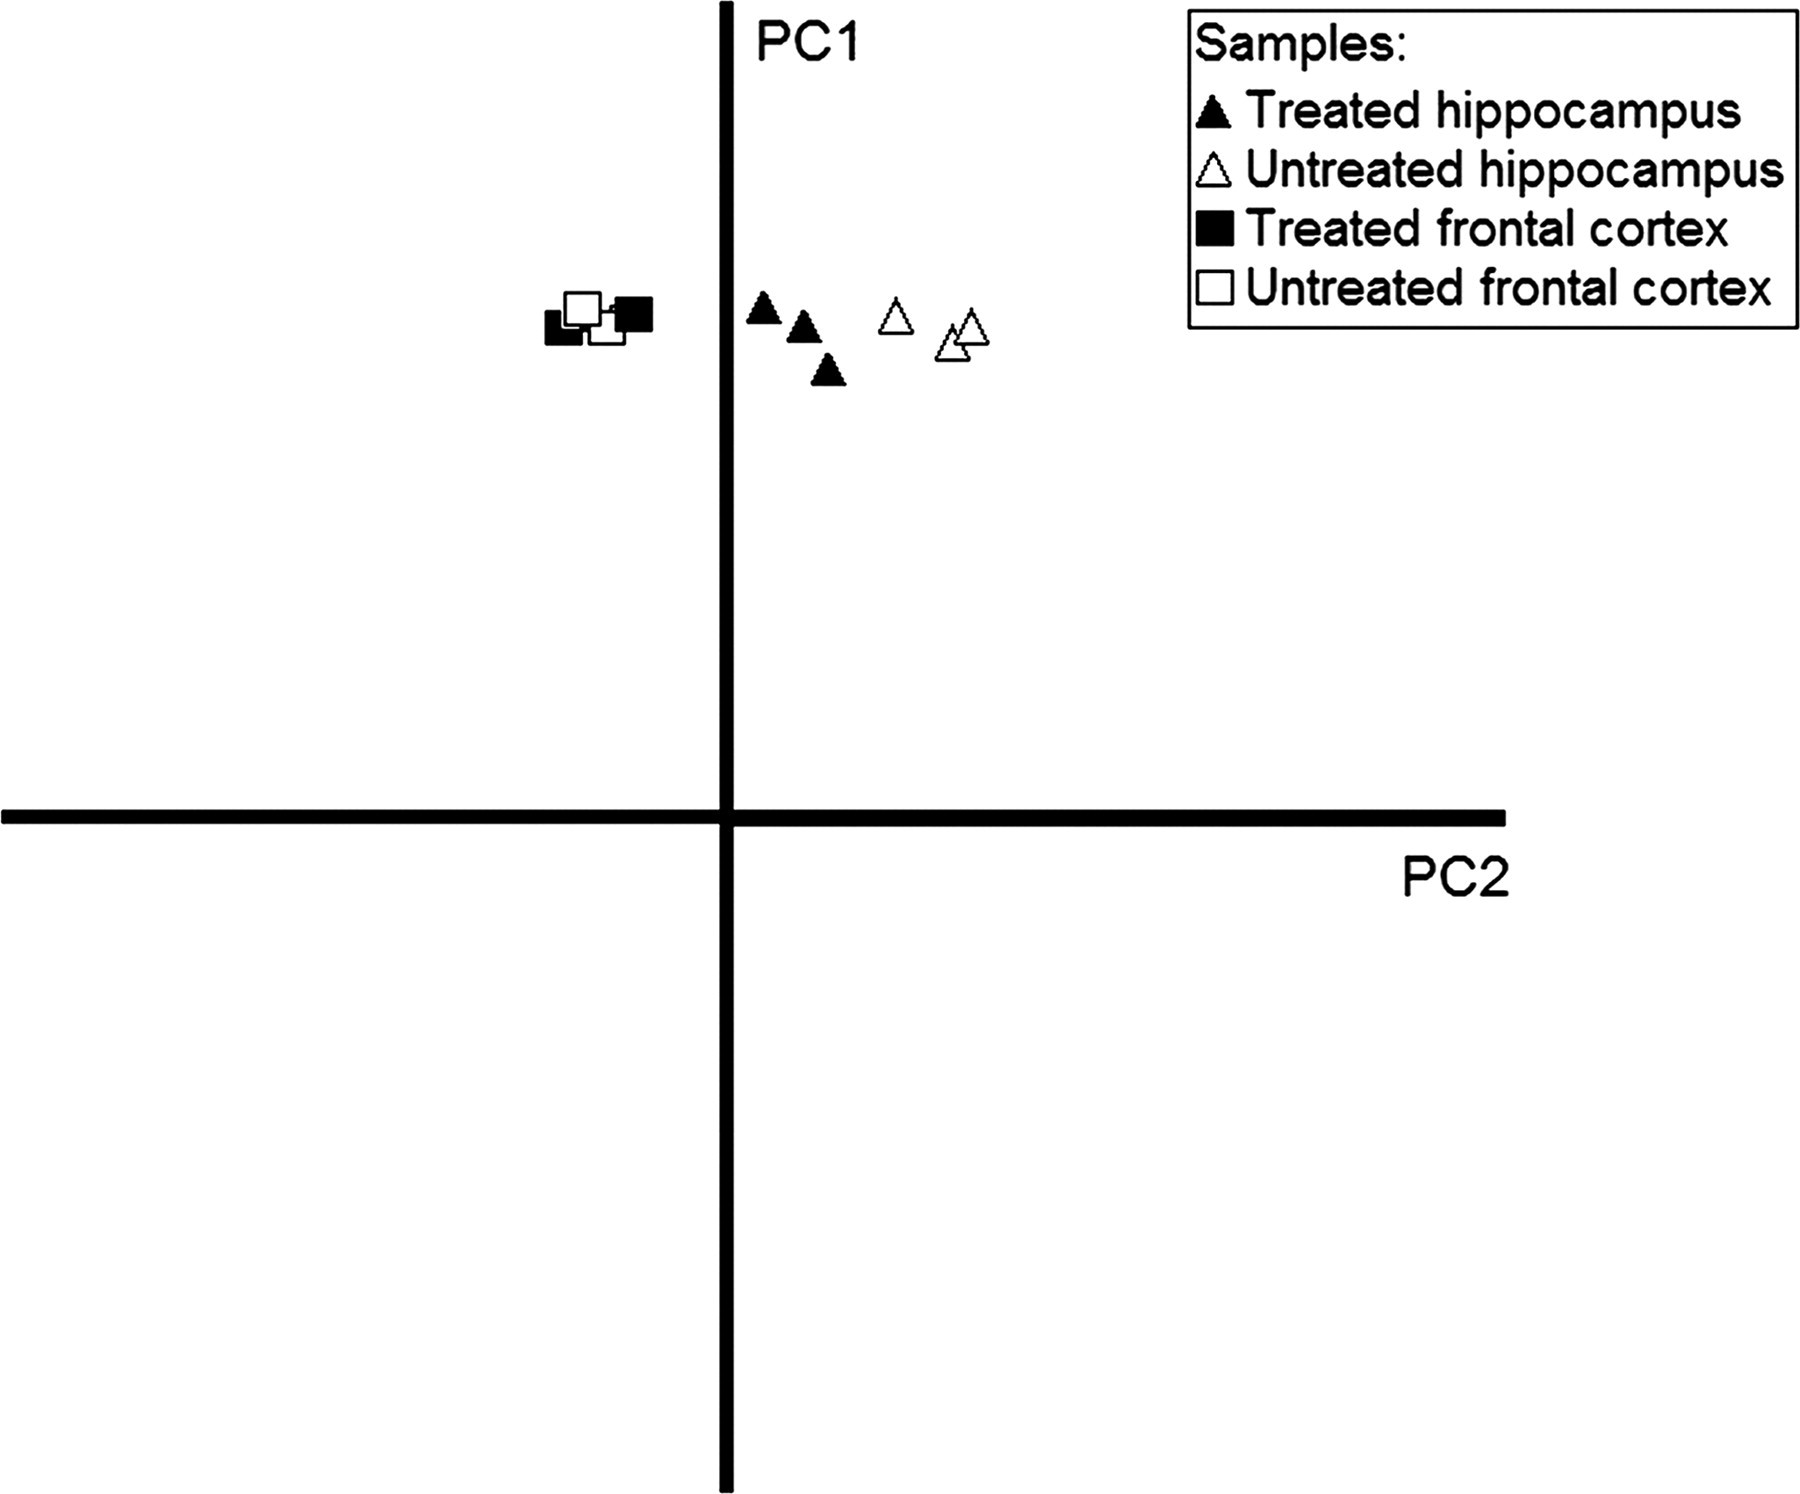
Principal component analysis reveals sample grouping based on brain region and phenytoin treatment
Pathway analyses by Pathway Express and Pathway Explorer localized the differentially expressed genes in a variety of cellular pathways including glutamate metabolism, glutathione (GSH) metabolism, the mitogen-activated protein kinase (MAPK) pathway, the phosphatidylinositol (PI) signalling system, the Wnt signalling pathway, tight junction, ion channels and transport, fatty acid metabolism, and neuroprotection. In particular, Pathway Express located 23 genes in 17 pathways in the hippocampus and one gene (transforming growth factor, beta receptor 1) in three pathways in the frontal cortex (see supplementary Table S1). The three frontal cortex pathways were included in the pathways pointed out in the hippocampus. Pathway Explorer located 37 genes in 46 pathways in the hippocampus and four genes in 10 pathways in the frontal cortex (see supplementary Table S2). These 10 frontal cortex pathways were included in those indicated in the hippocampus.
RT-qPCR results
Most of the differentially expressed genes in the frontal cortex were of unknown function and therefore were not selected for RT-qPCR validation. Among hippocampal differentially expressed genes found by microarrays, 11 were validated by RT-qPCR: Akt1, Impa1, Mapk10, Fyn, Rapgef4, Prkce, Frap1, Cap1, Gad1, Grina and Gclc. All these genes were selected on the basis of their P value and biological relevance.
The differential expression was confirmed for 10 out of the 11 examined genes (Figure 2). Only the expression of the Rapgef4 gene did not show up-/down-regulation by phenytoin.
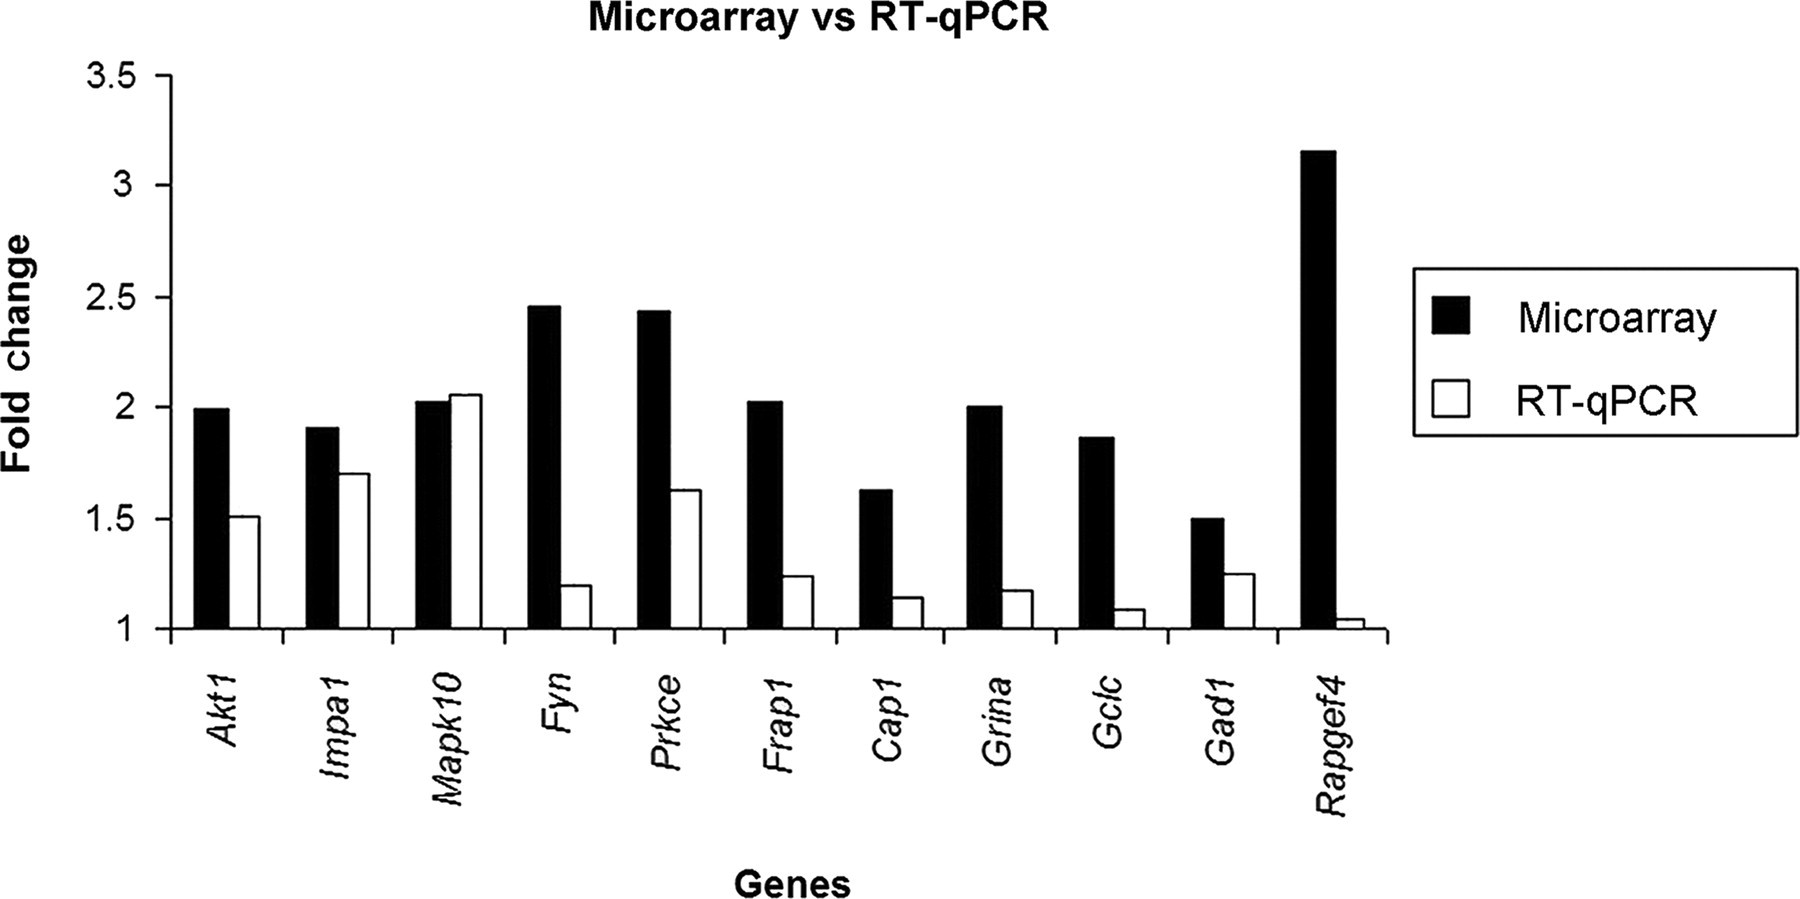
Microarray and reverse transcriptase-quantitative polymerase chain reaction (RT-qPCR) fold changes of the 11 genes found to be differentially expressed by microarrays and tested for verification by RT-qPCR. Concordant up- or down-regulations were verified for 10 out of the 11 genes
Discussion
A hypothesis-free unbiased approach using DNA microarray analysis was undertaken to study molecular mechanisms of action of chronic phenytoin treatment in rat hippocampus and frontal cortex.
Phenytoin was administered chronically to rats since the mood-stabilizing effect in patients is observed after at least two to three weeks of treatment, and might be due to long-term neuronal and molecular changes. 39,40 We selected hippocampus and frontal cortex because of the evidence from in vivo brain imaging and postmortem studies that these two brain areas are implicated in the pathogenesis of bipolar disorder. 41–45 A thorough review of imaging studies 46 pointed at smaller than normal cortical volumes, particularly prefrontal regions. Poor performance of manic patients in neuropsychological tests of vigilance, speed of information processing and executive function correlated with decreased prefrontal and hippocampal volume. 47 As reviewed by Soares and Mann, 48 frontal lobe hypometabolism is one of the most replicated findings in bipolar disorder, regardless of mood state.
Prolonged phenytoin administration affected the expression of many more genes in the hippocampus than in the frontal cortex. Only a few genes were differentially expressed in both areas. The high number of genes affected in the hippocampus implies that this brain area is more responsive to phenytoin than the frontal cortex. A similar discrepancy in the number of differentially expressed genes between the hippocampus and the frontal cortex has already been observed in rats following electroconvulsive seizures. 49 The differential responsiveness between the hippocampus and the frontal cortex corroborates the extreme heterogeneity of brain region wherein each area has a distinct functional role and gene expression pattern. 50,51 For example, it has been reported that the neutral sphingomyelin-specific phospholipase C (N-Sase) activity is significantly higher in the hippocampus than in the striatum and in the cortex, and age-related changes in the hippocampal N-Sase activities were profoundly higher than in the respective fractions isolated from the striatum and cortex. 52
Since most of the phenytoin-affected genes in the frontal cortex were of unknown function and both Pathway Express and Pathway Explorer identified just a few of them, we focus our discussion on phenytoin effects on gene expression in the hippocampus, a central limbic system brain region. Phenytoin-induced alterations in hippocampal gene expression suggest several modes of cellular changes that may be mediating its beneficial therapeutic mood-stabilizing effect.
Phenytoin up-regulates the expression of genes related to glutamate neurotransmission
Previous studies found altered expression of Gabra5 and Gad1 in mood disorders. mRNA levels of other GABA receptor subunits but not those of Gabra5 were found decreased in postmortem frontopolar cortex in depressed suicide victims. These subjects also lacked most intercorrelations between the levels of the studied subunits, differently from control subjects. 53 Two Gabra5 single-nucleotide polymorphisms have been associated with bipolar disorder. 54 Since these single-nucleotide polymorphisms are in proximity with an exon–intron boundary, they might affect the regulation of Gabra5 mRNA maturation.
A significant decrease of Gad1 mRNA levels has been observed in postmortem brains of bipolar patients, 55 and valproate has been shown to increase GABAergic neurotransmission by inducing Gad activity. 56
Glud1 catalyzes the interconversion between glutamate and alpha-ketoglutarate but synaptosomal Glud1's glutamate synthetic activity has been reported to be low 57 and has been suggested to increase when excessive glutamate degradation is required. 58 Glutamate conversion into alpha-ketoglutarate requires NAD + . NADH dehydrogenase which produces this co-factor was also up-regulated in the hippocampus following phenytoin treatment. It is possible that the concomitant up-regulation of Glud1 and NADH dehydrogenase results in increased glutamate degradation. Electroconvulsive treatment resulted in decreased rat hippocampal Glud1 activity and was interpreted to increase glutamate concentration leading to oxidative damage. 59
Both the GABAergic and the glutamatergic systems have been implicated in mood disorder pathogenesis. GABA is a central inhibitory neurotransmitter and several clinical studies suggest GABAergic dysfunction in mood disorders, as reviewed by Brambilla et al. 60 In the learned-helplessness rat model of depression, GABA release in the hippocampus decreased in parallel with the development of behavioral abnormalities and recovered following the administration of progabide, an antiepileptic GABA (A + B) receptor agonist. 61 Increased levels of glutamate, the central excitatory neurotransmitter, were found in postmortem dorsolateral prefrontal cortex of bipolar patients. 62
It is plausible to hypothesize that the up-regulation of Gabra5, Gad1 and Glud1 contributes to phenytoin's clinical mood-stabilizing effect by enhancing the GABAergic and dampening the glutamatergic systems in the hippocampus. It is also possible that these changes in gene expression are involved in phenytoin's antiepileptic mechanism. 63,64
The N-methyl-
NMDA receptors were also reported to be molecular targets of valproate. A single intraperitoneal dose of 200 mg/kg valproate to mice doubled the expression of Grin1 which encodes NR170 and prenatal exposure to valproate enhanced NMDA receptor-mediated transmission through the NR2 subunit and caused increased plasticity in the neocortex. 71 However, other studies of chronic administration of valproic acid or carbamazepine found reduced NMDA signalling in rat brain. 72,73
Phenytoin up-regulates the expression of genes involved in the Akt1, MAPK and GSH cascades
Akt1, Frap1 and Prkce
Akt1 (Pkb) activation leads to cell survival and proliferation. Akt1 activation requires phosphorylation on both its Ser473 and Thr308 residues. 74 The threonine residue is phosphorylated by the kinase Pdk1 75 and the serine residue is phosphorylated by the kinase Frap1. 76 Frap1 is activated upon DNA damage. 77 The phosphorylation of Akt1's ser473 by Frap1 is required for the recognition and activation of Akt1 by Pdk1. 78,79 Akt1 activity is also regulated by Prkce, a kinase widely distributed in the brain that plays a primary role in the regulation of pre- and postsynaptic neurotransmission. 80 Over-expression of Prkce has recently been suggested to activate an antiapoptotic pathway by inducing Akt1 via Frap1. 81 Taken together, up-regulation of Akt1, Frap1 and Prkce by phenytoin suggests that phenytoin may produce an antiapoptotic effect. This supposition is corroborated by findings of up-regulation of proapoptotic genes and glial–neuronal atrophy in bipolar patients. 82–87
Junb and Mapk10
Junb encodes the major component of the activator protein-1 (AP-1) complex. AP-1 is a homo/heterodimeric transcription factor constituting of proteins that belong to the Jun (c-Jun, Junb and Jund), Fos (c-Fos, Fosb, Fra-1 and Fra-2) and Atf (Atf2, Atf3 and Atf4) families. 88 The AP-1 complex plays a role in the control of cell proliferation, survival and death. 89 AP-1 activity is regulated by differential expression of AP-1 proteins, 90 e.g. c-Fos and c-Jun are growth promoting components of AP-1, whereas Junb is a negative regulator of cell proliferation. 91 Mapk10 promoted neuronal differentiation in response to Ngf by activating c-Jun. 92 Phenytoin-induced down-regulation of Junb expression and up-regulation of Mapk10 expression may contribute to a neuroprotective effect of the drug. The AP-1 complex has also been shown to be a molecular target for lithium and valproate and has been suggested to play a role in the long-term therapeutic efficacy of these mood stabilizers. 93,94
Gsr and Gclc
GSH, a tripeptide of cysteine, glutamate and glycine, is the brain cells' major antioxidant defender against free radicals generated by mitochondrial oxidation reactions. Gsr and Gclc participate in GSH synthesis. Gsr reduces oxidized glutathione (GSSG) to GSH and Gclc catalyzes the production of the peptide bond between glutamate and cysteine to form γ-glutamylcysteine, which subsequently reacts with glycine to form GSH by GSH synthetase. Upregulation of Gsr and Gclc by phenytoin may increase hippocampal GSH levels and enhance hippocampal cell protection against oxidative damage. Interestingly, mitochondrial dysfunction and downregulation of antioxidant genes have been observed in bipolar disorder 83,95 and lithium and valproate have recently been reported to inhibit H2O2-induced cell death in rat cortical cells by increasing GSH and Gclc levels. 96
Taken together, previous reports 97,98 and the present data suggest that phenytoin might exert a neuroprotective effect by up-regulating genes that promote cell survival and genes with antioxidant effects. A neuroprotective effect has also been described for the mood stabilizers lithium and valproate. 97,99,100 Since postmortem neuropathological studies reveal both neuron and glial cell loss in bipolar patients, it has been hypothesized that neuroprotection might be a way by which mood stabilizers exert their therapeutic effect. 82,84–87
Phenytoin up-regulates the expression of inositol-monophosphatase 1
Inositol-monophosphatase 1 (Impa1) encodes the inositol-monophosphatase (IMPase) 1 enzyme, a key enzyme in the PI signalling pathway. The enzyme produces intracellular free inositol in the following two ways: (1) in the recycling process from the signalling precursor phosphatidylinositol biphosphate (PIP2) and the second messenger inositol triphosphate (IP3) and (2) in the de novo synthesis from glucose-6-phosphate which is first converted to myo-inositol-1-phosphate (MIP) by the enzyme MIP synthase. MIP is then dephosphorylated to inositol by IMPase. IMPase1 is lithium-inhibitable at therapeutically relevant concentrations. 101,102 Impa1 has been reported to be both down- and up-regulated by lithium. 103 Down-regulation of IMPase1 has recently been associated with autophagy induction, 104 which has been proposed to play a protective role against neurodegeneration in Huntington's disease, 105 Parkinson's disease 106 and amyotrophic lateral sclerosis. 107 Chronic lithium administration increased Impa1 mRNA levels in mouse hippocampus 108 and protein levels and activity in rat hippocampus, 109 effects possibly involved in the molecular cascade of events by which lithium produces a therapeutic response in bipolar disorder. Inositol administration has been reported to produce therapeutic benefit in bipolar disorder, 110 depression, 111 panic disorder 112 and obsessive–compulsive disorder 113 and induces psychoactive changes in animal models. 114 It is possible that phenytoin's beneficial effect in bipolar disorder 13–15 is also mediated by Impa1 up-regulation, resulting in increased intracellular inositol levels.
Phenytoin up-regulates the expression of genes coding for Ras associated proteins
Rab5a and Rab11b
The Rab5a and Rab11b genes encode Rab GTPases. Rab proteins, by switching from a GTP-bound active conformation to a GDP-bound inactive conformation, play a central role in vesicle budding, motility and fusion. 115 In particular, Rab5 proteins participate in endocytosis and axonal retrograde transport and Rab11 proteins participate in polarized neurite growth. 116
Rasa2
The Rasa2 gene encodes the GTPase-activating protein, Gap1m. GTPase-activating proteins (Gaps) control the switch of Rab proteins from GTP- to GDP-bound states resulting in Rab inactivation due to intrinsic GTP hydrolysis. 117
Ap1s1
The Ap1s1 gene encodes the sigma 1 subunit of clathrin-associated AP-1 that affects membrane trafficking since it is involved in transport among organelles, such as the trans-Golgi network, the endosome, the lysosome and the plasma membrane. 118 Interestingly, a genetic screen for valproate-hypersensitive yeast revealed mutations in genes affecting membrane trafficking including genes encoding Rab family proteins and clathrin-associated Ap-1. 119
Phenytoin up-regulates the expression of glial fibrillary acidic protein (Gfap), adenylate cyclase-associated protein 1 (Cap1) and prodynorphin (Pdyn)
Gfap
Reduced Gfap mRNA levels were reported in postmortem brain of bipolar patients and in an animal model of mood bipolarity. 70,120 Millar et al. 121 hypothesized that alterations in actin-associated proteins are involved in the etiology of mood disorders.
Cap1
Cap1 plays a role in actin turnover and its expression has been found to be down-regulated in a mouse strain prone to depression. 122 Cap1 up-regulation by phenytoin but not by the antidepressant tricyclics (TCA) or selective serotonin transporter inhibitors 122 may suggest that Cap1 is a novel target for mood stabilization.
Pdyn
Pdyn mRNA levels were reported to be reduced in the amygdala of subjects with bipolar disorder. 123
A central limitation of this study is the relatively small number of analyzed samples. However, we adopted a solid statistical analysis, with a cross-informatics validation approach, to control for potential spurious data. LIMMA was used as the principal method of analysis since it performs well in experiments with a low sample number, as it calculates gene variance with an effective empirical Bayes framework. 124 LIMMA was flanked by SAM, a statistical method able to compensate the small data-set by iterative calculations. Finally, MAANOVA analysis was performed to reduce the intrinsic variability of the microarray methodology. The joint use of these three statistical approaches allowed the generation of robust results despite the low sample number in each group. RT-qPCR measurements of genes emerging from the microarray data confirmed the differential expression of 10 out of 11 genes.
Results from DNA microarray studies, like those obtained in the present study, can determine which genes are differentially transcribed between distinct groups or conditions, but they do not provide any information about whether the transcriptional changes result in functional ones. Thus, further levels of data validation, including investigation of their translational significance by Western blots and of their functional significance by antisense experiments, are warranted to better understand the implications of the current results.
In summary, we found that phenytoin may regulate genes involved in mood disorders and their treatment (Table 2). It is well established that multiple molecular effects of antidepressants overlap with the effects of mood stabilizers and that some of the mood stabilizers, including lithium, exhibit antidepressant effects both in patients and in animal models. It is, therefore plausible that phenytoin shares this characteristic. Phenytoin affected the expression of genes involved in the GABAergic and glutamatergic neurotransmission, implicated in mood disorder pathophysiology and genes which exert neuroprotection. Some of the phenytoin-induced differentially expressed genes are supposed targets for classical mood stabilizers. Others, e.g. Frap1, Gsr, Gfap, Pdyn and Cap1, may open new insights into the mechanism of mood stabilization and the pathophysiology of bipolar disorder.
Summary of discussed genes regulated by phenytoin
The potential meaning of these genes in the regulation of mood may be explored by pharmacological-behavioral studies of mice in which these genes are knocked-out or over-expressed, using animal models of depression, such as the Porsolt forced-swim test 125 and the amphetamine-induced hyperactivity model of mania. 126
Footnotes
Acknowledgements
The study was supported by a grant from the IRIS Foundation (Castagneto Carducci, LI and Florence) to SP and by a Dreyfus Health Foundation research grant to GA. GA is the incumbent of the Jack Dreyfus Chair in Psychiatry (Unit of Phenytoin Research).