




Abstract
We compared the ability of pure lycopene (Lyco) versus lycopene phytocomplex (LycoC) to induce apoptosis in vitro. We found that LycoC, but not Lyco, was able to trigger apoptosis in HL60 cells, as documented by subdiploid DNA content and phosphatidylserine exposure. LycoC-induced apoptosis was associated with reactive oxygen species (ROS) generation and loss of mitochondrial transmembrane potential, suggesting that LycoC triggered apoptosis via a mitochondrial pathway. We also verified the redox state of cells by measuring glutathione (GSH) content, but only a small percentage of cells showed GSH depletion, suggesting that the loss of GSH may be a secondary consequence of ROS generation. Moreover, LycoC pretreatment effectively increased apoptosis induced by photodynamic therapy (PDT), a mode of cancer treatment using a photosensitizer and visible light. LycoC pretreatment was even more potent in improving PDT than pretreatment with ascorbic acid or alpha-tocopherol (or the two combined). Our results demonstrate that LycoC has a stronger cytotoxic effect than Lyco and is a better source of agents able to trigger apoptosis in HL60 cells and improve the efficacy of PDT in vitro.
Introduction
Clinical studies demonstrate that diets rich in carotenoids are associated with a diminished risk of cancer. Fruits and vegetables are known to interfere with cancer cell proliferation, inhibit growth factor signalling pathways and inhibit NF-κB, AP-1 and JAK-STAT activation pathways. 1 Particularly important among all the mechanisms proposed in vitro is the ability of these natural products to modulate the apoptotic response in cell culture models. Proapoptotic compounds probably protect against cancer by enhancing the elimination of initiated precancerous cells. 2
Apoptosis is a morphological type of cell death under very tight genetic control, and an evolutionarily conserved molecular mechanism. Lack of apoptosis can lead to several pathologies, such as cancer. 3 The features of apoptosis are modulated by proteases known as caspases, whose activation during apoptosis leads to phosphatidylserine (PS) exposure and DNA laddering, the biochemical markers of apoptosis. 4 Mitochondria also play a crucial role in apoptosis: the opening of megachannels leads to the release of cytochrome c, directly activating caspase-9, which in turn activates caspase-3, the effector caspase. Mitochondrial failure could generate reactive oxygen species (ROS), but mitochondria themselves could also be the target of ROS: in both cases, ROS are involved in signal transduction leading to apoptosis.
Carotenoids, especially lycopene, are suitable candidates for therapeutic uses thanks to their ability to modulate the apoptotic machinery. Lycopene is an acyclic carotene, also known as ψ,ψ-carotene; it is the major carotenoid in tomatoes and other Mediterranean products, and it is also the main carotenoid consumed by Western populations. 5
Lycopene inhibits the growth and differentiation of cancerous cells via modulation of cell cycle regulatory proteins and delayed cell growth, 6 modulation of the IGF-1/IGFBP-3 system, 7 up-regulation of tumor suppressor protein Cx43, 8 increase of gap junction intercellular communication in human skin fibroblast and in KB-1 human oral cancer cells, 9,10 modulation of redox signalling, 11 prevention of oxidative DNA damage and modulation of carcinogen modulation enzyme. 12
It has been reported that lycopene can alternatively behave as an antioxidant or as a pro-oxidant depending on its redox potential and the cellular environment. 13 At high concentrations, carotenoids acted as a proapoptotic agent in different cell lines and this effect was accompanied by increased production of ROS. 14,15 Moreover, Zhang et al. 16 clearly showed that an oxidized mixture of lycopene triggered apoptosis in HL60 cells.
We investigated whether purified lycopene is per se responsible for the induction of apoptosis in HL60 cells or instead whether the phytomixture, more close to what one would assume in the diet, plays a major role. We used purified lycopene (Lyco) and lycopene phytocomplex (LycoC) commercialized at 6% pure lycopene and used as a dietary supplement. We monitored the ROS production and mitochondrial change 24 h after treatment with both purified lycopene and the phytocomplex mixture, as well as the induction of apoptosis, as shown by subdiploid DNA content and PS exposure. We also measured the glutathione (GSH) content of cells after incubation with lycopene in order to determine their redox state.
Recent reports indicate that some safe, non-toxic cancer chemopreventive phytochemicals can function as sensitizers, augmenting the effectiveness of cancer chemotherapy and radiotherapy, 17,18 and that lycopene has been used successfully in association with anticancer surgery-based therapies. 8 Our group has a long-term interest in cancer therapy, in particular photodynamic therapy (PDT), a well-established treatment for malignancies using suitable red light and a photosensitizer, whose molecular mechanism in HL60 cells has been elucidated by our group. 19,20 We wanted to link the use of antioxidants to a cancer therapy, and more importantly we wanted to determine whether we can see any synergistic effect due to the combination of the two treatments. Therefore, we investigated in vitro the ability of both purified lycopene and the phytocomplex mixture to increase apoptosis after PDT with Purpurin-18.
Materials and methods
Cells and reagents
HL60 cells were kindly provided by Prof Marcella Cintorino, Policlinico Le Scotte, University of Siena. RPMI medium, tetrahydrofuran (THF), dimethylsulfoxide (DMSO), pure lycopene (Lyco), 2′,7′-dichlorofluorescein diacetate (DCFH-DA), propidium iodide (PI), rhodamine123 (Rhod123), trypan blue, RNAse type IA, antibiotics and glutamine were obtained from Sigma-Aldrich (Milan, Italy); foetal calf serum (FCS) from Gibco (Milan, Italy); and lycopene phytocomplex (LycoC), alpha-tocopherol and ascorbic acid (AA) were supplied by Polichimica (Bologna, Italy).
LycoC is a commercial product sold as a dietary supplement. It contains 6% wt/wt of pure lycopene as the active compound. Being a dry extract of tomatoes (Lycopersicum esculentum Mil.), it also contains other natural tomato phytonutrients (such as tocopherols, phytoene, phytofluene, beta-carotene, phospholipids and phytosterols) with the addition of maltodextrin as adjuvant.
For our experiments, Lyco and LycoC were dissolved in THF (HPLC reagent; Sigma-Aldrich) as stock 5 mmol/L solutions and stored at −80°C.
Cell treatment
HL60 cells were grown in RPMI medium containing 10% FCS, 2 mmol/L glutamine, 100 U/mL penicillin G and 100 μg/mL streptomycin, at 37°C in a controlled humidified incubator in 5% CO2. The cells were used between the 5th and 20th passage.
HL60 cells were seeded in 24-well plates at a concentration of 5 × 10⁵ cells/mL per well, and used as such (negative control), with the addition of increasing concentrations of THF (0.02–0.5% v/v), and of Lyco and LycoC both at increasing concentrations (1–25 μmol/L). Immediately before each experiment, aliquots of stock solutions were added to cell culture media under careful stirring to obtain a homogeneous dispersion of the chemicals used.
For the experiments with PDT, the cells at 5 × 10⁵/mL were incubated in the dark with 0.5 μmol/L Purpurin-18 (Pu-18) overnight. After incubation, the cells were collected by centrifugation, resuspended in fresh medium at 1 × 10⁶/mL, exposed to 1 J/cm2 of red light and maintained in Petri dishes at 37°C until further analysis. Irradiation was carried out at room temperature with a 150 W halogen lamp using a broad spectrum 600–700 nm filter. Pu-18 was dissolved in DMSO as a 20 mmol/L stock solution and stored at −20°C. Working solutions were prepared in culture medium immediately before use. Cells treated with vehicle (DMSO) only and light served as controls. The final DMSO concentration never exceeded 0.1%.
HL60 cells were incubated for 2 h with 10 μmol/L Lyco and LycoC, 100 μmol/L AA and 100 μmol/L alpha-tocopherol and then irradiated as described above.
Cytotoxicity and cell viability
In the preliminary study, the cytotoxic effect of different concentrations of Lyco and LycoC was estimated by the trypan blue dye exclusion assay. Briefly, the assay consists of diluting 1:2 an aliquot of cell suspension with trypan blue (50 μmol/L) and then counting the cells by microscopy. As the presence of trypan blue-positive cells was clearly associated with cytotoxicity, we counted trypan blue positive and negative cells in order to quantify cell viability. Viability was determined with the formula: % viability = (no. live cells)/(no. live cells + no. dead cells) × 100. All the cytotoxicity and cell viability assays were performed in triplicate.
Measurement of cellular DNA content
To determine the percentage of apoptotic cells by analysis of DNA content, we used the simple flow cytometric method described by Nicoletti et al. 21 At different times after treatment, 1 × 10⁶ cells per sample were washed in phosphate buffer saline (PBS) 1× and the pellet was fixed overnight in ice-cold ethanol 70% at −20°C. The cell suspension was then centrifuged, washed twice with 1 mL of PBS and resuspended in 1 mL of a PBS solution containing RNAse (Type I-A, 1 mg/mL final concentration) and PI (50 μg/mL final concentration). The tubes were placed on ice in the dark until the cellular red fluorescence of PI was collected in a linear scale using a FACSCalibur flow cytometer (Becton Dickinson, Mountain View, CA, USA) equipped with an excitation laser line at 488 nm and a 575 ± 15 nm band pass filter. At least 20,000 events were collected for each sample using Cell Quest software (Becton Dickinson) and the pulse processing module for doublet discrimination; debris was excluded from the analysis by an appropriate morphological gate of forward scatter (FSC) versus side scatter (SSC).
Measurement of PS expression using fluorescein (FITC)-labelled Annexin V
Annexin V (AnnxV) binding and PI uptake were assessed by flow cytometry using a commercial kit (Boehringer Ingelheim Bioproducts, Vienna, Austria) according to the manufacturer's instructions. Briefly, at different times of incubation after treatment, approximately 2.5 × 10⁵ cells per sample were washed twice in PBS and the pellet was resuspended in 200 μL of the binding buffer provided in the kit. Five microliters of the AnnxV-FITC kit stock solution were added to the cell suspension (1 μg/mL final concentration) and incubated for 10 min at room temperature in the dark. Then, the cells were washed in PBS and resuspended in 190 μL of binding buffer plus 10 μL of the PI stock solution (1 μg/mL final concentration). The cells were immediately analyzed with a FACSCalibur flow cytometer (Becton Dickinson) equipped with an excitation laser line at 488 nm and Cell Quest software (Becton Dickinson). The AnnxV-FITC (green fluorescence) and the PI (red fluorescence) were both collected in a log scale through a 530 ± 20 and 575 ± 15 nm band pass filter, respectively. 19
Evaluation of transmembrane potential using double staining with Rhod123 and PI
Mitochondrial transmembrane potential was assessed by flow cytometry uptake of the cationic lipophilic dye Rhod123, according to the method described by Gorczyca et al. 22 Briefly, at different times of incubation after treatment, approximately 5 × 10⁵ cells for each sample were washed twice in PBS and the pellet was resuspended in 500 μL of PBS. Four microliters of the Rhod123 stock solution were added to the cell suspension (1 μg/mL final concentration) and incubated for 30 min at 37°C in the dark. The cells were then washed in PBS and resuspended in 200 μL of binding buffer plus 10 μL of the PI stock solution (10 μg/mL final concentration). The cells, kept in ice, were analyzed with a FACSCalibur flow cytometer (Becton Dickinson) equipped with an excitation laser line at 488 nm and Cell Quest software (Becton Dickinson). The Rhod123 (green fluorescence) and the PI (red fluorescence) were both collected in a log scale through a 530 ± 20 and 575 ± 15 nm band pass filter, respectively.
Evaluation of ROS production
The formation of intracellular ROS was measured using 2′,7′-dichlorofluorescein diacetate (DCFH-DA). By this method, it is possible to measure the amount of H2O2 generated by increased oxidative metabolism. Viable cells can deacetylate DCFH-DA to 2′,7′-dichlorofluorescein (DCF), which is not fluorescent but can react quantitatively with oxygen species within the cell to produce DCF, which is fluorescent and is trapped inside the cell. The cytofluorimetric measurement of the DCF produced can provide an index of intracellular oxidation. 23 The cells were incubated for 30 min with DCFH-DA (100 μmol/L final concentration). After incubation, the cells were washed with PBS, resuspended in fresh medium and treated with different concentrations of LycoC and Lyco (1–25 μmol/L). The intensity of fluorescence was measured. The cells, kept in ice, were analyzed with a FACSCalibur flow cytometer (Becton Dickinson) equipped with an excitation laser line at 488 nm and Cell Quest software (Becton Dickinson). The DCF (green fluorescence) was collected in a log scale through a 530 ± 20 band pass filter. Monoparametric histograms of the fluorescence distribution were plotted for the estimation of ROS production.
GSH content
GSH content was evaluated using o-phthaldialdehyde (OPT) (Sigma-Aldrich) as described by Treumer and Valet. 24 Briefly, the OPT method is based on reaction with both GSH amino- and sulfhydryl groups, yielding a cyclic highly fluorescent product. The OPT-GSH fluorescent product appears in the green fluorescence channel. For staining, 1 × 10⁶ cells were resuspended in 500 μL HEPES N-[2-hydroxyethyl]piperazine-N′-[2-ethanesulfonic acid]-buffered saline pH 7.4 and OPT was added (final concentration 1 mmol/L of a stock solution 0.1 mol/L in dimethylformamide). After 5 min of incubation at room temperature, the suspension was immediately washed and the cells were analyzed with a FACSCalibur. The OPT-GSH (green fluorescence) was collected in a log scale through a 530 ± 20 band pass filter. Monoparametric histograms of the fluorescence distribution were plotted for the estimation of GSH content.
Statistical analysis
The results are presented as mean ± standard deviation (SD) from at least three to five independent experiments. Statistical analysis was performed using commercially available software (GraphPad Prism 4.0, GraphPad Software). Data were analyzed by Student's t-test. The designed level of significance was P < 0.05.
Results
Effects of pure lycopene and lycopene extract on the HL60 cell cycle
In the first series of experiments, we used the trypan blue test to evaluate the trend of cell cytotoxicity due to, respectively, vehicle alone, Lyco and LycoC in order to decide the best time point for further investigations.
To allow the uptake of both lycopenes we considered 24 h after treatment the more appropriate time to start our experiments. In fact, 24 h after treatment with LycoC an appreciable decrease in cell viability was already visible (Figure 1). At 24, 48 and 72 h, vehicle alone and Lyco did not show any effect on cell viability.
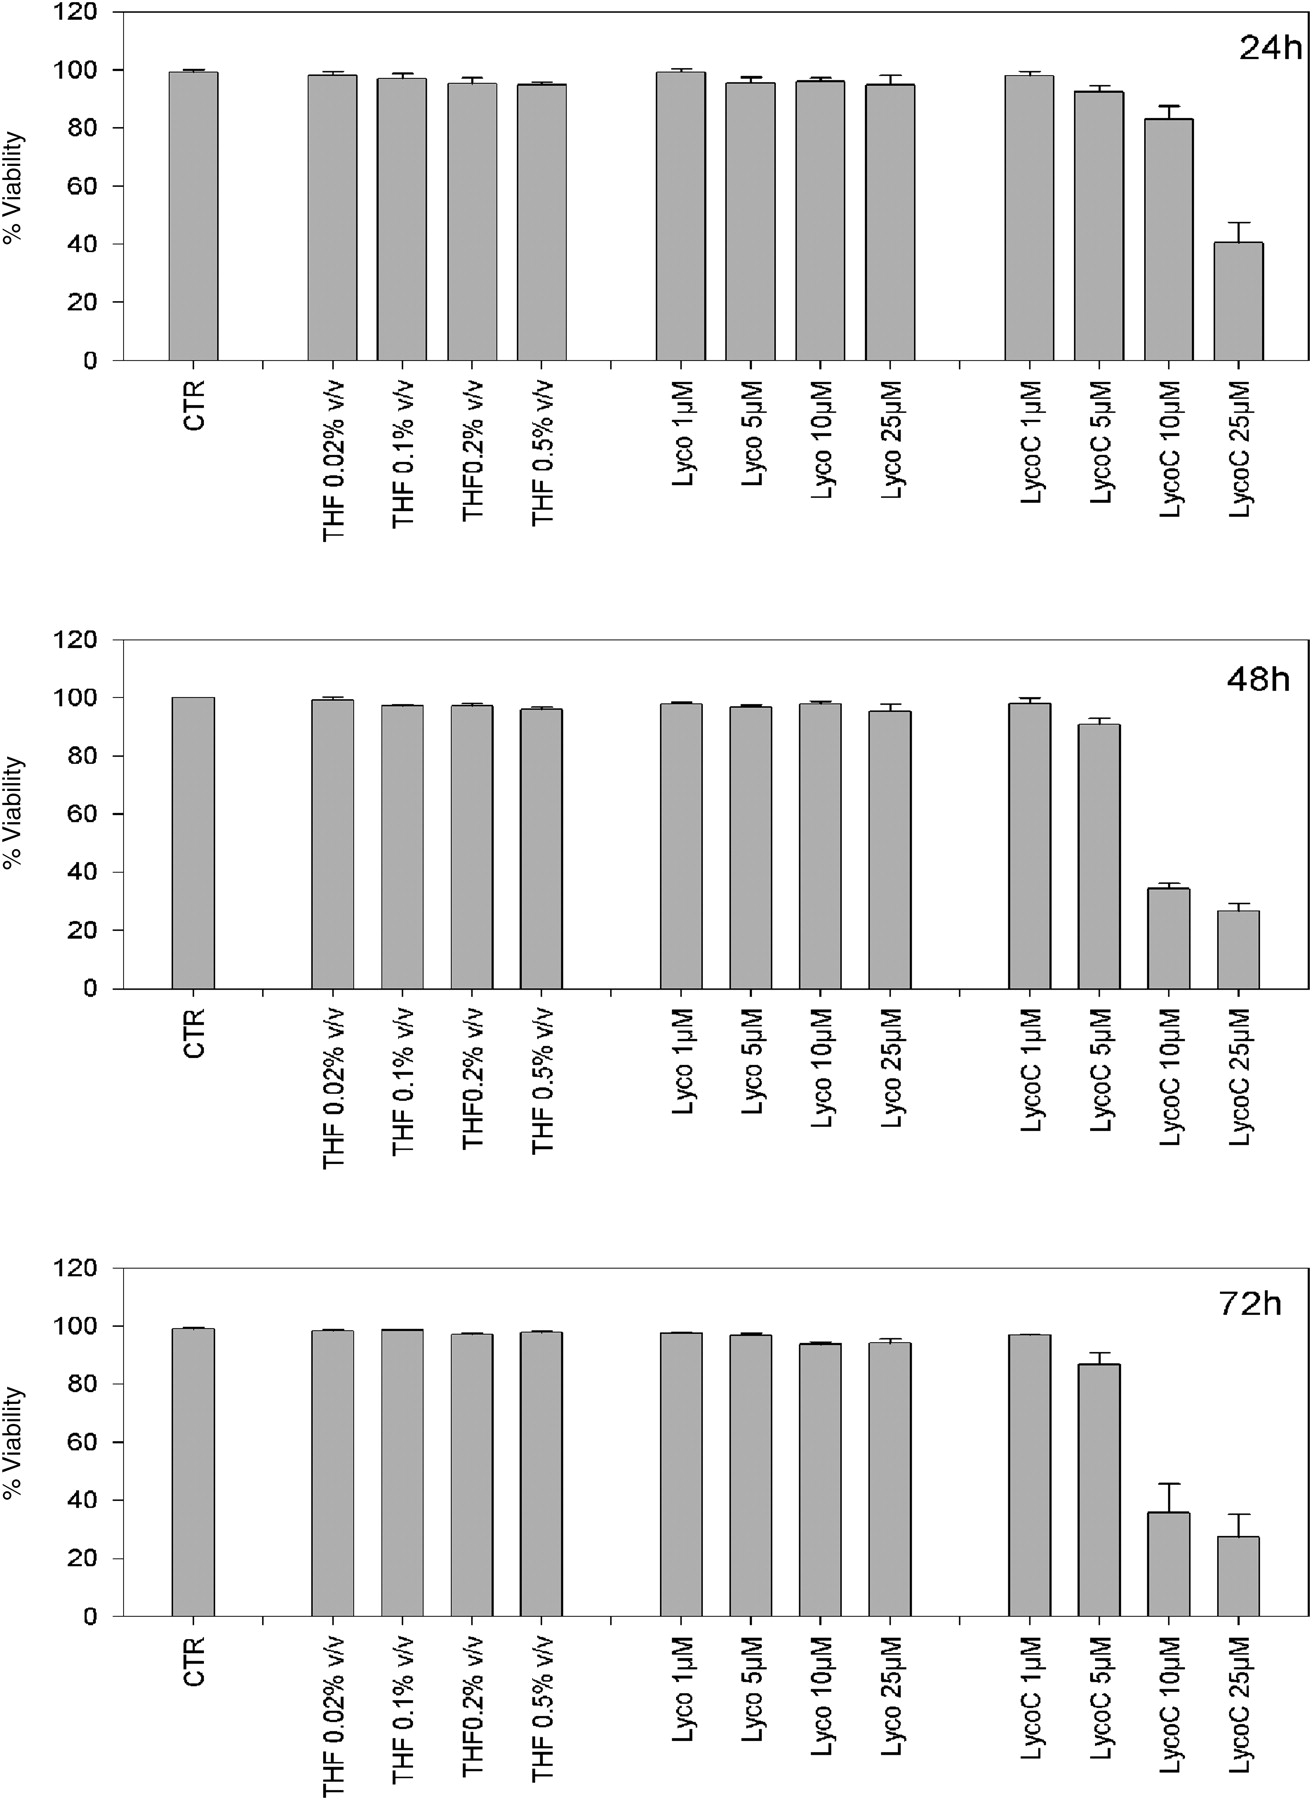
Cell viability of HL60 cells monitored between 24 and 72 h after exposure to increasing concentrations of lycopene (Lyco) and lycopene phytocomplex (LycoC) (1–25 μmol/L). Cells were incubated with pure Lyco and LycoC at 37°C. Cell viability was evaluated at 24, 48 and 72 h by the trypan blue dye exclusion assay. Values are expressed as percentage ± SD (mean of three separate experiments)
An increasing proportion of trypan blue-positive HL60 cells was observed after incubation with the higher doses of LycoC (10–25 μmol/L). The lower LycoC doses (1–5 μmol/L) and all doses of Lyco had no effect on cell viability (nor did THF alone; Figure 1).
Subsequently, we evaluated the appearance of subdiploid DNA content in the cell cycle to analyze the ability of Lyco and LycoC to induce apoptosis. Treatment of HL60 cells for 24 h with increasing concentrations of LycoC (1–25 μmol/L) generated a cell population with a subdiploid DNA peak due to apoptotic cells. The appearance of a population with fragmented DNA was accompanied by a change in the HL60 cell cycle. In cells treated with LycoC at final concentrations of 5 and 10 μmol/L, the G0/G1 and G2/M phases were decreased and a modest sub-G0/G1 peak became visible; the highest concentration (25 μmol/L) produced a clear hypodiploid DNA content and an alteration of the cell cycle in which the G2/M phase was barely recognizable (Figure 2c). Moreover, the percentage of cells treated with 5, 10 and 25 μmol/L LycoC showed a DNA subdiploid content statistically significant with respect to THF-treated cells. No evidence of subdiploid DNA was found in the controls exposed to vehicle alone or in cells treated with Lyco; indeed, the cell cycle profiles seemed to mirror each other (Figure 2a and b). Cells treated with Lyco showed no modification of cell cycle features at any of the concentrations; there was only a moderate decrease in the G0/G1 phase at the highest concentration (25 μmol/L) due to the solvent more than the treatment per se (Figure 2a, b and d).
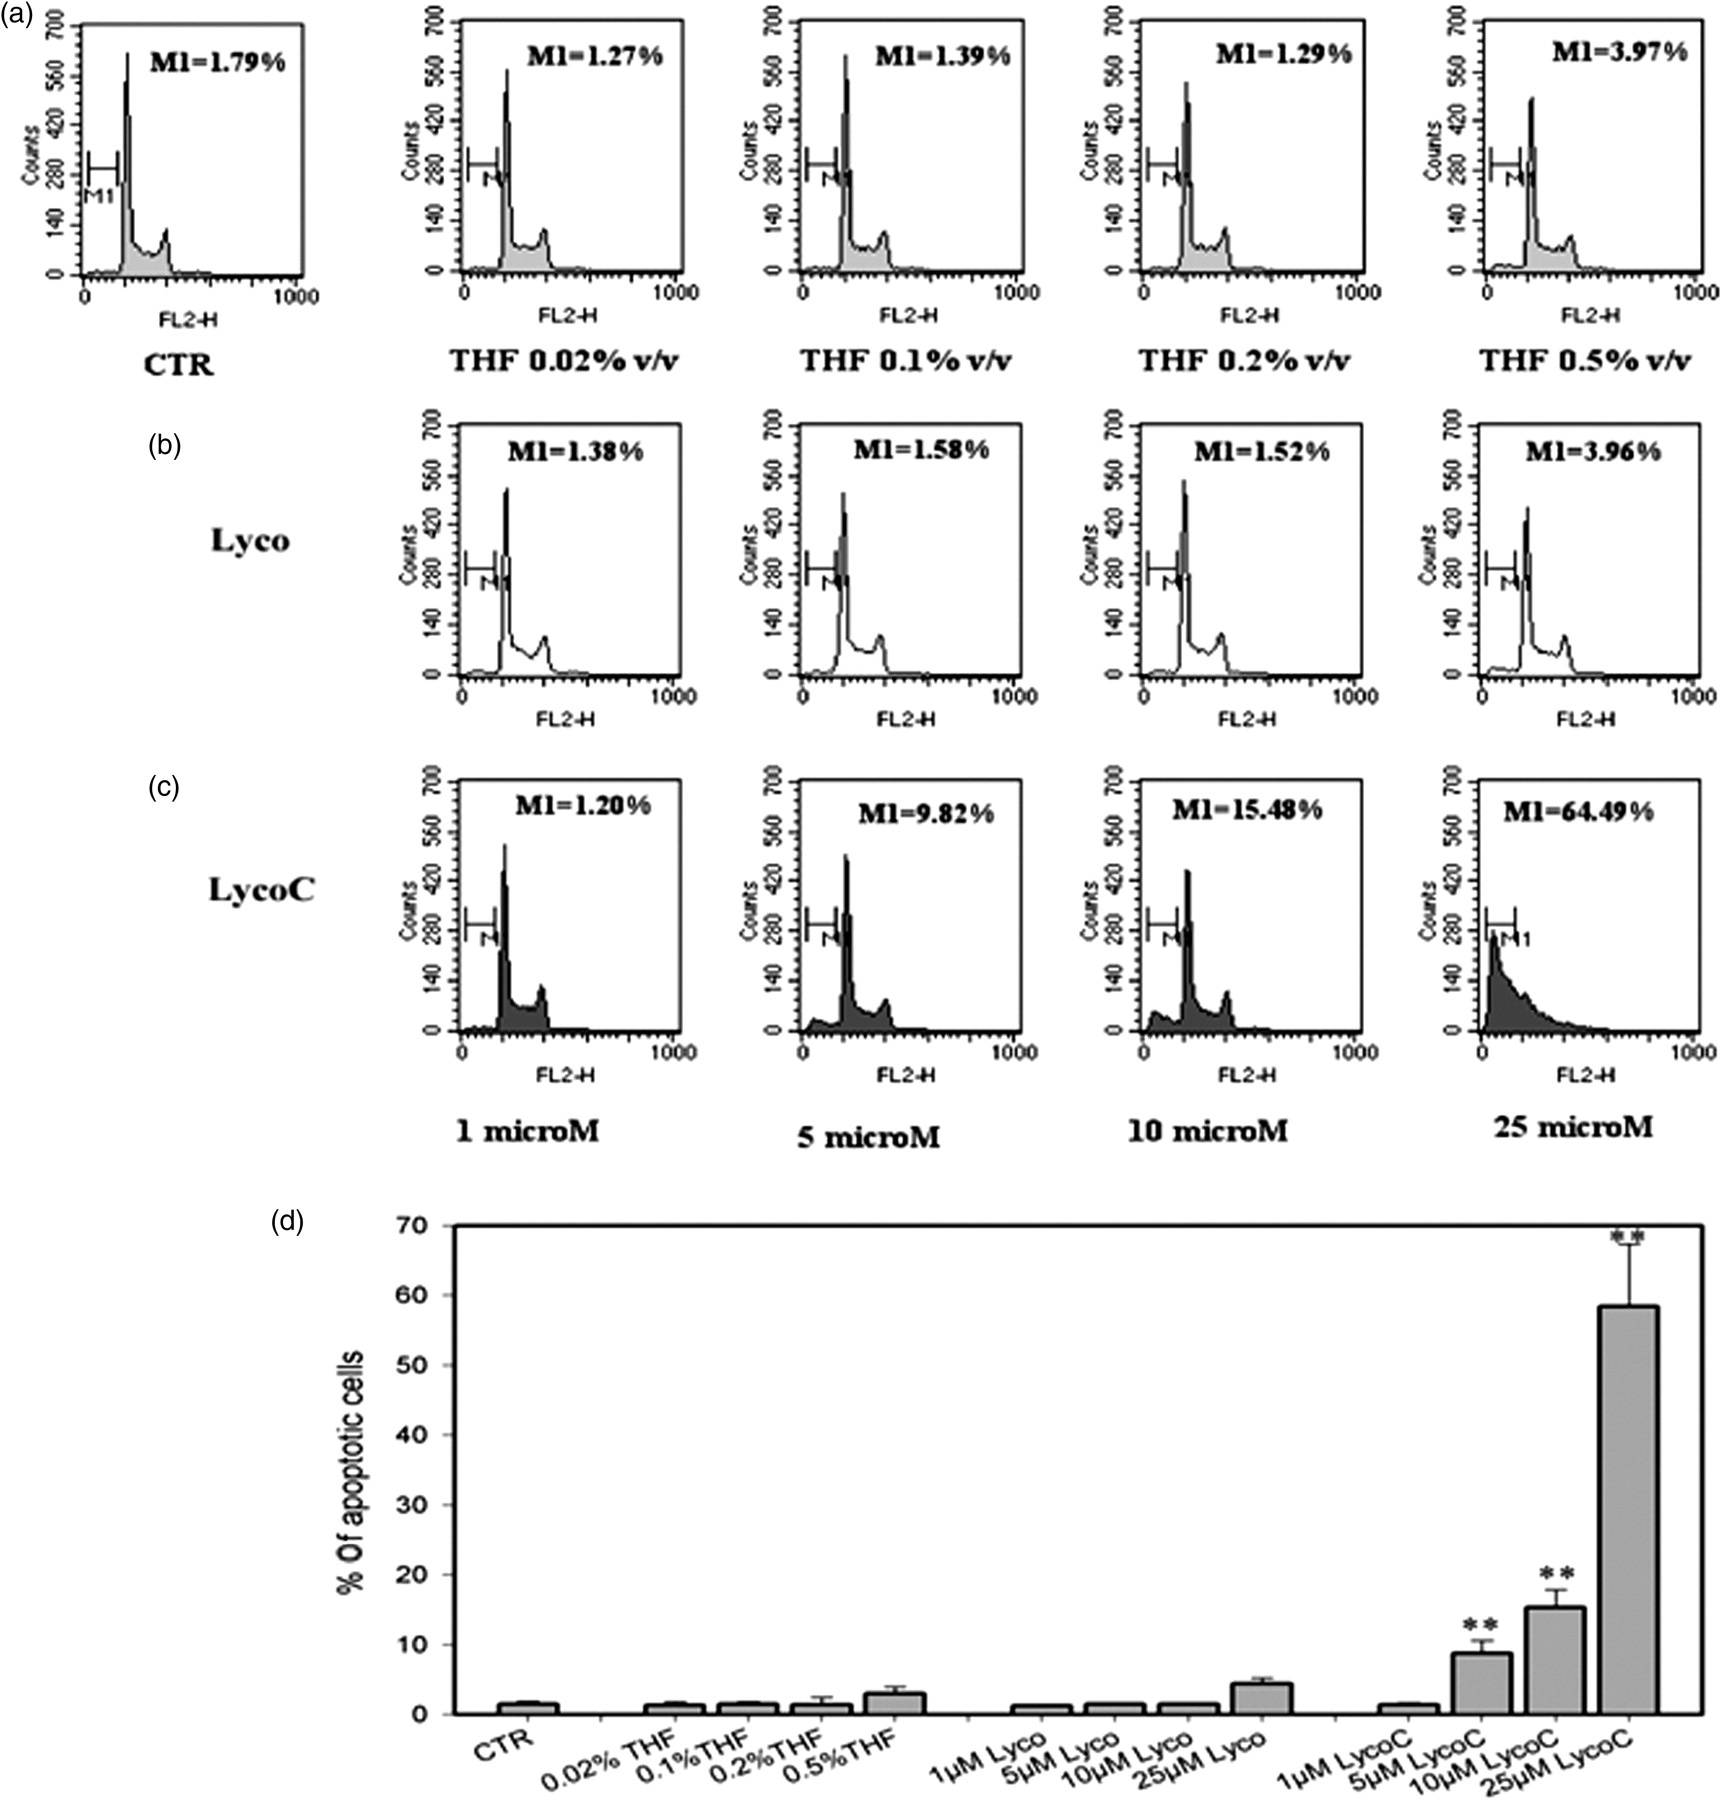
Flow cytometric analysis of DNA content of propidium iodide (PI)-stained HL60 cells at 24 h after treatment with increasing concentrations of lycopene (Lyco) and lycopene phytocomplex (LycoC) (1–25 μmol/L). The percentage of apoptotic cells was quantified as the accumulation of PI-stained cells in the sub-G0/G1 DNA histogram region. (a–c) Results of a typical experiment, where the percentage of cells containing subdiploid DNA is indicated as M1 in each histogram. Panel D reports the percentages ± SD of cells containing subdiploid DNA (n = 3). *P < 0.05, **P < 0.001 with respect to tetrahydrofuran (THF)-treated cells (Student's t-test)
Measurement of PS exposure in HL60 cells treated with pure lycopene and LycoC
To further confirm cell death by apoptosis in HL60 cells treated with LycoC, we evaluated the PS exposure on the external side of the plasma membrane 24 h after treatment. As shown in Figure 3a and d, control cells treated with the highest vehicle concentration (0.5% v/v) had a rather high percentage of AnnxV-positive cells (23.28 ± 7.22%), mostly late apoptotic/necrotic cells as indicated by the appearance of a population with very bright AnnxV staining. The percentage of AnnxV-positive cells dramatically increased (ca. three-fold) in cells treated with 25 μmol/L LycoC (76.06 ± 8.09%) but only slightly (29.98 ± 2.67%) when 10 μmol/L LycoC was added to HL60 cells (Figure 3c and d). Cells treated with Lyco showed modest PS exposure, even lower than the cells treated with THF, since Lyco used at the highest concentration seems to reverse the moderate cytotoxic effect due to the solvent even though this is not statistically significant (Figure 3b and d).

Flow cytometric analysis of phosphatidylserine (PS) externalization in HL60 cells treated with lycopene (Lyco) and lycopene phytocomplex (LycoC). Cells were stained with FITC-AnnxV and propidium iodide (PI) at 24 h after treatment with increasing concentrations of Lyco and LycoC (1–25 μmol/L). (a–c) Results of a typical experiment, where externalization of PS was quantified as percentage of cells with increased AnnxV fluorescence (highlighted by the marker). The x axis shows log FL-1 fluorescence intensity; the y axis indicates the cell number. Panel D reports the percentages ± SD of AnnxV-positive cells (n = 5). *P < 0.05, **P < 0.001 with respect to tetrahydrofuran (THF)-treated cells (Student's t-test)
Loss of mitochondrial transmembrane potential in HL60 cells treated with pure lycopene and LycoC
One of the biochemical events in the apoptotic process is variation of mitochondrial transmembrane potential (ΔΨm). We used Rhod123 to monitor ΔΨm: Rhod123 is readily incorporated into the mitochondria in a manner dependent on ΔΨm. Untreated and treated cells were loaded with Rhod123; the fluorescence intensity was then analyzed by flow cytometry and plotted as a fluorescence histogram. At 24 h after treatment with LycoC, there was a significant decrease of Rhod123 fluorescence at final concentrations of 5, 10 and 25 μmol/L. The percentage of cells showing a decrease of Rhod123 uptake was similar to the percentage of cells with PS exposure on the cell membrane (Figure 4c and d). Cells treated with Lyco showed no remarkable alteration of mitochondria (Figure 4a, b and d).

Flow cytometric analysis of mitochondrial transmembrane potential in HL60 cells 24 h after treatment with different concentrations of lycopene (Lyco) and lycopene phytocomplex (LycoC) (1–25 μmol/L). The cells were loaded for 30 min with Rhod123 and the fluorescence intensity was determined by flow cytometry. (a–c) Results of a typical experiment, where decreased fluorescence (highlighted by the marker) indicates reduction of mitochondrial transmembrane potential (ΔΨm). The x axis shows log FL-1 fluorescence intensity; the y axis indicates the cell number. Panel D reports the percentages ± SD of cells with decreased ΔΨm (n = 3). *P < 0.05, **P < 0.001 with respect to tetrahydrofuran (THF)-treated cells (Student's t-test)
ROS generation in HL60 cells treated with pure lycopene and lycopene extract
The involvement of ROS production in lycopene-induced cell death was evaluated as an increase in DCF fluorescence. After 24 h of incubation, ROS production in LycoC-treated cells showed a dose-related response, increasing significantly from 5 to 25 μmol/L. HL60 cells treated with Lyco showed no ROS production and a decrease in DCF fluorescence, even with respect to THF-treated cells (Figure 5).
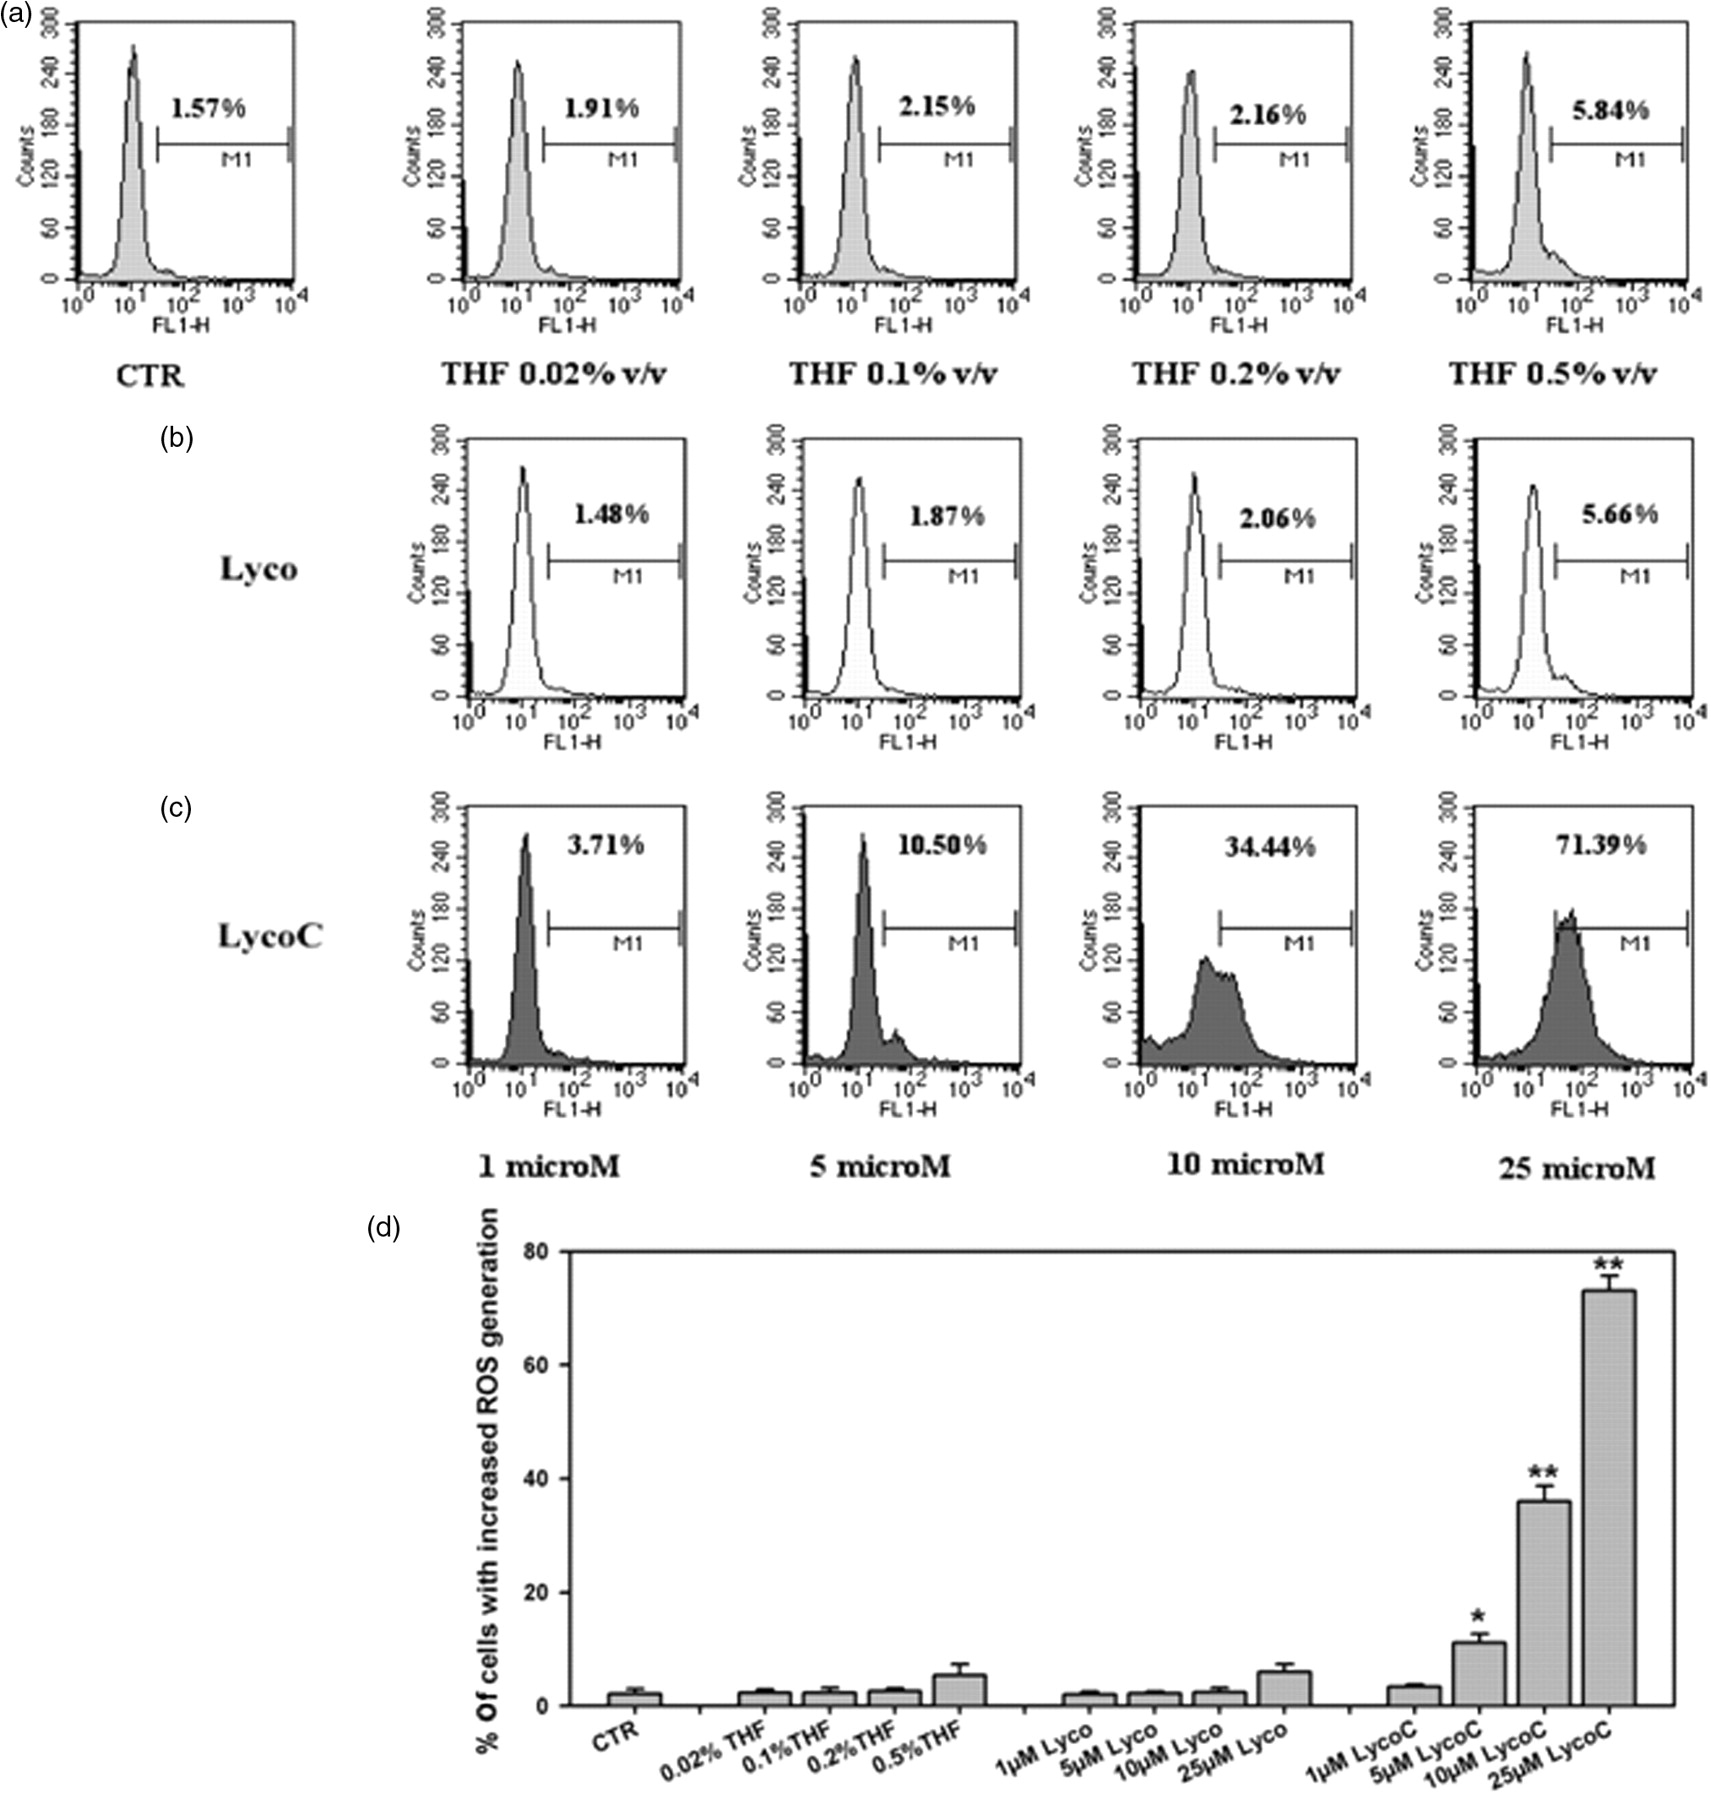
Flow cytometric analysis of reactive oxygen species (ROS) generation in HL60 cells 24 h after exposure to increasing concentrations of lycopene (Lyco) and lycopene phytocomplex (LycoC) (1–25 μmol/L). HL60 cells were incubated for 30 min with 2′,7′-dichlorofluorescein diacetate, then washed and resuspended in fresh medium and treated with different concentrations of Lyco and LycoC (1–25 μmol/L). At 24 h after treatment, the fluorescence intensity was determined by flow cytometry. (a–c) Results of a typical experiment, where ROS production was quantified as percentage of cells with increased fluorescence (highlighted by the marker). The x axis shows log FL-1 fluorescence intensity; the y axis indicates the cell number. Panel D reports the percentages ± SD of cells with increased ROS production (n = 4). *P < 0.05, **P < 0.001 with respect to tetrahydrofuran (THF)-treated cells (Student's t-test)
GSH content in HL60 cells treated with pure lycopene and lycopene extract
GSH, an intracellular antioxidant defence, is the principal detoxifying system capable of scavenging ROS and maintaining the redox state of cellular thiols. Hence, ROS generation may lead to depletion of GSH. We used flow cytometry to measure the single cell OPT fluorescence in order to examine whether lycopene treatment changes the GSH content. Once again, we found the same trend. The only cells showing a clear and significant effect due to treatment were HL60 cells incubated 24 h with LycoC, in particular at 10 and 25 μmol/L (Table 1). Cells treated with THF alone and Lyco had no appreciable effect on GSH content (Table 1).
Mean of percentage of cells with reduction of GSH content
THF, tetrahydrofuran; Lyco, pure lycopene; LycoC, lycopene phytocomplex; CTR, control; GSH, glutathione
Untreated and treated HL60 cells were loaded for 5 min with o-phthaldialdehyde and analyzed with a FACSCalibur. Decreased fluorescence indicates reduction of GSH content. The values are expressed as mean ± SD of percentage of cells with decreased GSH content (n = 3). The paired t-test was used to assess the significance of differences between treatment and control groups
*Each values of THF versus CTR
†Each values of Lyco and LycoC versus respective values of THF
Antioxidant pretreatment before PDT with Pu-18 and visible red light
Antioxidant consumption combined with chemotherapy could improve the therapeutic approach to cancer. 17 Therefore, we decided to use PDT with Pu-18 in HL60 cells alone or after pretreatment with Lyco and LycoC and with other antioxidants such as AA and alpha-tocopherol.
Figure 6 shows a DNA profile in a time-course experiment in which HL60 cells were preincubated for 2 h with the different antioxidants. Pretreatment with 10 μmol/L LycoC without Pu-18 had only a mild cytotoxic effect in HL60 cells after red light irradiation; in contrast, LycoC pretreatment in association with Pu-18 significantly increased the percentage of apoptotic cells with respect to control (from 20.76 ± 5.29% to 57.02 ± 1.74% at 1 h after irradiation and from 45.19 ± 3.69% to 70.65 ± 7.24% at 2 h after irradiation). Conversely, at 4 h after PDT, the percentages of apoptotic cells recorded with and without LycoC were similar (respectively, 73.43 ± 1.24% and 68.13 ± 5.75%). Pretreatment with Lyco had neither a cytotoxic effect per se nor a synergist effect in combination with PDT. Pretreatment with 100 μmol/L AA also increased the PDT effect, detectable only at 1 h after PDT, but to a lesser degree than with LycoC. Pretreatment with alpha-tocopherol alone or in combination with AA did not affect the percentage of apoptotic cells recorded with respect to Pu-18 alone at any time after PDT; hence, the cytotoxic effects caused by AA were not maintained (data not shown).
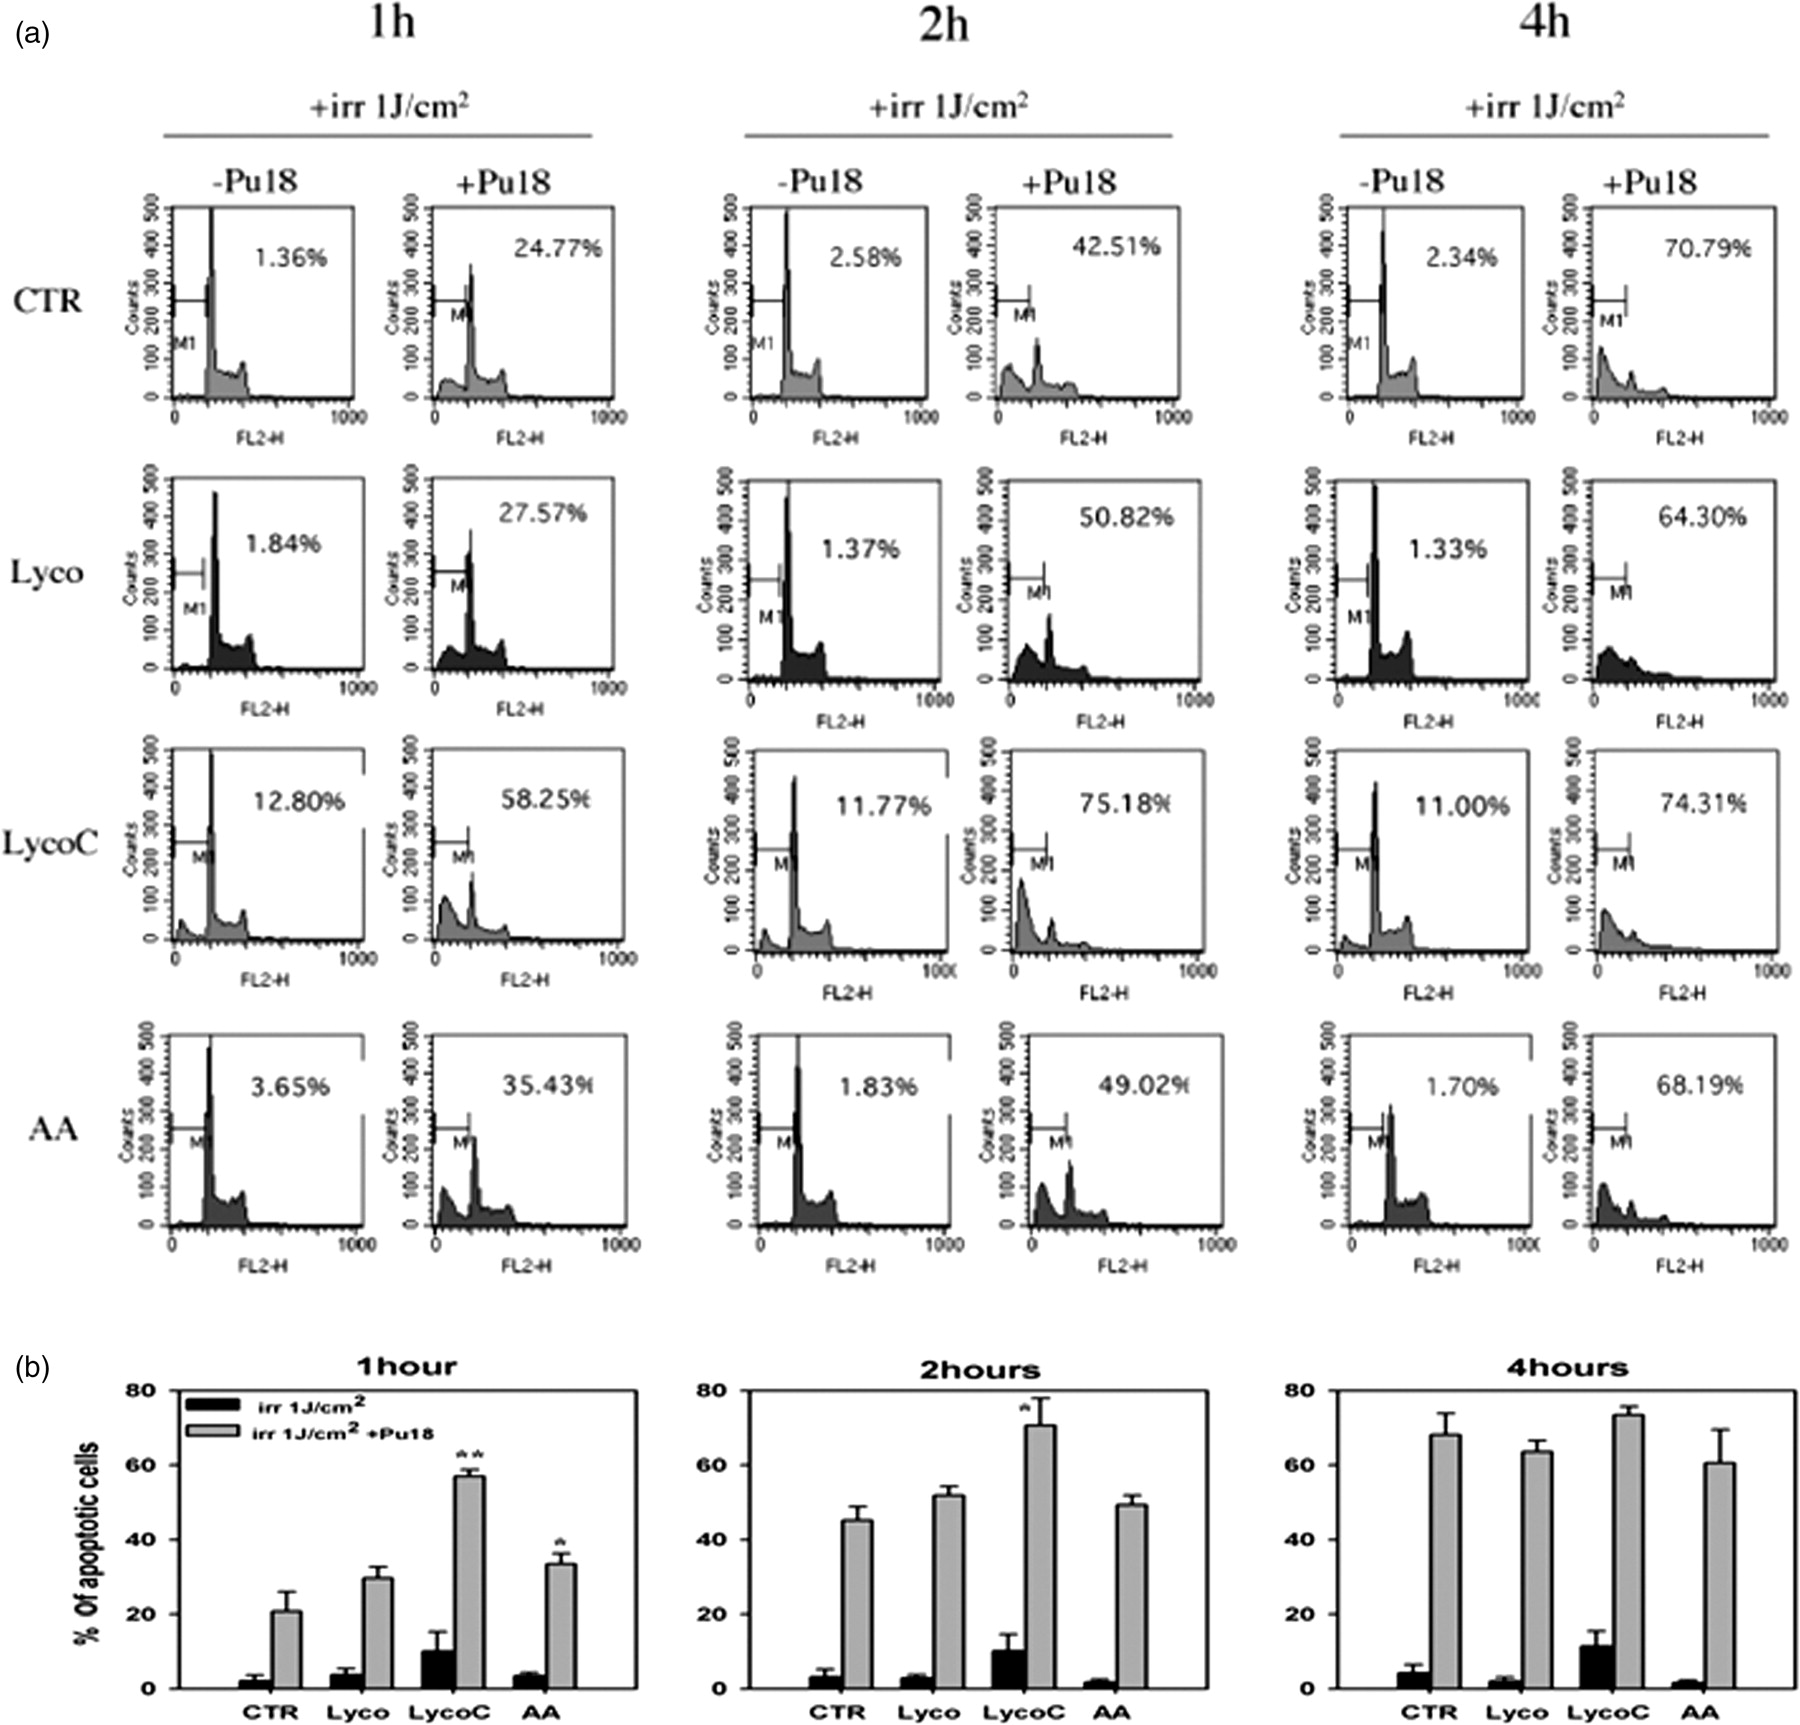
Flow cytometric analysis of the time course of cell cycle profiles after photodynamic therapy with Pu-18 alone or following 2 h of preincubation with ascorbic acid (100 μmol/L), pure lycopene (10 μmol/L) and lycopene phytocomplex (10 μmol/L). At 1, 2, and 4 h after treatments the percentage of apoptotic cells was quantified as the accumulation of propidium iodide (PI)-stained cells in the sub-G0/G1 DNA histogram region. (a) Results of a typical experiment, where the percentage of cells containing subdiploid DNA is indicated as M1 in each histogram. Panel B reports the percentages ± SD of cells containing subdiploid DNA (n = 3). *P < 0.05, **P < 0.001 with respect to control with or without Pu-18 at each time, respectively (Student's t-test)
Discussion
A diet rich in carotenoids, especially lycopene, has been associated with a decreased risk of prostate cancer as well as a reduced incidence of atherosclerosis and heart diseases. 25
Lycopene is an acyclic non-provitamin carotenoid containing 11 conjugated double bonds and two double bonds arranged in linear array. It differs from β-carotene in lacking the β-ionone ring and is thus devoid of vitamin A activity. Lycopene is a lipophilic red pigment found in ripe tomatoes. 26 Carotenoids are synthesized in plants and fungi but not in animals, which is why their dietary intake is important.
Many studies, both in vivo and in vitro, demonstrate the efficacy of lycopene in preventing cancer and killing cancer cells, although its mechanism of action is not fully understood. 6,8,27,28 Cytotoxicity associated with lycopene treatment seems to be apoptosis-mediated. 16,29,30 Nevertheless, Kotake-Nara et al. 31 did not find apoptosis induction by lycopene in PC-3, DU-145 and LNCaP cells, even when high lycopene concentrations were used. In contrast, the oxidative metabolite of lycopene, acyclo-retinoic acid, induced apoptosis in PC-3 and DU-145 but not in LNCaP cells. 32
The anticancer activity of lycopene seems to be related to oxidative products generated during the food processing. Zhang et al. 16 prepared an oxidation mixture of lycopene and β-carotene by autoxidation in toluene at 37°C for 24 h; the mixture inhibited cell growth while intact lycopene did not. Boileau et al. investigated the effects of these dietary variables in a rat model of prostate carcinogenesis. Consumption of tomato powder, but not of lycopene, inhibited prostate carcinogenesis, suggesting that tomato products contain compounds in addition to lycopene that modify prostate carcinogenesis. Lycopene bioactivity might be a function of the complex mixture of multiple polynutrients present in tomatoes. 33
These results prompted us to investigate the ability of LycoC and pure lycopene to trigger apoptosis in HL60 human leukemia cells. Our experiments clearly demonstrate that Lyco had only mild effects on HL60 cells, while the phytomixture commercialized at 6% lycopene was responsible for the induction of apoptosis in HL60 cells (Figures 2 –4). After 24 h of incubation with LycoC, we found the classical hypodiploid peak, a characteristic marker of apoptosis. LycoC-induced apoptosis was also confirmed by double staining with Annexin-V/PI and a decrease of mitochondrial transmembrane potential. Moreover, data obtained with DCFH-DA, a probe for ROS generation, and with OPT, a GSH probe, clearly showed that both ROS production and GSH depletion occurred in HL60 cells treated with LycoC for 24 h (Figure 5 and Table 1).
Mitochondria, the main organelles producing ROS and also one of the main cytotoxic targets of ROS, are highly enriched with antioxidants (including GSH and enzymes) on both sides of their membranes to minimize oxidative stress in and around the organelle. Several events, including mitochondrial GSH depletion, can induce oxidative stress, which promotes mitochondrial permeability transition pore opening, leading to the loss of ΔΨm and the mitochondrial release of apoptogenic proteins. 34
Interestingly, we found strong similarities in the percentages of cells showing loss of ΔΨm, exposure of PS and increases of oxidative stress and cell death, suggesting that these events were closely correlated (Figures 2 –5). However, it is difficult to discern whether intracellular ROS production preceded the loss of ΔΨm or vice versa. Nevertheless, a smaller percentage of cells showed GSH depletion (Table 1), suggesting that the loss of GSH may not be crucial for LycoC-induced apoptosis but rather a secondary consequence of ROS generation.
Our data suggest that LycoC triggers apoptosis via a mitochondrial pathway, as reported for pure lycopene in LNCaP human prostate cancer cells. 35 Indeed, Lyco, which is not able to induce apoptosis, did not induce loss of ΔΨm, GSH depletion or ROS generation (Figures 4, 5, and Table 1).
Hence, LycoC from tomatoes appears to be a better source of agents able to modulate apoptosis in tumor cells than Lyco. These data are compatible with the hypothesis that the higher cytotoxicity of LycoC compared with Lyco is due to additional cytotoxic compounds present in the extract, e.g. other classes of carotenoids, or to the synergistic effects of accompanying compounds, such as polyphenols and terpenoids. Although in a different system, our results might be partially understood taking into account the results reported by Stahl et al. 36 Using a multilamellar liposome system, they demonstrated that lycopene was the most potent antioxidant; however, mixtures of carotenoids, in particular lycopene and lutein, were more effective than the single compound.
Moreover, our group has previously published in vivo study results showing that a lotion containing lycopene extract was more efficient than Lyco in preventing the generation of radicals in skin after exposure to a solar simulator. 37
On the other hand, it has also been reported that carotenoids at low concentrations may serve as antioxidants, inhibiting free radical production, while at relatively high concentrations and/or in the presence of a chronic oxidative stress they may behave as a pro-oxidant, propagating free radical-induced reactions, inducing the production of ROS, which in turn stimulates the cell-death machinery. 14,15
PDT is a relatively new treatment of diseases involving uncontrolled cell proliferation. It is based on the production of reactive species after illumination of a photosensitizer in the presence of oxygen. Our group has a long-standing interest in PDT with Pu-18, a cancer treatment combining a photosensitizer and red light. We have already shown that PDT with Pu-18 induces apoptosis in HL60 cells 19 and that PDT-induced apoptosis was associated with ROS generation, GSH depletion, decrease of mitochondrial transmembrane potential, simultaneous down-regulation of mitofilin and carbonylation of specific molecular chaperones. 20
The presence of antioxidants in photodynamic reactions usually reduces the efficacy of PDT. However, some antioxidants, such as AA, 38,39 alpha-tocopherol, 40 butyl-4-hydroxyanisole 41,42 and retinoids, 43 may enhance the photodamaging activity of PDT when added to cells at adequate concentrations. 18
These findings prompted us to investigate if Lyco and LycoC can potentiate the effect of PDT with Pu-18 in HL60 cells. For comparison, we also tested the ability of AA and alpha-tocopherol alone and in combination to improve the efficacy of PDT with Pu-18 (Figure 6). We incubated HL60 cells with different antioxidants for 2 h before irradiation, choosing doses of antioxidants that had no detectable cytotoxic effects after red light exposure. Interestingly, pretreatment with LycoC doubled the PDT-induced apoptosis. Moreover, LycoC appeared to be a stronger PDT-enhancer than AA, alpha-tocopherol or the two combined (Figure 6). It seemed almost that LycoC ‘accelerated’ the process, promoting cells to undergo apoptosis.
In agreement with this finding, PDT-induced loss of ΔΨm, PS exposure and GSH depletion were enhanced by LycoC pretreatment (data not shown).
The principal site of localization of Pu-18 is the mitochondrion as we reported previously, 44 and the mitochondrion is also the site of photodamage. Since mitochondria have been established as the major generator and direct target of ROS in human cells, it is reasonable to suppose that LycoC, acting as pro-oxidant in HL60 cells, increased the oxidative stress induced by PDT, leading to an increased number of cells to activate the mitochondrial apoptotic machinery.
We believe that this is due to its composition. In our experimental condition, products derived by photo-oxidation of lycopene likely play a critical role in potentiating the apoptosis induced by PDT. Zhang et al. showed that autoxidation of lycopene was able to induce apoptosis in HL60 cells. This is probably what happens in HL60 cells pretreated with LycoC before PDT or more likely the irradiation of Pu-18 accelerates the formation of autoxidation products of lycopene.
These findings provide a valuable strategy to increase the sensitivity of human leukemia HL60 cells to PDT-induced apoptosis.
The general message of our study is that LycoC has a stronger cytotoxic effect than Lyco on HL60 cells, supporting the idea that a balanced diet and not the single compound can play a major role in both the prevention and treatment of disease.
However, considering our promising results on the efficacy of LycoC with respect to Lyco, we intend to analyze the composition of our phytocomplex and look for pro-oxidant molecules or oxidized products derived from lycopene itself that can explain the superior effects of LycoC versus Lyco in inducing apoptosis in leukemia cell lines and in improving PDT.
Footnotes
ACKNOWLEDGEMENTS
The authors are thankful to Dr Sandra Nuti and Dr Simona Tavarini for help with FACS analysis, Leonardo Taurisano for technical assistance and Dr Peter Christie for careful revision of the English.
This research was supported in part by grants from Fondazione Monte dei Paschi di Siena and PAR progetti (UNISI).