




Abstract
The aim of this preliminary study is to explore the feasibility of incorporating superparamagnetic iron oxide (SPIO) with poly-
Introduction
The ability to track and assess cells non-invasively is important in biology and medicine.
1,2
Currently, radionuclide or fluorescent labels are commonly used in cell tracking, but the application of these methods may be limited by toxicity to individual cells or to the patient.
3–5
There is increasing interest in using magnetic resonance imaging (MRI) because of its high sensitivity and high spatial resolution in monitoring the migration of cells labeled with superparamagnetic iron oxide (SPIO) nanoparticles.
6
An SPIO-based cell monitoring approach might provide a valuable tool for the evaluation of cell therapy. Owing to their biocompatibility and strong T2 relaxation effects, SPIOs are very useful as T2 contrast agents in cellular MRI. Ferumoxides-based Endorem or Feridex (Guerbet Group, Paris, France) consists of dextran-coated SPIO with a diameter of ∼150 nm. It has been used as a contrast agent for liver and stem cell imaging in patients.
7–10
However, there are few studies on using ferumoxides for tumor cell imaging. In this preliminary study, we examined the feasibility of using Endorem embellished with poly-
Materials and methods
Cell culture
Human lung adenocarcinoma cells (ASTC-a-1) (obtained from the Department of Medicine, Jinan University, Guangzhou, China) were grown in Dulbecco's modified Eagle's medium (DMEM; Life Technologies Inc, Grand Island, NY, USA) supplemented with 10% fetal bovine serum (FBS), 50 U/mL penicillin and 50 mg/L streptomycin under 5% CO2 in a humidified incubator. In all experiments, 70–85% confluent cultures were used.
Cell labeling
Confluent cells were transferred onto fresh culture dishes, and after 24 h, medium containing FBS was replaced with medium free of FBS to avoid unspecific binding of the SPIOs to serum albumin. Cells were then incubated with different concentrations of SPIOs (5–200 μg/mL) in the presence of 1.5 μg/mL PLL (Sigma, St Louis, MO, USA). At predetermined time points (0.5, 4 or 24 h), labeled cells were washed three times in phosphate-buffered saline (PBS).
The presence of intracellular iron was detected by Prussian blue stain and counterstained with eosin. Briefly, cells were placed in 24-well microplates, fixed with 4% glutaraldehyde for 20 min and then incubated with a 1:1 (vol/vol) mixture of 2% potassium ferrouscyanide and kalium ferrocyanatum II, and 6% HCl for another 20 min. Cells were rinsed in PBS and counterstained with eosin for three minutes. The presence of iron oxides was assessed under a microscope (DFC300 FX, Leica, Wetzlar, Germany; ×100 magnification) by counting iron-positive cells (blue) from a total of approximately 300 cells.
Effect of SPIO-PLL on cell proliferation
ASTC-a-1 cells were cultured in a 96-well microplate at a density of 3 × 10³ cells/well for 24 h, followed by incubating with SPIO-PLL at a concentration of 0, 5, 10, 15, 20, 25, 50, 100 or 200 μg/mL. Cell proliferation was assessed with Cell Counting Kit-8 (CCK-8; Dojindo Laboratories, Kumamoto, Japan) at 0, 0.5, 4 or 24 h. The absorbance value at 450 nm (A450), proportional inversely to the ratio of dead cells,
11
was read with a 96-well plate reader (INFINITE M200, Tecan, Switzerland). All experiments were performed in quintuplicate on three separate occasions. The inhibition ratio was calculated as

Imaging analysis of cells treated with SPIOs
A laser scanning microscopy combination system (LSM510/ConfoCor2; Zeiss, Jena, Germany) with a ×40 oil-immersion plan apochromat objective lens was used. The system was equipped with a krypton–argon air-cooled laser (30 mW) for excitation illumination. Imaging was performed before and after cells were treated with 25, 100 or 200 μg/mL SPIO-PLL for up to 120 min. Cells were maintained at 37°C under 5% CO2 during imaging within the culture chamber. For the measurement of reactive oxygen species (ROS) and mitochondrial membrane potential (Dym), cells were co-stained with dichlorodihydrofluorescein diacetate (H2DCFDA) (10 μmol/L; Molecular Probes Inc, Eugene, OR, USA) and Rhodamine 123 (5 μmol/L; Alexis Biochemicals Inc, San Diego, CA, USA). The excitation wavelength was 488 nm and the emission detection filter was BP 500–550 nm. To quantify the results, the fluorescence emission intensities were analyzed with Zeiss Rel3.2 image processing software (Zeiss). 12–14
In vitro MRI of SPIO-PLL-labeled cells
After incubating with SPIO-PLL (25 μg/mL) for 0.5 h, 1 × 10⁵ and 1 × 10⁶ cells were transferred to two Eppendorf tubes loaded with 0.5 mL of 1% agarose, respectively. Unlabeled cells of the same densities were added to two Eppendorf tubes loaded with 0.5 mL of 1% agarose as the control. Another tube without cells was used as the blank control. MRI was performed with a 1.5 T Imager (GE Signa HD, 1.5 T MR, GE Healthcare, Milwaukee, WI, USA) and a 12.7 cm receive-only knee coil. MR coronal images were scanned using a gradient-echo T2* sequence (repetition time [ms]/echo time [ms] = 620/15.7, 35° flip angle), a fast spin echo T2 sequence (repetition time [ms]/echo time [ms] = 4000/108, 16 echo train length) and a spin echo T1 sequence (repetition time [ms]/echo time [ms] = 500/17.9). Images were obtained with a matrix size of 256 × 256. Two measurements were acquired at the section thickness of 2 mm and field view of 13 × 13 cm2. Region of interest (ROI) for signal intensity (SI) measurement was 14.6 mm2. Twelve ROIs were randomly selected and measured in each tube. The percentage change of SI (ΔSI) was calculated by using the equation:

Statistical analysis
Data are presented as the mean ± SD. Statistical analyses were carried out with SPSS12 (SPSS, Chicago, IL, USA) using the two-sample t-test. A difference of P < 0.05 was considered to indicate statistical significance.
Results
Uptake of SPIO-PLL by ASTC-a-1 cells
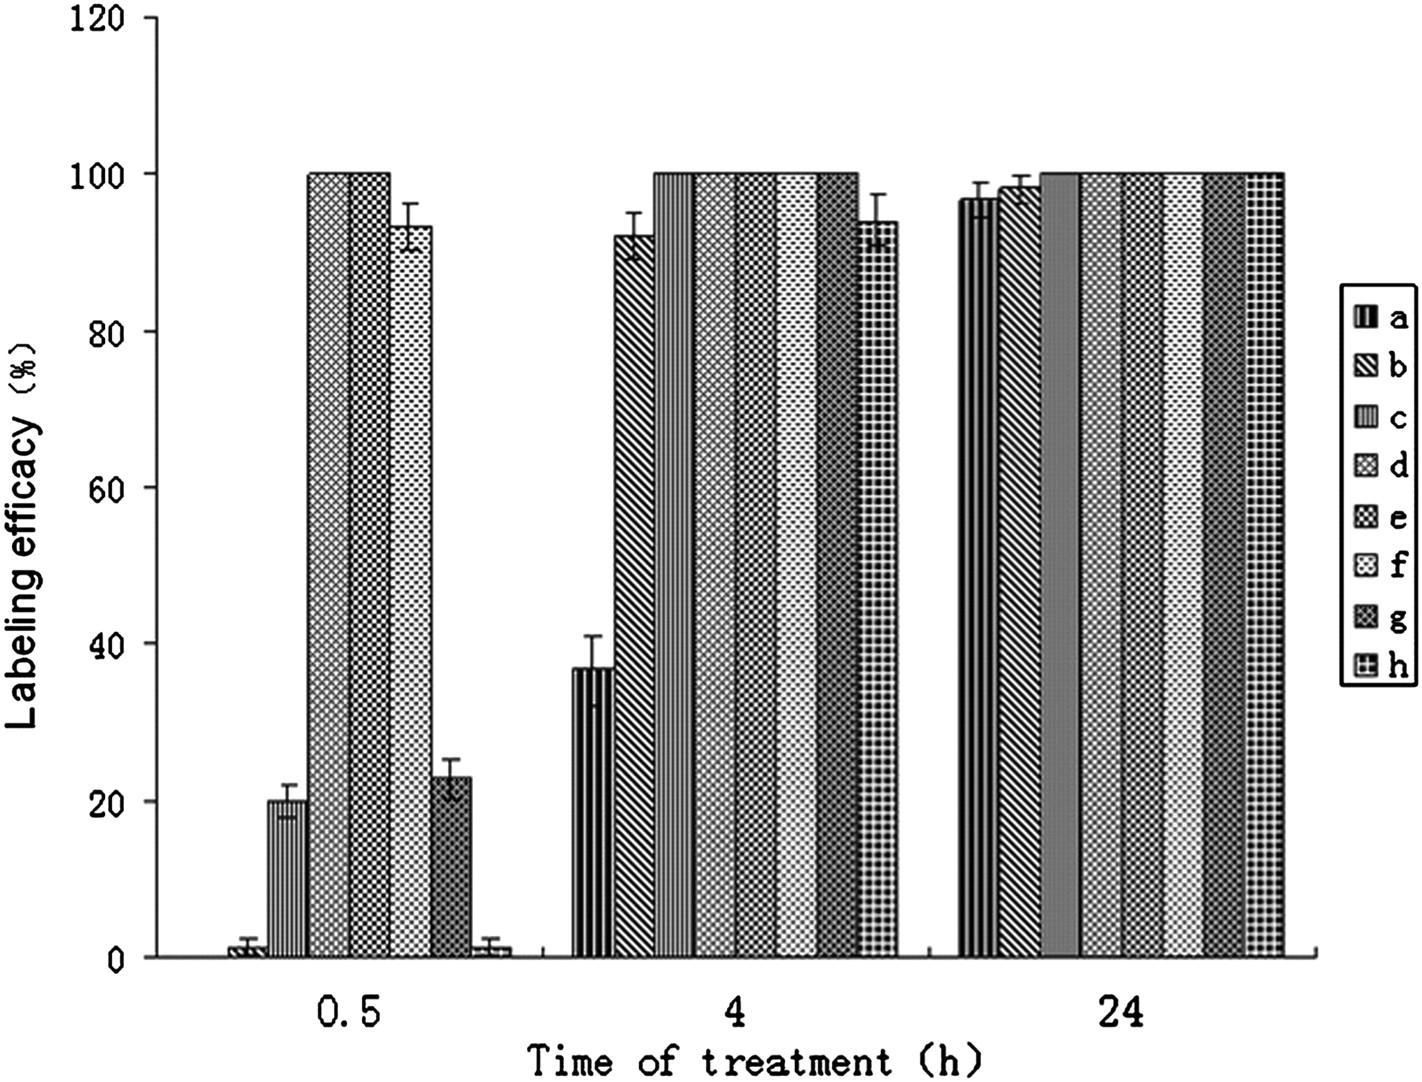
The cellular uptake of SPIO-PLL was confirmed by Prussian blue stain. Under optical microscopy, iron oxide nanoparticles were stained as blue (Figure 1a). Results showed that the intensity and the percentage of SPIO-PLL-labeled cells were governed by the SPIO-PLL concentration used. Interestingly, >99% labeling efficiency was achieved by incubating with 25 μg/mL SPIO-PLL for a 0.5 h. ASTC-a-1 cells showed little morphological change, whereas the labeling efficiency decreased 70% at 50 μg/mL or higher concentrations (Figures 1a and 2). Moreover, longer incubation (e.g. >4 h) also resulted in morphological changes, for example, cells became bigger and rounder (Figure 1b and c).
Photomicrographs of Prussian blue staining of ASTC-a-1 cells labeled with SPIO-PLL of various iron concentrations. (A) Control: without the complex of SPIO and PLL. (B) PLL-treated: without SPIO. (C–J) ASTC-a-1 cells were treated with SPIO-PLL at 5, 10, 15, 20, 25, 50, 100 and 200 μg/mLl (magnification ×100). (a) Labeling for 0.5 h, (b) labeling for four hours, (c) labeling for 24 h and (d) left – the retention of iron particles after seven days, right – unlabeled cells. SPIO, superparamagnetic iron oxide; PLL, poly- Bar graph of labeling efficiency (a–h: 5, 10, 15, 20, 25, 50, 100 and 200 μg/mL)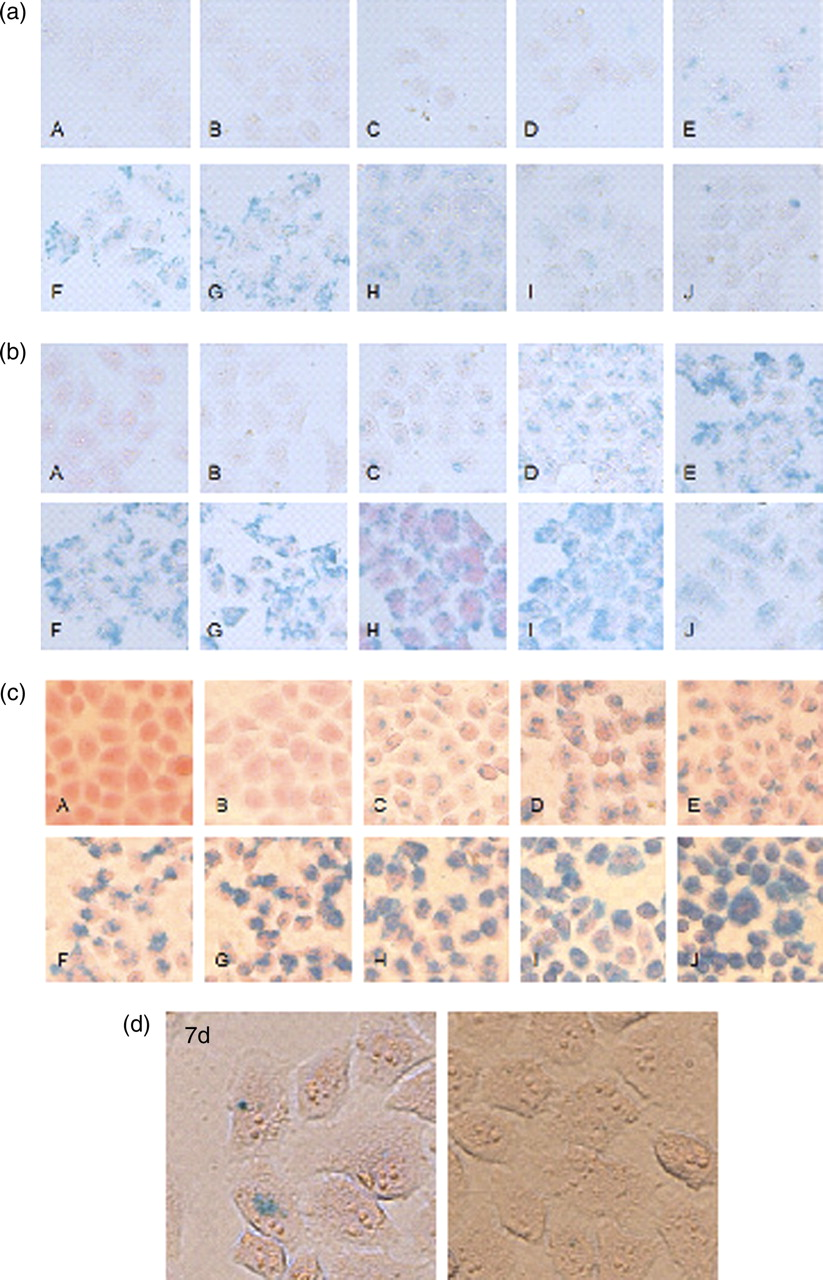
Under the labeling condition of 25 μg/mL SPIO-PLL and 0.5 h, even after seven days, Prussian blue stain still clearly showed the intracellular retention of iron particles (Figure 1d).
Effects of SPIO-PLL on cell proliferation
To examine whether the magnetic labeling could have any cytotoxic effect, we used the CCK-8 assay to examine the cell proliferation. After the cells were exposed to SPIO-PLL at various concentrations (0–200 μg/mL) for 0.5–24 h, A450 values, an indicator of cell death, were measured. As seen in Figure 3a, there were no significant differences between A450 values of labeled cells and those of unlabeled cells after incubating with SPIO-PLL (0–200 μg/mL) for 0.5 h. However, statistical analysis of data after 4 and 24 h showed that the A450 value decreased as the concentration of SPIO-PLL increased to 50 μg/mL (Figure 3b and c), which indicated that the effects of SPIO-PLL on cell death of ASTC-a-1 cells were dose- and time-dependent. Our results demonstrated that a high concentration (i.e. >50 μg/mL) and a longer incubation (i.e. >4 h) could induce significant cell death compared with the control group (P < 0.05) (Figure 3b and c).

Inhibition of SPIO-PLL on the cell viability: (a) 0.5-h incubation, (b) four-hour incubation and (c) 24-h incubation. (a–i) Control: 5, 10, 15, 20, 25, 50, 100 and 200 μg/mL). *P < 0.05. SPIO, superparamagnetic iron oxide; PLL, poly-
Effects of SPIO-PLL on ROS generation
Increases in ROS production were observed in the labeled ASTC-a-1 cells when compared with unlabeled cells. The formation of ROS in ASTC-a-1 cells induced by a higher concentration of SPIO-PLL was monitored by measuring changes in fluorescence, resulting from the oxidation of intracellular H2DCFDA. Cells were incubated with 10 μmol/L H2DCFDA for 20 min in DMEM culture medium. The fluorescence increase after the addition of SPIO-PLL indicated the generation of ROS. The typical time-course images of cells loaded with H2DCFDA after labeling are shown in Figure 4a. The average fluorescence intensities of DCF after labeling with 0, 100 or 200 μg/mL SPIO-PLL are shown in Figure 4b. The DCF fluorescence was observed when the cells were labeled for 86 min, or even shorter in 200 μg/mL SPIO-PLL. The results indicated that generation of ROS induced by SPIO-PLL was not an instant event. As seen in Figure 6a, a rapid increase in DCF fluorescence intensity was detected in a short period of time (<10 min) after labeling for 86 or 71 min. After an incubation of 100 min with 100 μg/mL and 77 min with 200 μg/mL, the DCF fluorescence intensity reached a plateau (P < 0.05). In contrast, when cells were incubated with SPIO-PLL at the concentration of 25 μg/mL, there was only a low level of detectable DCF fluorescence (P > 0.05). Therefore, this concentration was used for in vitro MRI.

Generation of mitochondrial ROS at 100 and 200 μg/mL of SPIO-PLL. Cells loaded with the H2DCFDA probe imaged at excitation of 488 nm (emission: BP 500–550 nm). The time after treating with SPIO-PLL is indicated in each panel. Bar = 10 μm. (a) Time-course images of ASTC-a-1 cells. (b) Fluorescence intensity curve of DCF (n = 5) with the standard deviations as the error bars in ASTC-a-1 cells. ROS, reactive oxygen species; SPIO, superparamagnetic iron oxide; PLL, poly-
Effects of SPIO-PLL on Dym
ASTC-a-1 cells were co-incubated with Rhodamine 123 dyes in order to monitor Dym in single cells by confocal laser scanning microscopy and determine whether a higher concentration of SPIO-PLL could induce mitochondrial damage. The dye binds to the inner and outer membrane of mitochondria and polarized mitochondria would appear as bright fluorescent spheres. A higher concentration of SPIO-PLL decreased the number of mitochondria markedly and induced mitochondrial swelling (Figure 5). Figure 5a shows the typical time-course images of mitochondria inside living cells loaded with Rhodamine 123 after labeling with 100 or 200 μg/mL SPIO-PLL. The average fluorescence intensities of Rhodamine 123 at different times after labeling with SPIO-PLL from three different cells are shown in Figure 5b. As soon as SPIO-PLL were in contact with the cells, the fluorescence intensity started to decrease gradually (Figure 5b), which indicated the decrease of Dym. About 120 min after labeling with SPIO-PLL, the fluorescence intensity reached the lowest level (P < 0.05). Compared with the labeled cells, the Dym of the control was nearly unchanged.
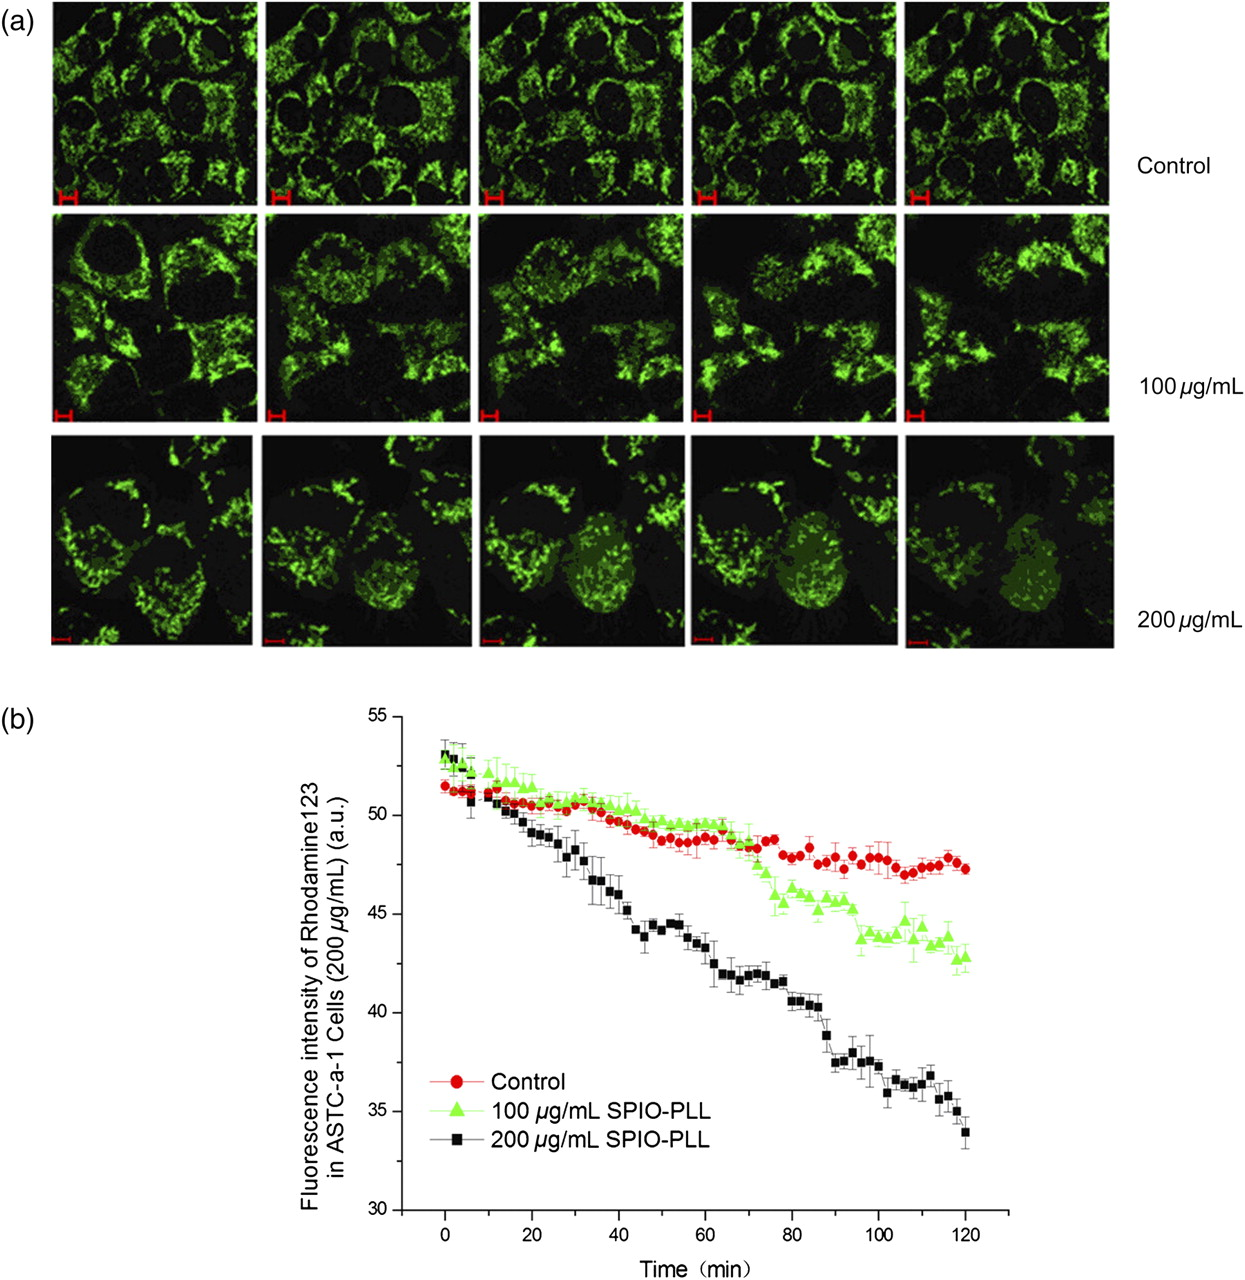
Changes of Dym induced by 200 μg/mL SPIO-PLL. Cells loaded with the Rhodamine 123 probe. Bar = 10 μm. (a) The time-course images of ASTC-a-1 cells. (b) Fluorescence intensity of Rhodamine 123 (n = 5), with standard deviations as the error bars in ASTC-a-1 cells. Dym, mitochondrial membrane potential; SPIO, superparamagnetic iron oxide; PLL, poly-
In vitro MRI
On the basis of previous experiments on the assessment of labeling efficiency and effect on proliferation, a dose of 25 μg/mL SPIO-PLL was used for subsequent MRI. Cells were cultured with SPIO-PLL for 0.5 h. MR images using three sequences (e.g. T1WI, T2WI and T2 *WI), from 1 × 10⁶- and 1 × 10⁵-labeled cells and 1 × 10⁶- and 1 × 10⁵-unlabeled cells in 1% agarose, are shown in Figure 6. The corresponding data of SIs are shown in Table 1. All the sequences showed hypointense signals, and signal strength in labeled cells was shown to be statistically significantly lower than that in unlabeled cells (P < 0.01). Moreover, the higher cell intensity generated a higher SI. Of T1WI, T2WI and T2 *WI, ΔSI on T2 *WI was the greatest, and smallest on T2WI. Moreover, on T1WI, T2WI and T2 *WI, ΔSI of higher cell intensity group were −21%, −19% and −10%, respectively, and ΔSI of lower cell intensity group were −19%, −10% and −5%, respectively. ΔSI of the 1 × 10⁶ group were significantly higher than that of the 1 × 10⁵ group (P < 0.01).
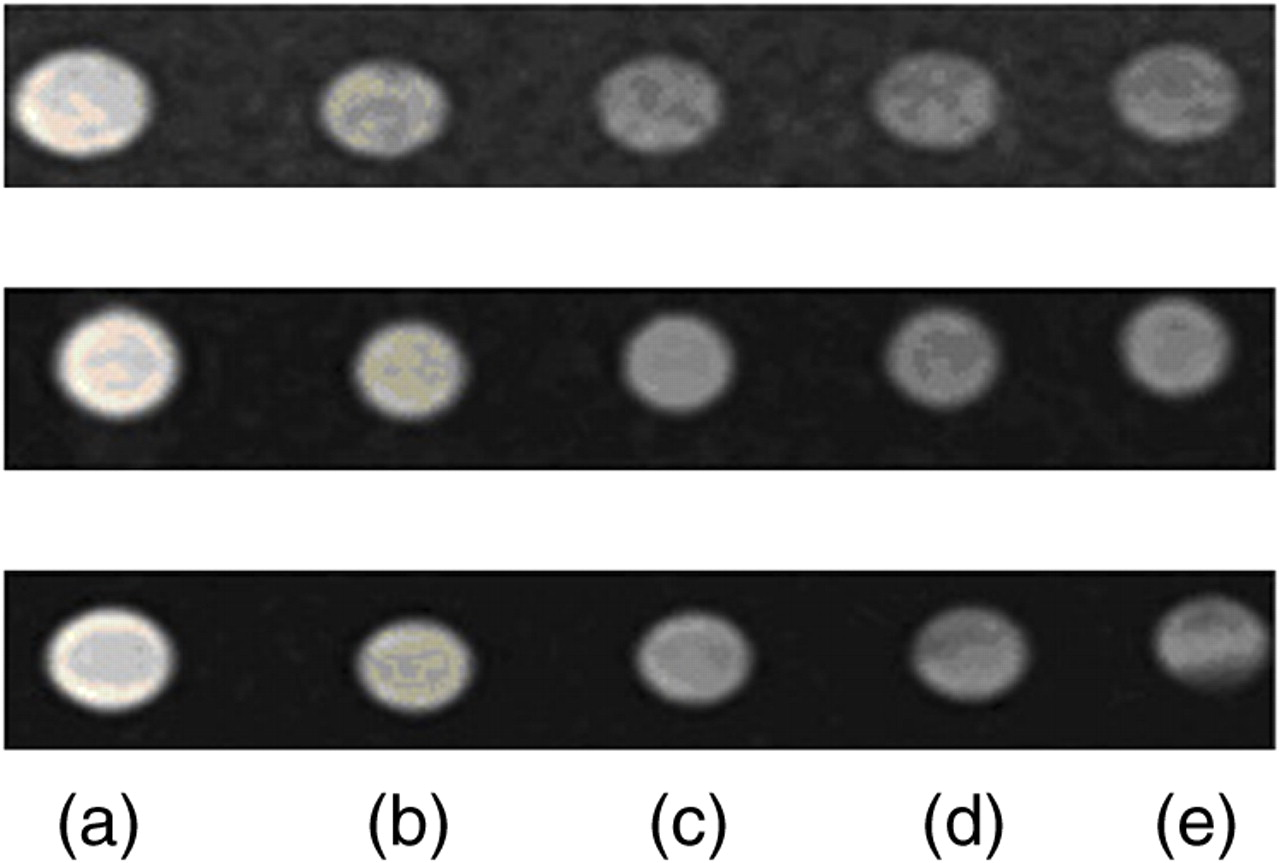
MR image of agar-gel-suspended ASTC-a-1 cells labeled with SPIO at 25 μg/mL in vitro. Upper row: T1WI; middle row: T2WI; lower row: T2
*WI. (a, b) Vehicle-treated, contained unlabeled ASTC-a-1 cells, 1 × 10⁶, 1 × 10⁵; (c) blank, contained 1% agarose; (d and e) labeled with SPIO-PLL, 1 × 10⁶, 1 × 10⁵. MR, magnetic resonance; SPIO, superparamagnetic iron oxide; PLL, poly-
Intensity of each layer of the phantom on T2*, T2- and T1-weighted images
SPIO, superparamagnetic iron oxide
Data are expressed as mean ± SD
Discussion
In recent years, a growing number of imaging modalities have been used in tracking cells in vitro and in vivo. 15 Owing to high spatial resolution, sensitivity and specificity, 16 MRI may be the most exciting potential technique in detecting the fewest number of labeled cells to track cellular events in vivo in living animals continuously and repeatedly in realtime. 17,18 Current advances in MRI have led to a range of new diagnostic and imaging approaches. 19 One such approach involves the use of SPIO particles as a contrast agent for cell tracking. Over the past few years, the use of SPIO labeling in MRI has found numerous applications in both basic research and clinical use, especially for the improvement of diagnostic imaging. 20 There are several advantages to the use of SPIO in MRI: 21,22 (1) they provide a strong change in signal, particularly on T2 *-weighted images; (2) they are composed of biodegradable and biocompatible iron; and (3) they can be easily detected by light and electron microscopy. This exciting new technique offers the potential for non-invasive tracking of implanted tissues and cells, and is therefore an ideal monitoring tool in the clinical setting.
The surface charge of the cell membrane is negative and thus anionic iron oxide nanoparticles have a repulsive interaction with the proteins of the cell membrane. PLL is a positive charge transfection reagent. Thus, to combine PLL and SPIO through electrostatic interactions is an efficient and effective technique for delivering the SPIO nanoparticles. A series of studies by Arbab et al. confirm that SPIO-PLL could significantly improve the rate of labeling in stem cells, other mammalian cells and even the tumor cells. 23–27 One of the potential advantages of this labeling method is that the ratio of PLL mixed in culture media is controllable, and there is no demonstrable short- or long-term toxicity, 27,28 which can also be confirmed in our other results (data not shown). This study demonstrated that incubating with 25 μg/mL of SPIO-PLL for 0.5 h could achieve almost 100% labeling rate. Compared with previous studies, this labeling condition is more convenient and simple.
For SPIO-PLL labeling, the concentration and incubation time are important and vary greatly in previous studies. 29 In this study, eight different SPIO-PLL concentrations and three different incubation times were tested. The CCK-8 assay illustrated that when increasing the concentration, there was a gradual descending trend in the cellular proliferation when incubation time was more than four hours (Figure 5b and c). At the SPIO-PLL concentration of 100 and 200 μg/mL, this effect was statistically significant and the cell mortality was greater than 30%. This may suggest that a high concentration of SPIO could reduce the cellular metabolic activity. Various studies show that the cytotoxicity of magnetic particles depends on the cell type and incubation time. 30,31
Daldrup-Link et al. 32 report that the uptake of SPIO-PLL could be increased by prolonging incubation time or increasing the concentration. However, as confirmed in our study, higher concentration (e.g. >50 μg/mL) could damage the cellular functions, such as the generation of ROS and change of Dym. To our best of knowledge, this is the first time that the cellular activities during labeling have been examined by fluorescence imaging techniques. Our results showed that the increase in ROS production could be induced by 100 and 200 μg/mL SPIO-PLL, as indicated by the increase in DCF fluorescence intensity (Figure 6a). Oxidative stress induces the redox activity of respiratory chain acceleration and a massive production of ROS. Interestingly, we found that the ROS level in cells at 200 μg/mL reaches the plateau much more quickly (i.e. 40 min) than that at 100 μg/mL (60 min). This result indicated that ASTC-a-1 cells are more susceptible to a higher concentration of SPIO-PLL. On the other hand, Dym decrease may promote matrix osmolality increase and mitochondria swelling and finally cause the release of proapoptotic factors. Changes in Dym are believed to be associated with the release of cytochrome c from the mitochondrial. Our study revealed that exposure of ASTC-a-1 cells to a high concentration of SPIO-PLL could induce marked changes in Dym.
A great number of transmission electron microscopy 33,34 studies showed that SPIO nanoparticles can be taken up by the cells rather than adhering to the exterior of the cell membrane. At an appropriate concentration, they can be localized in the lysosome by endocytosis for an extended period of time or may be circulated into extracellular space. This is an independent process, which is different from the iron metabolism. 22 Thus, it would probably minimize existing cytotoxic effect. In our case, 25 μg/mL SPIO-PLL for 0.5 h gave rise to a high labeling ratio without any toxic effect.
Magnetically labeled ASTC-a-1 cells were visualized by 1.5 T high-quality MRI. Considering both safety and efficiency, we chose a relatively low concentration of SPIO (e.g. 25 μg/mL) and transfection reagent concentrations (1.5 μg/mL PLL). Our study on labeled ASTC-a-1 imaging in vitro by MRI showed that significant ΔSI were observed in T1WI, T2WI and T2 *WI when compared with unlabeled cells. The signal decayed and the percentage of ΔSI on T2 *WI was the most significant due to its higher sensitivity to the difference in magnetization rates caused by ferric oxide particles. In addition, the imaging of the labeled cells was performed for different cell concentrations (e.g. 1 × 10⁶ and 1 × 10⁵). In the three sequences, the former had a greater change in SI than the latter, which demonstrated that the degree of dark SI that fell off was associated with the number of labeled cells that decreased. However, it should be noted that 1 × 10⁵ cells could satisfy the clinical practice for the significant signal changed.
Our results showed that ASTC-a-1 cells can be successfully labeled in vitro by using a commercially available SPIO and PLL under suitable conditions. The experiments on MRI indicated that SPIO-PLL as an MR contrast agent might have the ability to detect tumor cells, and it is also feasible to use clinical 1.5 T MR imager for tracking cells. Thus, SPIO-PLL has a potential in efficient drug delivery, magnetic nanoparticle-coupled drugs or specific antibodies with low cytotoxicity and long duration.
In summary, the results of this study indicated that: (1) human lung adenocarcinoma cells could be effectively labeled with SPIO-PLL complex. An optimized cell labeling was achieved after incubation with the SPIO-PLL at the concentration of 25 μg/mL and incubation time of 30 min without posing significant adverse effect on the viability of cells; (2) the high concentration of SPIO might increase the production of ROS, cause the loss of Dym and disrupt the mitochondrial membrane structure; (3) the efficiency of this labeling method was supported by the ΔSI of in vitro MRI as few as 105 cells.
Footnotes
ACKNOWLEDGEMENTS
This work was supported by grants from the Natural Science Foundation of Guangdong Province (No. 06025211), the National Basic Research Program of China (2010CB732602) and the Program for Changjiang Scholars and Innovative Research Team in University (IRT0829).