




Abstract
We describe a method for the histologic evaluation of lipid accumulation in the livers of various mouse models of hepatic steatosis based on quantitative digital analysis of Oil Red O (ORO) accumulation in fresh-frozen hepatic sections. The process involves two principal steps: identification and digital photographic imaging of areas appropriate for analysis, followed by digital determination of the fraction of the identified area (Area Fraction) exhibiting ORO staining. The Area Fraction, designated the Digital Steatosis Score, is a valuable aspect of the histologic assessment of the liver, especially in various forms of alcoholic and non-alcoholic liver diseases. The method is rapid, requiring ∼3 min per specimen, and highly reproducible, avoiding the inevitably subjective, semi-quantitative evaluation of lipid content inherent in visual steatosis scoring systems. In normal mice and in six different mouse models of fatty liver, the Area Fraction was highly correlated with hepatic triglyceride content (P < 0.01). The coefficient of variation of repeated determinations of the Area Fraction by two different observers was ±6.4%. If made available in clinical settings, rapid, accurate quantitation of liver triglycerides by this method could be very useful in specific conditions such as assessment of donor livers for transplantation.
Introduction
Efforts to quantitate the previously descriptive evaluation of hepatic histopathology have led to the introduction of semi-quantitative scoring systems for assessing various aspects of hepatic disease. 1–5 Such systems have been used most extensively in the evaluation of chronic hepatitis, notably chronic hepatitis C, and of fatty liver disease. Assessments of the extent of fibrosis in the former and of the degree of steatosis in the latter, based on such scoring systems, have become important aspects of diagnostic and prognostic classification. However, the use of such scoring systems is time consuming and is often associated with appreciable variability between observers, which can influence diagnosis. 6–8 Efforts have been made to enhance the reproducibility of such scoring systems through the use of digital imaging and subsequent quantitation for the assessment of, e.g. hepatic fibrosis (e.g. references 9,10 ). To better quantitate the triglyceride content of liver biopsy tissue, we herein describe a new method for the scoring of hepatic steatosis (HS) by digital assessment of the extent of Oil Red O (ORO) staining, the visual assessment of which has long been used to evaluate the extent of tissue lipid accumulation. 11 The method and its results are illustrated in a group of mouse HS models of diverse etiologies including chronic ethanol (EtOH) consumption, dietary obesity and single gene obesity models due to mutations in the genes for leptin (ob/ob) 12 and the leptin receptor (db/db). 13,14
Materials and methods
Mice and diets
Male C57BL/6J, ob/ob and db/db mice were purchased at six weeks of age from Jackson Laboratories (Bar Harbor, ME, USA) and housed in group cages in a temperature-controlled facility with a 12-h light:dark cycle, with free access to water and to a standard chow diet (LabDiet 5001, 3.07 kcal/g, PMI, St Louis, MO, USA). Starting at age eight weeks, groups of ≥6 ob/ob, db/db and control C57BL/6J mice received the standard lab chow diet and water. Additional C57BL/6J mice received the chow diet and H2O containing 10%, 14% or 18% EtOH. Still further, C57BL/6J mice were fed a high fat diet (HFD) containing 35% lard (5.45 kcal/g, 55% of calories from fat; Bio-Serv, Frenchtown, NJ, USA) and H2O. Weights were recorded weekly. Consumption of food and of water or water/EtOH was recorded daily in the week before sacrifice. Mice were euthanized at 20 ± 1 weeks of age after an overnight fast. The protocol was approved by the IACUC Committee of Columbia University Medical Center. All applicable regulations concerning ethical use of animals were followed during this research.
Euthanasia and tissue harvesting
Euthanasia was accomplished with intraperitoneal injections of ketamine (0.1 mg/g) and xylazine (0.01 mg/g). The abdomens were opened, livers were removed and weighed, and a portion comprising approximately one-third of each liver was embedded in Tissue-Tek O.C.T. Compound (Sakura Finetek USA, Torrance, CA, USA), frozen on dry ice and stored at −80°C for future sectioning. Subsequently, serial 7-μm-thick sections were collected on poly-
Determination of hepatic tissue triglyceride and cholesterol
The unembedded portions of the livers were homogenized in phosphate-buffered saline. The total liver protein content was determined with the BCATM protein analysis kit (Thermo Scientific, Rockford, IL, USA), and hepatic triglyceride and cholesterol contents were determined, after Folch extraction, 15 with commercial kits (Cholesterol E and L-Type TG H; Wako Chemicals USA, Richmond, VA, USA) according to the manufacturer's instructions.
Histologic estimation of tissue neutral lipids
(a) Visual scoring: Visual semi-quantitative estimates of neutral lipids in ORO-stained hepatic sections were determined by two blinded observers (FG and PDB) prior to biochemical measurements of tissue lipid content. Steatosis was visually scored from 0 to 3 in five non-contiguous medium-power fields (MPFs, ×250) in three slides from each mouse, using standard published criteria based on the percentage of hepatocytes that contained ORO-stainable lipid. 5 Results from the two observers were pooled to calculate an average Visual Steatosis Score for each animal.
(b) Digital scoring: As above, images of five non-contiguous MPFs on three separate slides, observed at ×250 with a Nikon Eclipse 80i microscope, were captured with a Nikon Digital DXM 1200C camera. The images were analyzed for lipid content using Nikon NIS-Elements Br software (NE). Specifically, after an appropriate area of the slide, containing predominantly identifiable hepatic lobules with an absence of very large vessels, expanded portal areas, stromal collapse or scars, or sectioning/staining artifacts, appeared in the microscope viewfinder, NE was used to capture an image of that area of the slide for analysis, using the capture button in the main toolbar. This image was subjected to analysis following detailed but very clear guidelines in the Nikon NIS-Elements User's Guide (ver. 2.3), obtainable with the software.
Using RGB thresholding, areas where ORO staining was present were selected from within the captured image using the single point, three point and six point circle selection tool. The binary operations settings were set to clean 2x, smooth OFF, separate OFF. Neither size nor circularity were used to restrict the selection of the binary layer. After the initial selection of an ORO-stained region using a selection tool, a binary layer appeared over the original image that included areas that were similarly stained with ORO. Additional selections caused the RGB thresholding values to expand, creating a new binary layer inclusive of the last layer. This was repeated until all areas of ORO staining appeared to be included in the binary layer. Once a final, satisfactory binary layer was created over the image, the computed Area Fraction was read and defined as the Digital Steatosis Score. The number of separate objects, i.e. the number of individual lipid droplets, included in the binary layer was also noted.
The software provides additional settings that facilitate further slight adjustments to the binary layer as described in the NE manual, but these did not appreciably alter the computed Area Fraction. For a trained operator, the entire process of calculating the Area Fraction from a given ORO-stained slide required less than three minutes.
(c) Other measurements: The software was also used to determine the number (n) of individual ORO-positive bodies within the selected area of the slide. The mean cross-sectional area (MCSA) of these ORO-positive bodies was estimated as MCSA = Area Fraction/n.
Statistical analysis
Results are expressed as mean ± SE. Differences between groups for the parameters studied were assessed using Student's t-tests. Statistical significance was set at P < 0.05.
Results
Body weight, liver weight and lipid content
At sacrifice control mice weighed 27 ± 0.3 g. Average weights of mice receiving 10%, 14% and 18% EtOH were similar to controls, while HFD, db/db and ob/ob mice were significantly heavier at 37 ± 1, 51 ± 1 and 62 ± 1 g, respectively (P < 0.01 for each versus controls). Similarly, liver weights in normal mice averaged 1 ± 0.1 g, but increased progressively in each of the experimental groups to a maximum of 4 ± 0.2 g in the ob/ob animals (P < 0.01 versus controls in all groups). Hepatic triglycerides, 30 ± 2 mg in controls, were increased 1.3- to 9.6-fold in the experimental groups, averaging 40 ± 2 to 66 ± 2 mg in the EtOH groups, 63 ± 8 mg in HFD, 102 ± 7 mg in db/db and 285 ± 31 mg in ob/ob animals. These values were all significantly increased compared with controls (P < 0.05 or lower).
Hepatic histology
Hematoxylin and eosin and Masson trichrome staining revealed normal lobular architecture and an absence of fibrosis in all groups. There was a suggestion of multiple very small, unstained, peri-central droplets or vacuoles in normal mice. In the 10%, 14% and 18% EtOH and HFD groups these were more clearly visible as larger discrete droplets. In both the db/db and ob/ob mice they appeared to coalesce, with several very large as well as smaller droplets in most cells. Occasional, small inflammatory foci were observed in all groups including controls. A rare Mallory-Denk body was observed in one ob/ob liver.
In ORO-stained hepatic sections (Figure 1), control livers demonstrated multiple, very small, but clearly ORO+ lipid droplets with a peri-central accentuation. The ethanol groups, HFD, db/db and ob/ob mice all showed abundant, larger ORO + lipid droplets in a more nearly pan-lobular distribution. Droplets in db/db and ob/ob livers were still larger and more diffusely distributed throughout the lobule.
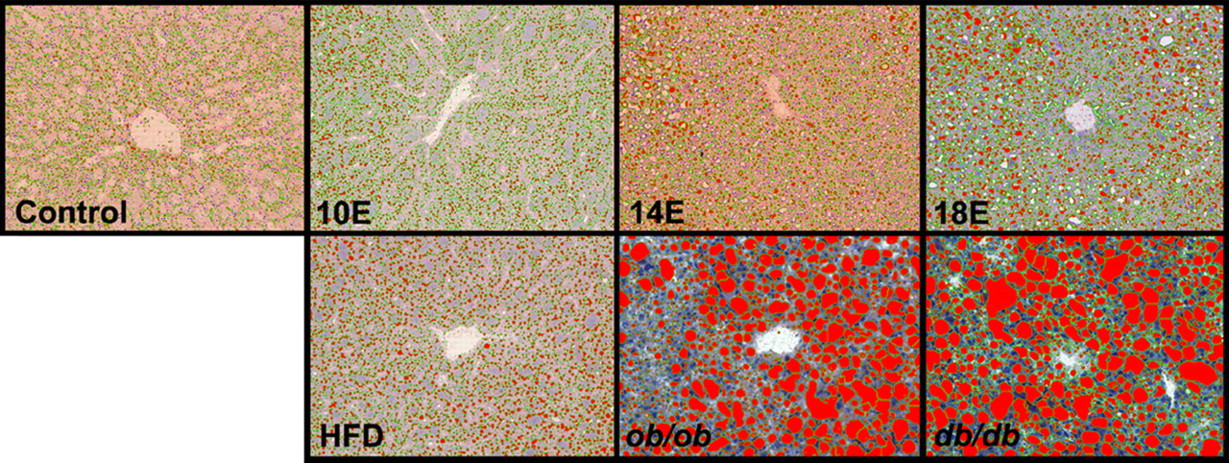
Typical Oil Red O-stained sections of the liver from control mice and those with hepatic steatosis of various causes, illustrating the differences in lipid content between the groups. Green borders within the binary layer created by Nikon Elements software define the boundaries of each individual lipid droplet. Original magnifications: ×250
Scoring of hepatic lipid deposition
Visual Hepatic Steatosis Scores (Figure 2a) increased progressively from 0.59 ± 0.2 in controls to 3.0 ± 0.0 in db/db and ob/ob mice, respectively. The scores were from 2.3 to 5.0 times the control value in all six experimental groups (P < 0.01 in each). Digital Hepatic Steatosis scores (Figure 2b) likewise increased, from 11.7 ± 1.8 in controls to 49.4 ± 2.4 in ob/ob mice, ranging, respectively, from 1.7 to 4.2 times the control value, and were significantly correlated with hepatic triglyceride content as measured biochemically (r = 0.88, P < 0.01; Figure 3). Visual Steatosis Scores were also significantly correlated with liver triglycerides(r = 0.86, P < 0.05) (not shown).

Hepatic Steatosis Score in seven groups of mice evaluated visually (a) and calculated by computer in the same seven groups (b). *P < 0.05, **P < 0.01 versus controls. The visual and digital Hepatic Steatosis Scores were highly correlated with each other (r = 0.97, P < 0.01). E, ethanol; HFD, high fat diet
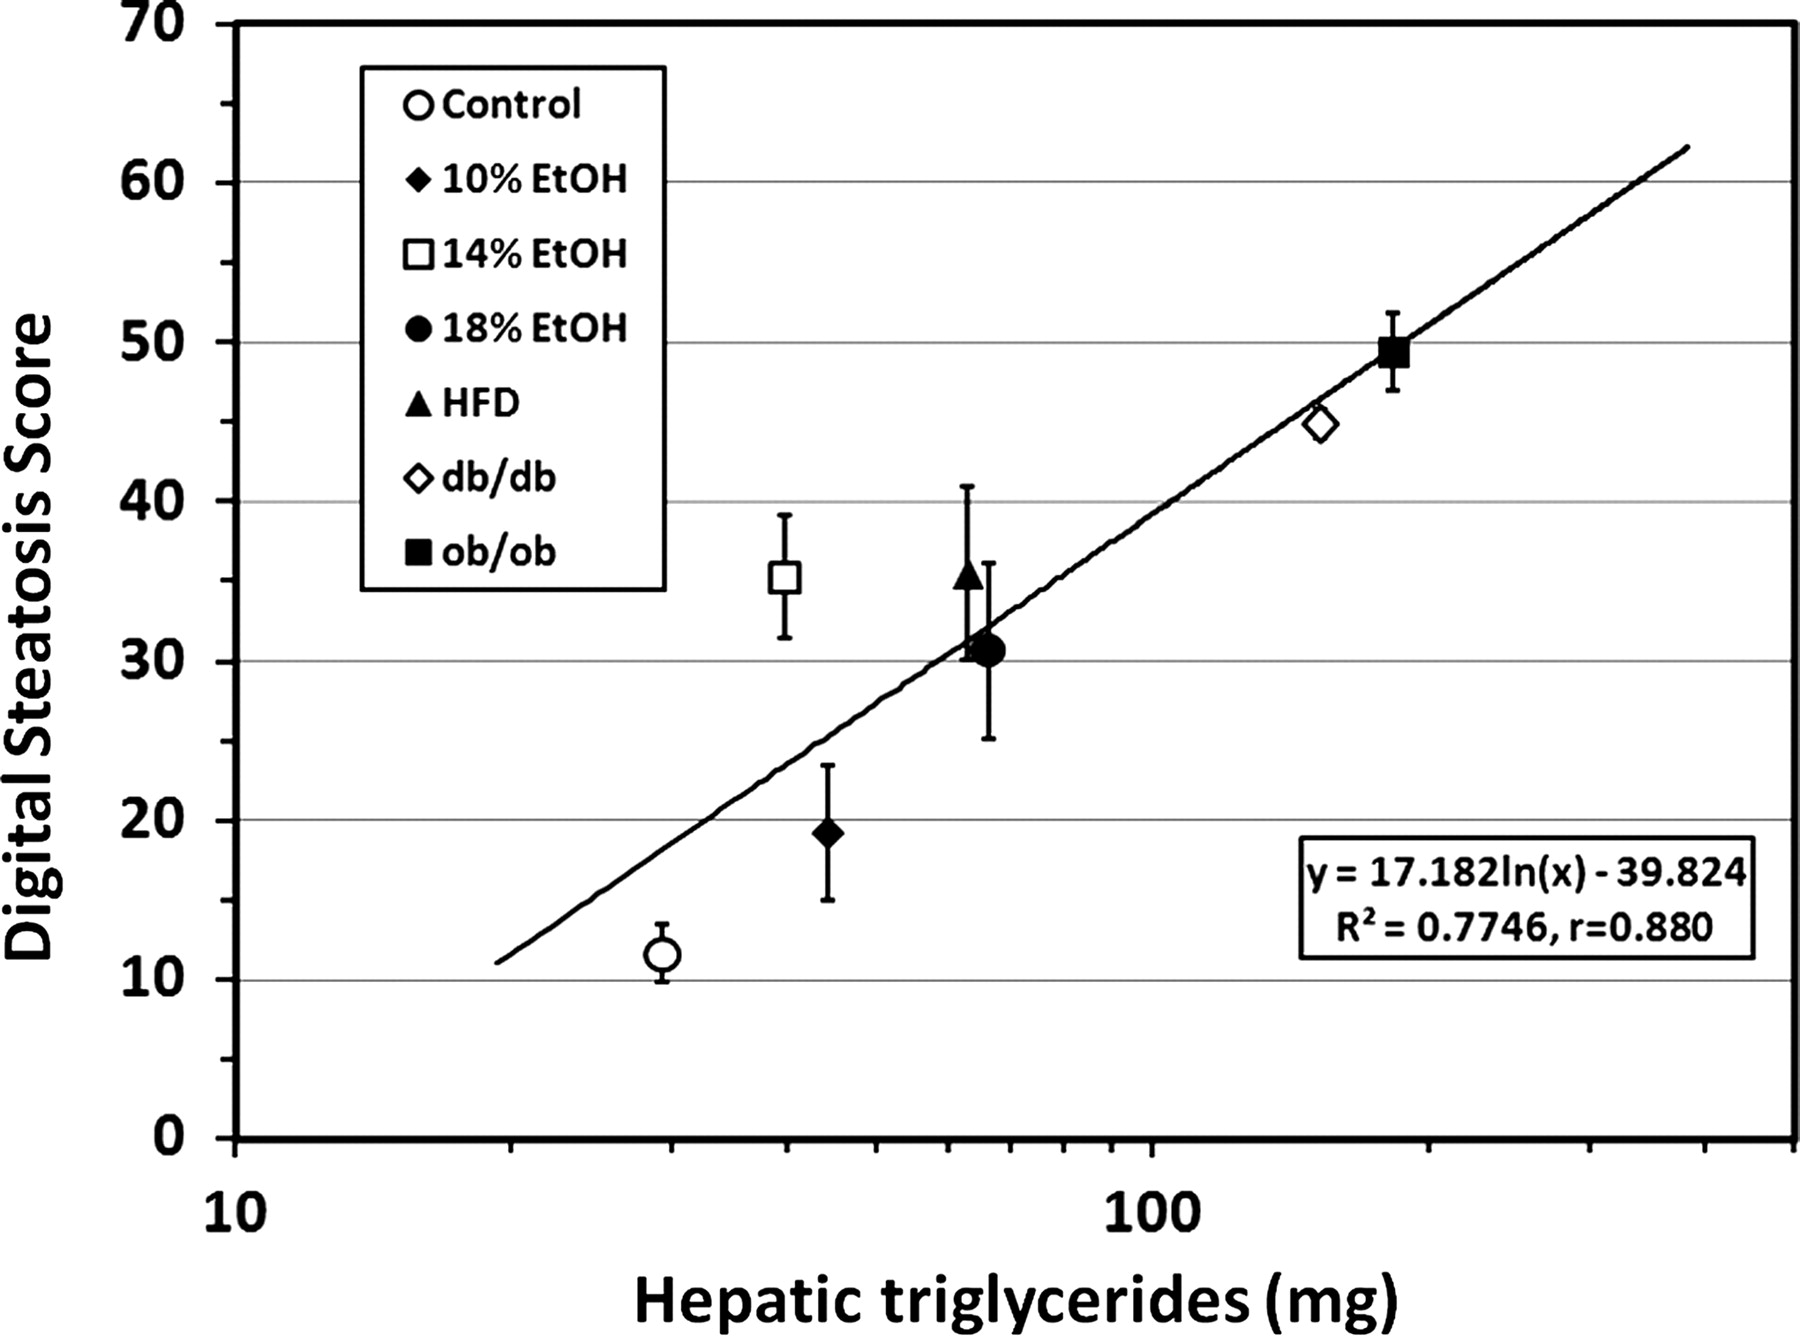
Digital Hepatic Steatosis Scores in control mice and six groups with hepatic steatosis were highly correlated with corresponding biochemical triglyceride assays (r = 0.88, P < 0.01). EtOH, ethanol; HFD, high fat diet
Reproducibility
Determination of the Digital Steatosis Score involves two principal steps: identification and digital imaging of areas appropriate for analysis, followed by digital determination of the Area Fraction exhibiting ORO staining. The coefficient of variation of the latter process, i.e. of the repeated determination by two observers of the Area Fraction in preselected (i.e. photographed) areas of the slides from 33 mice, was ±6.4%.
Droplet analysis
The numbers of ORO+ lipid droplets per MPF and their MCSAs in the different experimental groups, as determined by the NS software, are illustrated in Figure 4a. The number of individual lipid droplets per unit area decreased progressively as the total quantity of triglycerides increased (r = −0.760, P < 0.01). This counter-intuitive observation reflects the fact that the average size of the droplets, estimated from their MCSA, increased with the total amount of biochemically measured triglycerides (r = 0.924, P < 0.01). There was a highly significant inverse correlation between droplet number and droplet size (r = −0.99, P < 0.001; Figure 4b). These observations may suggest that the increase in droplet size between groups results, at least in part, from fusion of small droplets into larger ones.
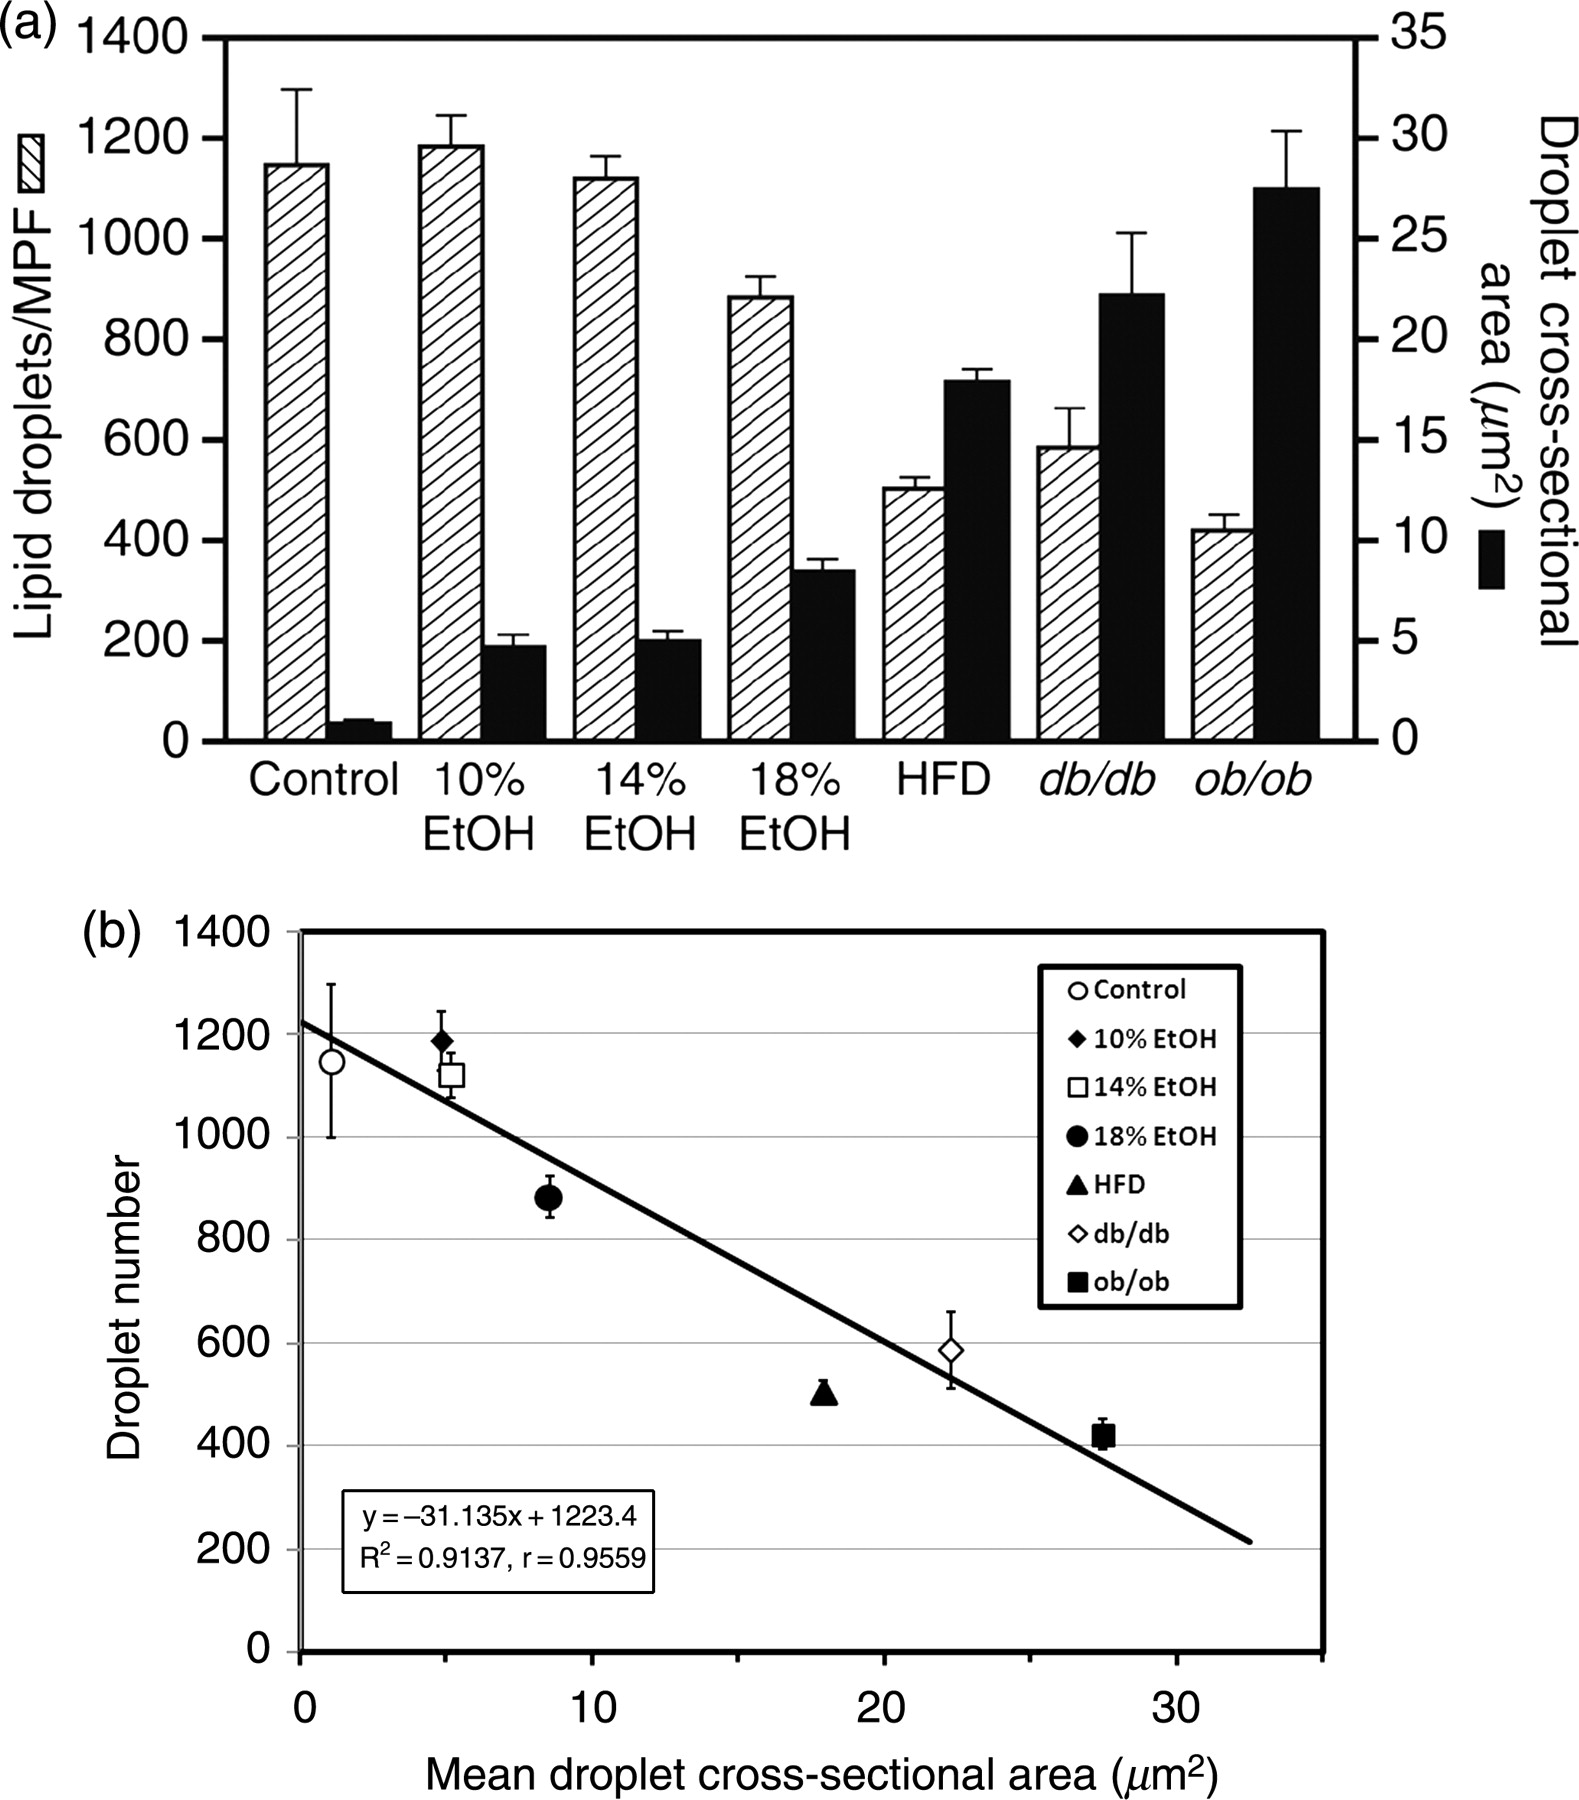
(a) Lipid droplet numbers (droplets/MPF) and mean droplet cross-sectional areas in control mice and the six hepatic steatosis groups. (b) Droplet numbers and mean cross-sectional areas were strongly inversely correlated across the seven groups of mice that were studied. MPF, medium power (×250) microscopic field; EtOH, ethanol; HFD, high fat diet
Discussion
Fatty liver diseases are the most common forms of liver disease in the Western world. The spectrum comprising non-alcoholic fatty liver disease is now the most prevalent liver disease in the USA and other developed countries, 16 although one of its major components, non-alcoholic steatohepatitis, was barely recognized just two decades ago. 17,18 Alcoholic liver disease is also highly prevalent, and also includes a spectrum ranging from simple HS to alcoholic steatohepatitis to cirrhosis and end-stage liver disease. 19 Animal models of both are widely studied. Simple, reliable histological scoring of the fat content of hepatic biopsies will be a useful tool in animal research into the various forms of HS, and is of considerable potential value in human histopathology.
HS can be classified as either macrovesicular, which typically involves a definable number of droplets of variable size which, as they enlarge, ultimately displace and distort the nucleus, or microvesicular, in which the cytoplasm is filled with innumerable, fairly uniform small droplets which do not displace the nucleus from its central location within the cell. Thus, histologic features in addition to vesicle size distinguish the two patterns. The software we employed provides three measures of HS: the overall Digital Steatosis Score, a measure of the number of lipid droplets per unit area, and the mean cross-sectional diameter of the droplets. The sole previously reported study of digital analysis of hepatic ORO staining used simpler software to determine the time course of acute lipid droplet accumulation in C57BL/6J mice treated with hepatotoxic doses of hydrazine or acetylhydrazine, but did not link this to the actual triglyceride content of the liver. 20 Our data indicate that in chronic HS, the number of lipid droplets is inversely related to total triglyceride content, whereas the average droplet size and the Digital Steatosis Score increase, and are significantly correlated with increasing triglyceride content. We did not specifically study models of microvesicular steatosis, and consider all of our histologic samples to represent different stages in the evolution of macrovesicular steatosis. It is likely that, purely in terms of droplet size, there would be some overlap between microvesicular and early cases of macrovesicular steatosis. Nevertheless, digital analyses of ORO staining and droplet size among classical mouse models of microvesicular steatosis might be able to define size-based criteria, such as size distribution patterns, for distinguishing the two variants of HS that would have application to human pathologic diagnosis.
The reproducibility of digital scoring of HS in mice, due to either obesity or EtOH, is appreciably better than that has been reported for visual histologic scoring of human liver biopsy specimens. 6–8,21–24 All visual scoring systems ultimately depend on the subjective assessment of the extent or severity of specific histologic features by different pathologists. Scoring systems for HS based on the percentage of hepatocytes that contain stainable lipid have two obvious limitations. The first is that pathologists rarely actually count lipid-containing and non-lipid containing cells to arrive at a score, but instead report an overall subjective impression. The second relates to the fact that such a scoring system fails to take into account the size of lipid droplets. The digital scoring system reported here takes droplet size into account in computing the Area Fraction. Finally, the Digital Steatosis Score is a continuous variable to which conventional statistical analysis can, therefore, be appropriately applied. While the various components of visual scoring systems are often treated as quantitative continuous variables, they are not. As previously described, 25 they are categorical data, with no properties other than their order, the absolute distances between them being undefined. 26 The rank-invariant properties of such ordered categorical data should restrict the application of common mathematical and statistical methods of analysis, 27 and only statistical methods appropriate for ordered categorical data should be utilized in their analysis. 28
Digital determination of HS scores in ORO-stained liver sections provides a quantitative reflection of hepatic triglyceride content, with excellent reproducibility between observers. It has the further advantage of much greater speed when compared with conventional visual methods. We believe it to be an excellent approach to quantitation of HS in animal studies. The major barrier to clinical use of this technique is the fact that quick freezing and ORO staining are not routinely available for liver biopsy specimens. If this practical obstacle can be overcome, there are many specific clinical situations, such as evaluation of donor livers for liver transplantation, in which accurate quantitation of hepatic triglycerides would be very useful.
Footnotes
Acknowledgements
We thank the Herbert Irving Comprehensive Cancer Center Histology Service for hematoxylin and eosin, Masson trichrome, and frozen sections and Oil Red O staining. These studies were supported by grants DK-52401 and DK-72526 from NIDDK and by the Columbia Liver Research Fund.