




Abstract
It is not uncommon for laboratory animals to be fasted prior to experimentation. Fasting evokes marked reductions in heart rate (HR), blood pressure (BP), heat production and oxygen consumption (VO2) in rodents. Mice with diet-induced obesity exhibit elevated HR and BP, and lower VO2 and heat production in the fed condition versus their lean counterparts. It is unknown whether body composition alters the tempo of response to fasting. We tested the hypothesis that cardiovascular and metabolic responses to fasting are delayed in obese versus lean male C57BL/6J mice. In the fed condition, mice that consumed high-fat (HF, 45% fat) chow for 98 ± 5 days had elevated (P < 0.05) body fat percentage (DEXA), serum leptin (ELISA), HR and BP (72-h biotelemetry), and lower (P < 0.05) heat production and VO2 (72-h metabolic chamber) versus animals that consumed standard chow (CON, 10% fat; n = 16 per group). HR, BP, VO2, heat production and serum leptin decreased (all P < 0.05) in response to a 16-h fast (16:00–08:00 h) in both groups. Although the overall fold changes in cardiovascular and metabolic parameters were similar in magnitude among animals, fasting-induced reductions in cardiovascular and metabolic variables occurred ∼4 and ∼7 h earlier (P < 0.05), respectively, in HF versus CON mice. These findings indicate that while metabolic and cardiovascular stress evoked by a 16-h fast at 22°C is not different between HF and CON mice, fasting-induced responses occur sooner in obese animals.
Introduction
It is not uncommon for laboratory animals to be fasted prior to experimentation. While this might be done to minimize risk to the animal during procedures such as endotracheal intubation, 1,2 to lessen physiological responses associated with digestion prior to protocols that involve physical exercise, 3,4 and/or to maximize agonist (e.g. insulin)-induced stimulation of tissue signaling pathways, 5 fasting represents a substantial challenge to an organism. For example, fasting evokes marked reductions in heart rate (HR) and blood pressure (BP) in rodents. 6–9 These reductions result from the organism entering into a state of torpor as it attempts to conserve energy. 8,10–13 Support for this statement is that fasting suppresses oxygen consumption, heat production, locomotion and body temperature in rodents. 8,10–16 Factors contributing to the severity of these reductions might include the animal species, species strain, gender, ambient and core body temperature, length of fast, and/or composition of the previously consumed diet.
Our laboratory investigates mechanisms responsible for cardiovascular complications (e.g. systemic hypertension and endothelial dysfunction) that exist in mice with diet-induced obesity. 5 We recently confirmed previous findings that HR and BP are elevated in obese versus lean mice during both the light (06:00–17:59 h) and dark (18:00–05:59 h) phases of their 24-h cycle. 5,17 Furthermore, our preliminary data and results from others 18 indicate that heat production, oxygen consumption and locomotion are less in obese versus lean animals. It is unknown whether differences exist between lean and obese mice specifically concerning the severity and timing of cardiovascular and metabolic responses to fasting. Addressing this issue is important to studies of vascular function because BP can significantly impact arterial function, 19,20 and vascular reactivity is typically determined in vitro using vessels obtained from mice that have completed a 16-h fast (i.e. 16:00–08:00 h). 5,17
We hypothesized that fasting-induced reductions in cardiovascular parameters (e.g. HR and BP) and metabolic function (e.g. oxygen consumption and heat production) would be less severe and/or delayed in obese versus lean mice. The rationale for this hypothesis was that because adipose tissue stores are more abundant in obese versus lean animals, fasting should pose less of a stress. Biotelemetry and metabolic chamber studies showed that HR, BP and heat production were higher, and oxygen consumption and locomotion were lower in obese versus lean mice in the fed condition. As anticipated, each of these variables decreased in response to fasting. Interestingly, the tempo of these changes was distinct, occurring earlier in the obese model. However, after 16 h of fasting, cardiovascular and metabolic adaptations had decreased to a similar extent overall. These data indicate that a 16-h fast is a suitable period after which to study vascular function in models of diet-induced obesity. However, shorter-term periods of fasting could be confounded by differential rates of metabolic and vascular adaptations.
Materials and methods
Animals and diet
All protocols were approved by the Animal Use and Care Committee at the University of Utah. Ten-week-old male C57BL/6J mice were purchased commercially (Jackson Laboratories, Bar Harbor, ME, USA), and housed under controlled temperature (22°C), light (06:00–17:59 h), and dark (18:00–05:59 h) conditions. Animals were allowed ad libitum access to water and standard chow containing (kcal%) 13% fat, 53% carbohydrate and 34% protein (#8656, Harlan Teklad, Denver, CO, USA; CON, n = 32). After a one-week quarantine period, mice continued the CON diet (n = 16) or were switched to chow containing (kcal%) 45% fat, 35% carbohydrate and 20% protein (D12451, Research Diets Inc; HF, n = 16). After 98 ± 5 days on the respective diets, cardiovascular variables were assessed in the fed and fasted condition in one cohort of seven CON and seven HF mice, while blood sampling, body composition, metabolic variables and urine collection procedures were performed in a second cohort of five CON and five HF mice.
Cardiovascular variables
Mice were anesthetized using 2–5% isoflurane. Using aseptic techniques, the abdomen was opened and a transmitter (model PA-C10, Data Sciences International, St Paul, MN, USA) was inserted and secured in place to allow ambulation with minimal hindrance. A catheter attached to the transmitter then was advanced subcutaneously and inserted into the right common carotid artery. Thirty second averages of systolic, diastolic and mean arterial blood pressure (MAP; mmHg) and HR (beats/min) were recorded every 15 min for four consecutive 24-h periods starting ∼10 days postsurgery. 5,17,21–23 MAP and HR from the first three days were combined to represent fed values from the HF and CON mice. Fed values then were compared to the fourth day that contained the fasting segment from 16:00 to 08:00 h.
Blood sampling, body composition, metabolic variables and urinary catecholamines
Blood was obtained from a tail clip at ∼08:00 h from fed, conscious CON and HF mice to quantify serum leptin (Millipore/Linco, St Charles, MO, USA) and triglycerides (Sigma-Aldrich, St Louis, MO, USA). At least 24 h later, body composition (total body mass, fat mass and lean mass [g]) was assessed in fed CON and HF mice using dual energy X-ray absorptiometry (DEXA; pDEXA Sabre Bone Densitometer, Norland Medical Systems, Fort Atkinson, WI, USA) on lightly anesthetized mice (0.015–0.02 mL avertin/g body mass). 5 Three days later, VO2 (mL/kg h), heat production (kcal/kg h), respiratory exchange ratio (RER), locomotor activity (beam breaks; X + Y + Z planes), food ingestion (g) and water intake (mL) were measured in mice housed individually in metabolic chambers (Oxymax; Columbus Instruments, Columbus, OH, USA) for 72 h. This duration consisted of familiarization (24 h) and data collection (24 h) periods wherein mice consumed their respective chow ad libitum, and a 24-h period that contained the fasting segment from 16:00–08:00 h. Body mass and rectal temperature (model TH-5; Physitemp, Clifton, NJ, USA) were measured prior to chamber entry (∼08:00 h on day 1), body mass was assessed before the fasting segment (∼16:00 h on day 2), and both variables again were recorded upon completion of the fasting period (∼08:00 h on day 3). Mice were returned to their original housing conditions and resumed their respective feeding regimen.
Ten days later, mice were housed individually for 72 h in cages designed specifically to collect urine. 22,23 This duration consisted of a familiarization (24 h) and data collection (48 h) period. Urine that accumulated in a vial containing 10 μL of 6 mol/L HCl was recovered at ∼08:00 h on days 1–3, and was stored at −80°C until all samples could be analyzed simultaneously. Urinary epinephrine (ng/μL) and norepinephrine (ng/μL) were measured using the 2-CAT ELISA kit (Labor Diagnostika Nord, Nordhorn, Germany). Identical procedures were followed for all collections, except that food was removed at 16:00 h on day 3. When mice were removed from the urine collection chamber at the end of the fasting period (i.e. ∼08:00 h on day 3), blood samples were obtained from a tail clip to assess leptin and triglycerides. Next, mice were anesthetized deeply (3–5% isoflurane), their chest was opened, heart excised, and gonadal fat pad mass was assessed.
Data analysis and statistics
Comparisons were made: (1) within the CON and HF group (light phase versus dark phase and FED versus FAST conditions); (2) between the CON and HF groups at identical time points in the FED and FAST conditions; and (3) between the CON and HF groups concerning the magnitude of the fasting-induced response. To calculate the latter, FED values were subtracted from FAST values at identical time points. This number was divided by the FED value and represents the percent change due to fasting. Comparisons were made using a two-way analysis of variance with replication (Microsoft Excel 2007, Redmond, WA, USA). Significance was accepted when P < 0.05. All values in Figures 1–7 and Tables 1 and 2 are presented as mean ± standard error.
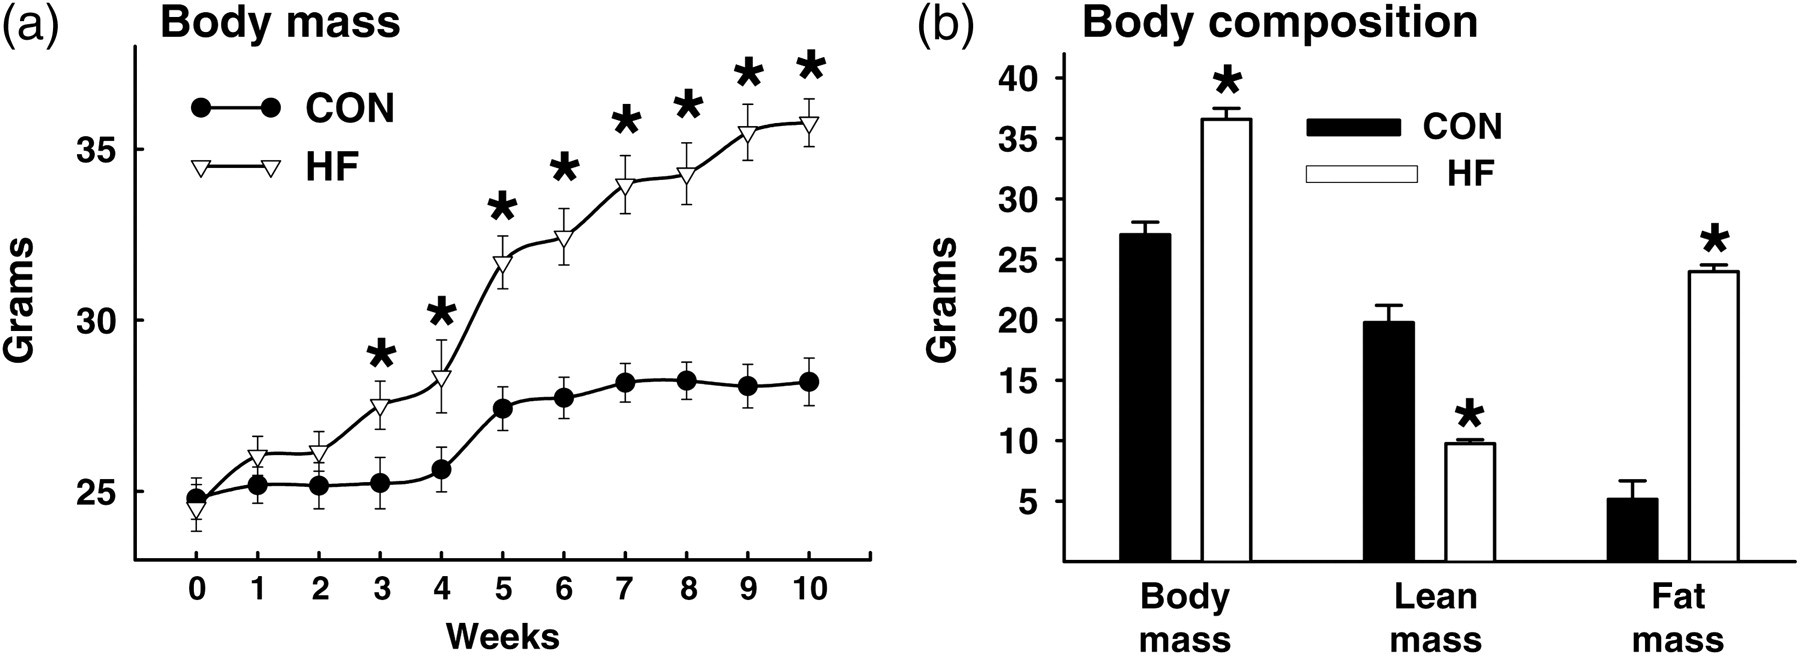
Body mass and composition of random-fed CON and HF mice. Body mass was greater (*P < 0.05) in HF versus CON mice after three weeks of feeding. (a) Body mass and fat mass were greater and lean mass was less in HF versus CON mice (all P < 0.05; (b) Values represent mean ± SEM. CON, mice that consumed standard chow; HF, mice that consumed high-fat chow
Urinary catecholamines and metabolic averages
Values are means ± SE. CON, mice that consumed standard chow; HF, mice that consumed high-fat chow
*P < 0.05 HF versus CON
† P < 0.05 FED versus FAST
‡ P < 0.05 light phase versus dark phase
Food and water intake, and urine output
Values are means ± SE. CON, mice that consumed standard chow; HF, mice that consumed high-fat chow
*P < 0.05 HF versus CON
† P < 0.05 FED versus FAST
‡ P < 0.05 light phase versus dark phase
Results
Animal characteristics
Body mass, gonadal fat pad mass and total fat mass were greater, while lean mass was less in HF versus CON mice (Table 1; Figure 1a and b). Fasting triglycerides (mg/dL) were higher in HF (39.8 ± 2.4) versus CON (23.2 ± 2.9) mice. Previously we showed this duration of HF feeding to similarly aged C57Bl6 mice impairs glucose tolerance, evokes hyperinsulinemia, increases free fatty acids and causes endothelial cell but not vascular smooth muscle cell dysfunction. 5,17
Cardiovascular responses
Twenty-four hour HR and MAP were elevated in HF versus CON mice during the FED period (Figure 2a and b). While HR and MAP decreased in response to fasting in both groups, the onset was ∼4 h sooner in HF (Figure 2c and d) versus CON mice (Figure 2e and f). The percent reduction induced by fasting (Δ) was similar between groups for HR (Figure 3a) and MAP (Figure 3b), although responses occurred sooner in HF animals.

Heart rate (HR) and mean arterial pressure (MAP) from CON and HF mice during the FED and FAST conditions. HR (a) and MAP (b) were elevated (*P < 0.05) in HF versus CON mice during the light and dark phases of the FED period. The fasting-induced reduction in HR (c, e) and MAP (d, f) occurred sooner (P < 0.05) in HF versus CON mice. FED values represent mean data from 3 × 24 h periods (i.e. days 1–3); FAST values represent an 1 × 24 period (i.e. day 4) that contains a fasting segment from ∼16:00 to ∼08:00. Spikes in HR and MAP evoked by room entry for cleaning (∼1100) and food removal/cage change (∼1600) were not included in the analyses. The ‘*’ indicates the time at which a sustained statistical difference between FED and FAST values was first observed. Values represent mean ± SEM. CON, mice that consumed standard chow; HF, mice that consumed high-fat chow
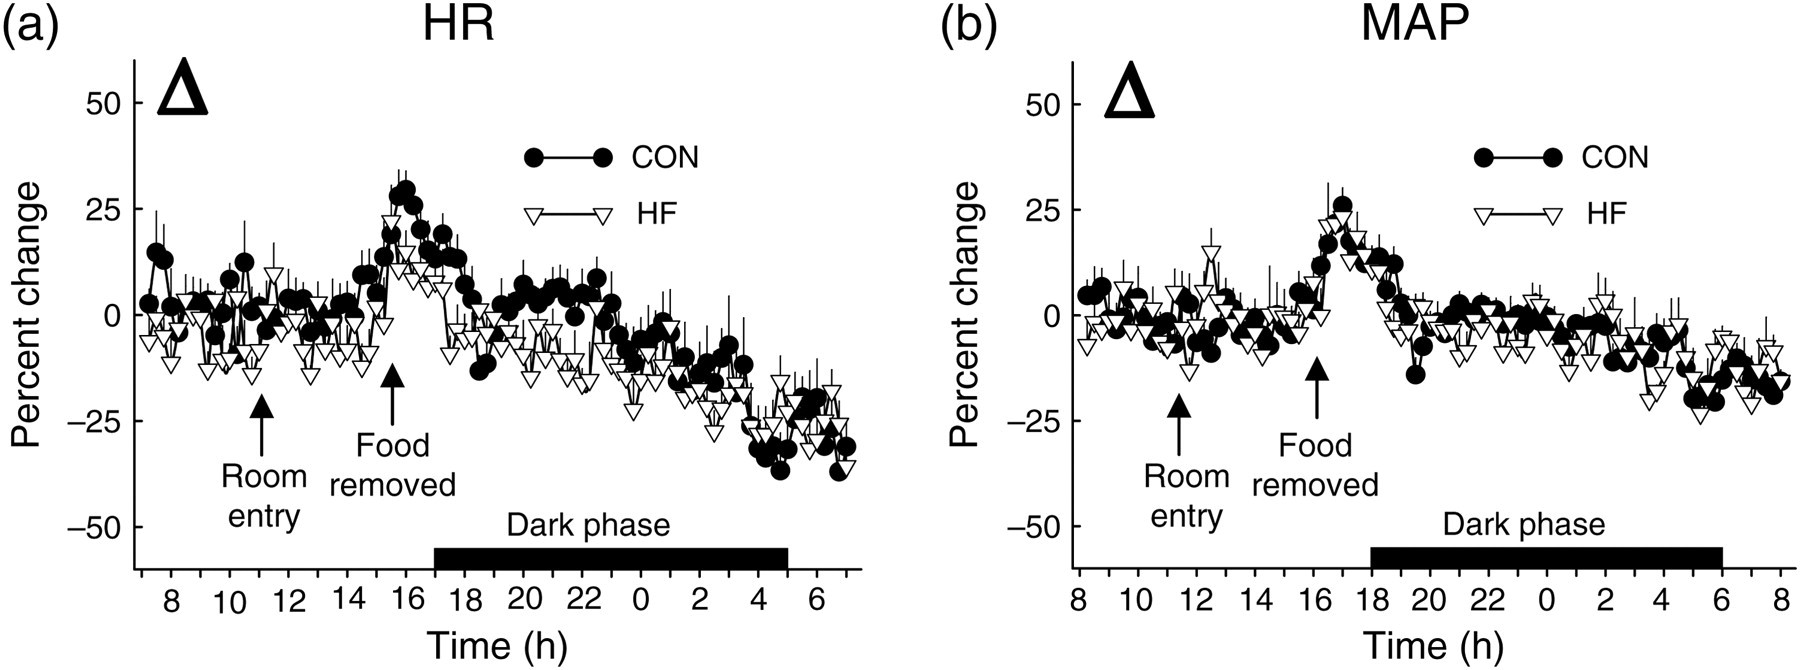
Fasting-induced decreases in heart rate (HR) and mean arterial pressure (MAP) compared between HF and CON mice. The overall fasting-induced percent change (Δ) in HR (a) and MAP (b) observed from 16:00 to 08:00 h was similar between CON and HF mice. Values represent mean ± SEM. CON, mice that consumed standard chow; HF, mice that consumed high-fat chow
Metabolic responses
Total 24-h VO2 and heat production were lower in HF versus CON mice during the FED period (Figure 4a and b; Table 1). While heat production and VO2 decreased in response to fasting in both groups, the onset was ∼7 h sooner in HF (Figure 4c and d) versus CON mice (Figure 4e and f). The overall percent reduction induced by a 16-h fast was similar between groups for heat production (Figure 5a) and VO2 (Figure 5b). As expected, RER was lower in HF versus CON mice in both FED and FAST conditions, regardless of diurnal phase, and fasting precipitated decreases of RER in all animals (Table 1; Figure 6a and b). Fasting-induced percent reduction of RER was greater in CON versus HF mice, which was not surprising considering the lower baseline (i.e. FED) RER in HF versus CON animals (Figure 6c). No differences were observed in the tempo of fasting-induced decreases of RER, indicating that the fasting-induced shift of substrate usage occurred similarly in lean and obese animals (Figure 6a and b). Average values for these variables for both groups during the light and dark phases are shown in Table 1.
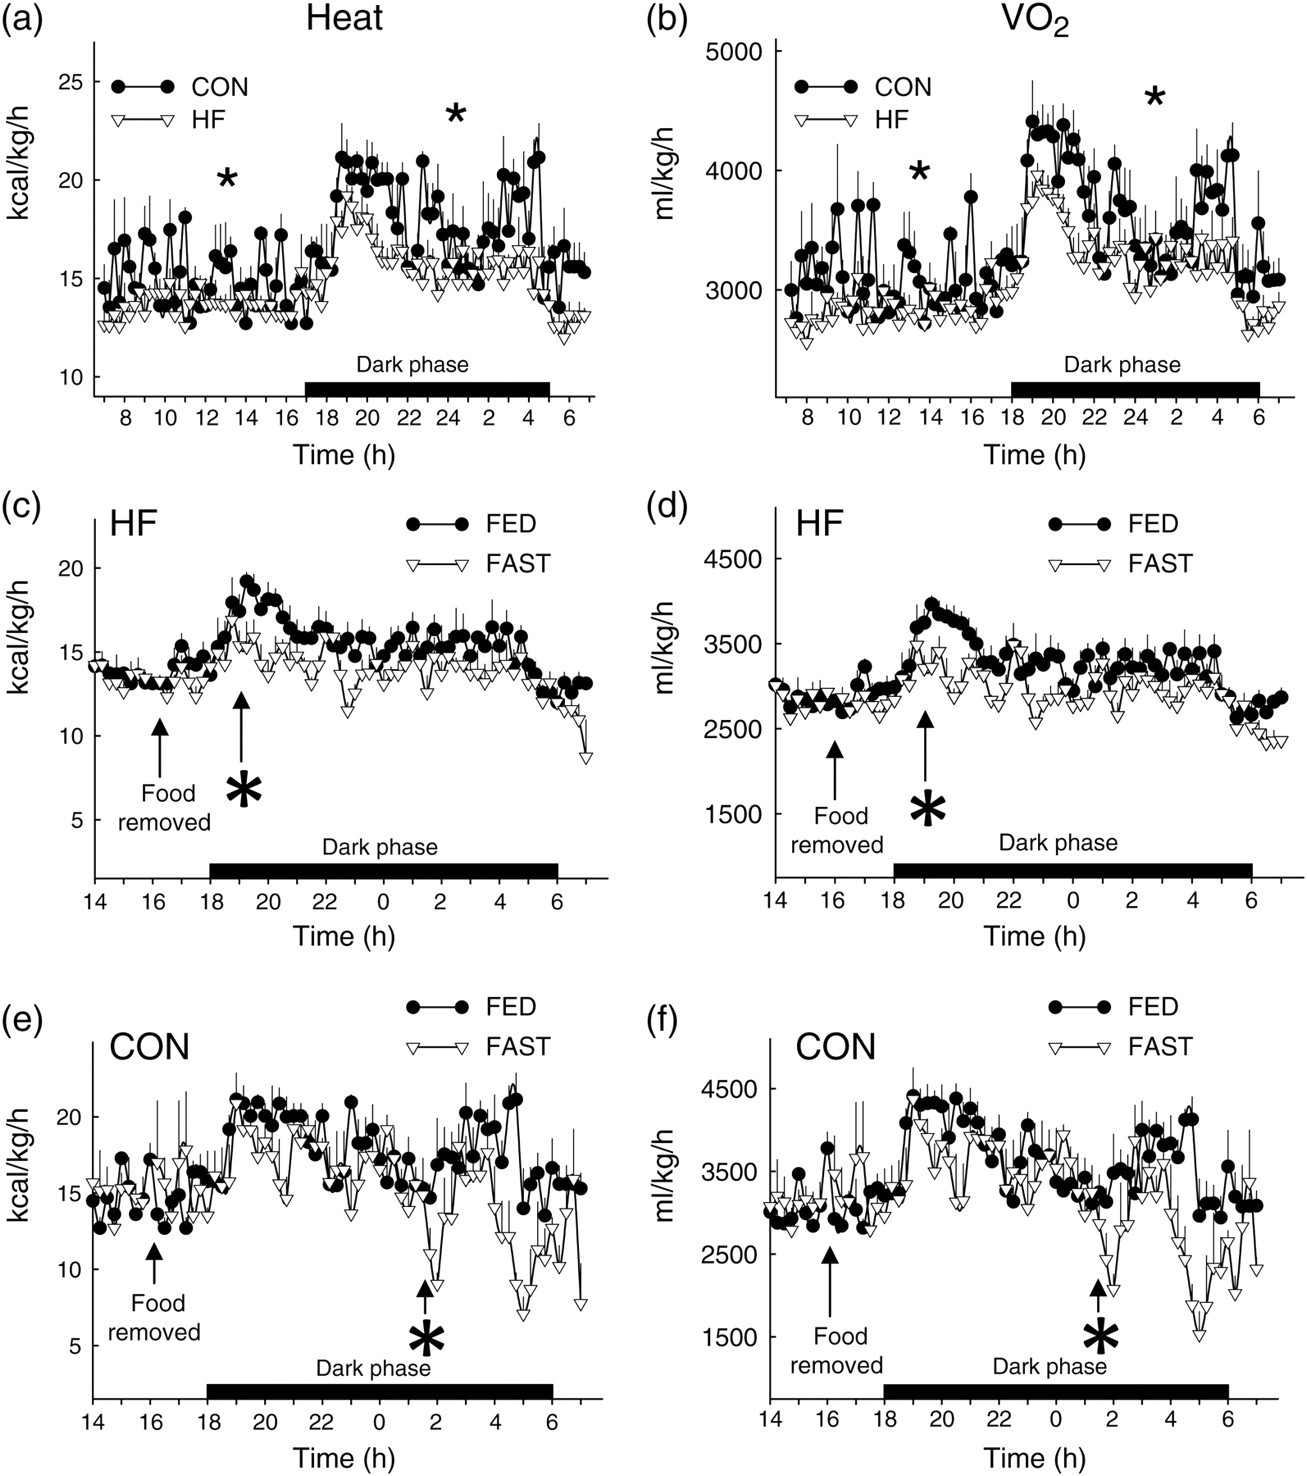
Heat production (HEAT) and oxygen consumption (VO2) from CON and HF mice during the FED and FAST conditions. Heat production (a) and VO2 (b) were lower (*P < 0.05) in HF versus CON mice during the light and dark phases of the FED period. The fasting-induced reduction in heat production (c, e) and VO2 (d, f) occurred sooner (*P < 0.05) in HF versus CON mice. FED values represent mean data from 2 × 24-h periods (i.e. days 1–2); FAST values represent an 1 × 24-h period (i.e. day 3) that contains a fasting segment from ∼16:00 to ∼08:00. The ‘*’ indicates the time at which a sustained statistical difference between FED and FAST values was first observed. Values represent mean ± SEM. CON, mice that consumed standard chow; HF, mice that consumed high-fat chow

Fasting-induced decreases in heat production (HEAT) and oxygen consumption (VO2) compared between HF and CON mice. The overall fasting-induced percent change (Δ) in heat production (a) and VO2 (b) observed from 16:00 to 08:00 h was similar between CON and HF mice. Values represent mean ± SEM. CON, mice that consumed standard chow; HF, mice that consumed high-fat chow
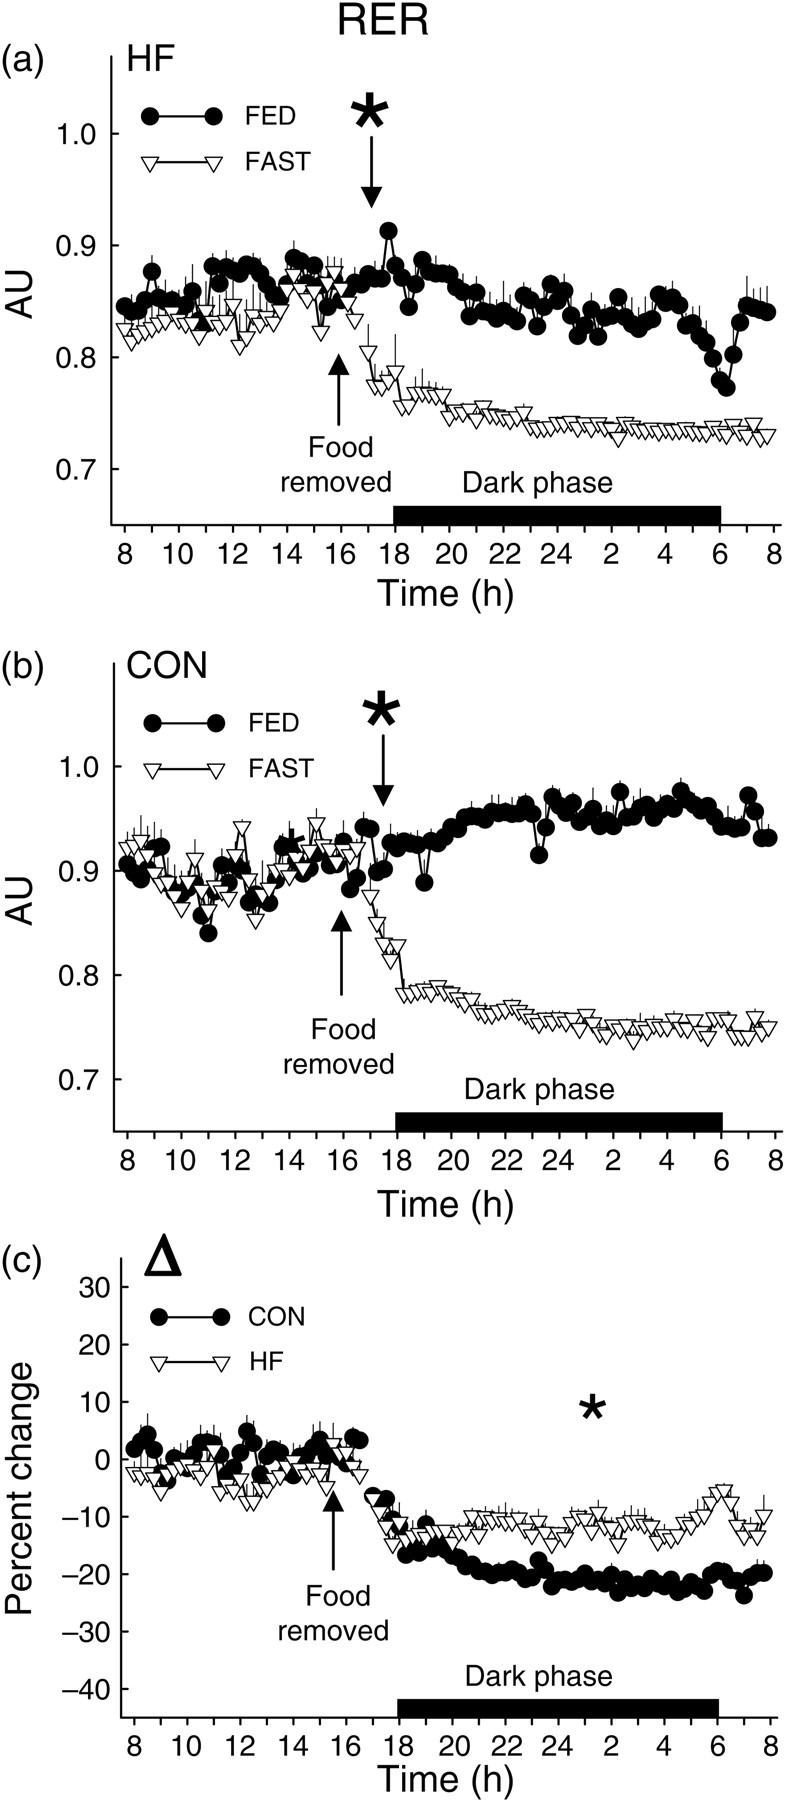
Respiratory exchange ratio (RER) from CON and HF mice during the FED and FAST conditions. The tempo of fasting-induced reduction of RER was not different between HF and CON mice (a, b). Noting the lower baseline (i.e. FED) RER in HF versus CON mice (a, b), it is not surprising that the overall fasting-induced percent change (Δ) in RER observed from 16:00 to 08:00 h on day 3 was greater in CON versus HF mice (c). FED values represent mean data from 2 × 24-h periods (i.e. days 1–2); FAST values represent an 1 × 24-h period (i.e. day 3) that contains a fasting segment from ∼16:00 to ∼08:00. The ‘*’ indicates the time at which a sustained statistical difference between FED and FAST values was first observed. Values represent mean ± SEM. CON, mice that consumed standard chow; HF, mice that consumed high-fat chow
Body temperature, food consumption, body mass and locomotion
Rectal temperatures (°C) during the FED (36.2 ± 0.3 and 36.3 ± 0.4) and at completion of the FAST (36.4 ± 0.3 and 36.5 ± 0.5) period were similar between HF and CON animals, respectively. Fasting-induced reductions in body temperatures of ∼2–5°C have been observed after six hours of fasting. 12,14,24 Therefore, it is curious that we did not observe differences after 16 h of food removal. One explanation is that temperature reductions were minimized/abolished because of increases in skeletal muscle activity secondary to animal restraint that was required to insert the rectal probe.
Food consumption, total caloric intake and calories consumed from fat, carbohydrate and protein were similar regardless of the diurnal phase (i.e. light versus dark) in HF mice. In contrast, all of these variables were greater in the dark versus light cycle in CON mice (Table 2). While HF mice consumed less food and fewer calories than CON mice during the dark phase, a larger portion of their calories consumed over 24 h was provided from fat, and a smaller portion from carbohydrates and protein (Table 2). No changes in body mass were observed after two days in the metabolic chamber (e.g. ad lib feeding; data not shown), but fasting (16:00–08:00 h on day 3) reduced body mass by 6.0 ± 0.4% and 12.5 ± 0.6% in HF versus CON mice, respectively (Figure 7a). HF mice accumulated more fat and body mass versus CON animals during their respective 14-week feeding regimens (Figure 1a and b) even though data obtained during the 72-h ‘snapshot’ of metabolic variables at 14 weeks indicated HF mice had less food consumption and caloric intake. While this paradox might partially be explained by decreased metabolic rate and activity in HF versus CON mice (Table 1), these findings are consistent with previous work done by Lin et al. 25 In that study, even though less energy was consumed by fat-fed versus lean mice at four weeks, body mass and adipose tissue mass continued to increase in the former group for an additional 11 weeks. Regarding locomotion, nocturnal (i.e. dark cycle) activity was lower in HF mice upon fasting, whereas fasting did not alter nocturnal activity in lean animals (Table 1).

Body mass and serum leptin in CON and HF mice during the FED and FAST conditions. Body mass (a) and serum leptin (b) were elevated (*P < 0.05) in HF versus CON mice during the FED and FAST periods. While fasting reduced († P < 0.05) leptin concentrations similarly between HF and CON mice, the fold reduction in body mass was ∼two-fold greater in CON versus HF mice. Values represent mean ± SEM. CON, mice that consumed standard chow; HF, mice that consumed high-fat chow
Water consumption, urine excretion and urinary catecholamines
In general, HF mice consumed less water and produced less urine per 24 h than CON animals during the FED and FAST period. Water consumption and urine production were less during the FAST versus FED period for both groups (Table 2). Urinary epinephrine and norepinephrine excretion were similar between HF and CON mice in the FED state. Urinary excretion of both catecholamines was lower in HF versus CON animals at the end of the FAST period (Table 1).
Leptin
Serum leptin was elevated in HF versus CON mice in both the FED and FAST conditions (Figure 7b). Compared to values obtained in the FED condition, fasting-induced reductions in leptin were similar between HF (82.4 ± 0.2%) and CON (86.0 ± 3%) mice.
Discussion
The independent effects of fasting 8,10,13,16,26 and diet-induced obesity 17,27–32 on cardiovascular and metabolic variables in rodents are well known. To our knowledge, specific comparisons of the tempo of fasting-induced reductions in cardiovascular and/or metabolic variables between lean and obese mice have not been made. We hypothesized that fasting would induce a smaller and/or delayed reduction in HR, BP, VO2 and heat production in obese versus lean mice because the absence of food would pose less of a stress in the former group of animals. Biotelemetry and metabolic chamber studies confirmed that HR and BP were higher, while oxygen consumption, heat production and locomotion were lower in obese versus lean mice in the fed condition. Further, each of these variables decreased in response to a 16-h fast at 22°C. In contrast to our hypothesis, the overall severity of the respective decreases was similar between groups. These data are important for investigators who use murine models of diet-induced obesity because they indicate that the degree of metabolic and cardiovascular adaptations to fasting were similar after 16 h in lean and obese mice.
Cardiovascular and metabolic data were collected at ∼15-min intervals and averaged hourly. These procedures allowed us to determine the time required for the onset of fasting-induced reductions to become evident, and whether differences existed between groups. Compared to the fed condition, fasting-induced reductions in HR and BP occurred ∼4 h earlier in obese versus lean mice. Likewise, VO2 and heat production became statistically lower ∼7 h earlier in HF versus CON animals. While the mechanisms responsible for these unexpected findings are unclear, several possible explanations including differences in gender, differential activation of the autonomic nervous system and altered leptin signaling will be discussed.
First, differences in sex may modulate metabolic responses to fasting. For example, Swoap et al. 12 reported that female mice are more likely to enter a state of fasting-induced torpor than male mice. However, gender cannot contribute to our findings because all animals were male. A second possible explanation involves the generalized fasting-induced depression of the sympathetic limb of the autonomic nervous system thought to exist in rodents. 13,33–37 We assessed overall activation of the sympathetic nervous system by measuring urinary epinephrine and norepinephrine following the fed and fasting periods. Fasting-induced reductions of urinary catecholamines occurred in HF but not in lean animals. While these data are consistent with the notion that overall sympathetic withdrawal existed to a greater degree in HF versus CON mice, the exact time when sympathetic activity became lower in HF versus CON animals cannot be discerned from our data. To accomplish this would have required serial blood sampling throughout the fasting period (rather than urine collection), which is difficult to do in an organism with a small blood volume, i.e. 4% of body weight, 38 without influencing baroreceptor function. As such, without accurate serial assessment of sympathetic and/or parasympathetic activity, we cannot state with certainty whether differential activation of the two limbs of the autonomic nervous system contributed to earlier reductions in cardiovascular and metabolic variables in obese versus lean mice.
A third possibility that merits consideration for why reductions in cardiovascular and metabolic variables occurred sooner in HF versus CON mice is that central and/or peripheral leptin resistance might have developed in the former group of animals. The hormone leptin is secreted in proportion to fat stores. Decreased food intake (e.g. fasting or starvation) results in decreased serum leptin concentration and subsequent decreases in energy expenditure. 39 This effect is mediated primarily via leptin signaling in the hypothalamus (i.e. centrally). 40
We do not believe central leptin resistance existed in HF versus CON mice in the present study. Support for this statement is our observation that HF mice, while continuing to gain weight, consumed fewer calories (Figure 1a and b; Table 2). These observations are similar to those reported by Lin et al. 25 In that study even though less energy was consumed by fat-fed versus lean mice after four weeks of feeding, body mass and adipose tissue mass continued to increase in the former group for an additional 11 weeks. The authors concluded that hypophagia in the high-fat-fed group likely resulted from an attempt to regulate the rate of adipose tissue accumulation via intact hypothalamic/central leptin signaling. Accelerated decreases in HR and BP in HF versus CON mice could also be the result of an attempt to regulate energy expenditure via leptin signaling, and thus also suggests intact leptin sensitivity centrally and/or peripherally. However, because neither central nor peripheral leptin signaling was assessed directly in the present study, we cannot state with certainty that the tempo of reductions in VO2, heat production, BP and HR in obese mice was hastened by factors related to leptin resistance.
The ability to make accurate comparisons between lean and obese mice after they have been fasted might be jeopardized if fasting poses a greater/lesser stress on one group versus another. Our findings indicate that the severity of cardiovascular and metabolic stress evoked by a 16-h fast at 22°C is similar among lean and obese mice. These data indicate that a 16-h fast is a suitable period after which to study vascular function in models of diet-induced obesity. We also observed that the tempo of fasting-evoked reductions in cardiovascular and metabolic variables is hastened in obese versus lean animals, although shifts in substrate usage (i.e. from carbohydrate to fat) were not. As such, shorter-term periods of fasting could be confounded by differential rates of metabolic and vascular adaptations, and should be taken into consideration when designing experimental protocols.
Footnotes
Acknowledgements
The assistance of Dr Robert Cooksey and Deborah Jones (metabolic chambers), and Dr Andreas Rohrwasser and Elaine Hillas (arterial telemetry) is greatly appreciated. Student support was provided, in part, by the Western States Affiliate of the American Heart Association Summer Student Research Program, the American Physiological Society and the University of Utah Undergraduate Research Opportunities Program. This work was funded, in part, by the University of Utah College of Health, the University of Utah Research Foundation, American Heart Association Western States Affiliate Grant-In-Aid 06-55222Y, NIH HL 091493-01, and American Diabetes Association Research Grant 7-08-RA-164 (JDS).