
Abstract
Telomerase reverse transcriptase (TERT) is fundamental in determining the life span by regulating telomere length of chromosomes. To address the question whether the enhancement of the proliferative potential hampers cell differentiation, we generated TERT-over-expressing endothelial cells (ECs) and analyzed in vitro their (1) barrier function; (2) low-density lipoprotein uptake; (3) expression pattern of six selected marker proteins; (4) angiogenic potential in four assays; and (5) inflammatory responses. In contrast to investigations with focus on other cell parameters, we demonstrate that immortalization of ECs by over-expression of TERT resulted in different angiogenic and inflammatory behavior in comparison to cells with low native telomerase levels.
Introduction
The inner lining of all blood vessels is formed by endothelial cells (ECs), which are involved in elementary physiological functions such as endothelial barrier function and inflammation (reviewed in ref. 1 ). Moreover, vascular ECs play an important role in the development of vascular system-related diseases such as atherosclerosis. 2 One possible factor in these pathological events is aging of the endothelium, which is accompanied by vascular remodeling, limited vascular repair, endothelial dysfunction and diminished angiogenesis. 3
ECs undergo cell senescence and lose specific distinct endothelial functions. Senescence of cells is caused, among other things, by the shortening of chromosome ends, called telomeres. 4 Telomerase, a ribonucleoprotein complex, and its catalytic subunit TERT (telomerase reverse transcriptase) elongates telomeres by the addition of a repeated DNA sequence (TTAGGG), leading to retardation of chromosome destabilization. 5 However, the majority of human somatic cells either lack or display only low levels of TERT activity. 6 In contrast, embryonic and adult stem cells as well as tumor cells show high TERT expression levels, 7 suggesting that telomerase activity is inversely correlated with the differentiation potential.
To elucidate endothelial functioning, immortalized cell lines have been employed despite the loss of essential endothelial markers. 8 De-differentiation and functional loss have been reported in studies using SV40 large T antigen-over-expressing ECs. 9 In contrast, several studies have suggested that telomerase-over-expressing ECs do retain endothelial characteristics, lineage specificity and cell behavior. 10–17 Likewise, bovine microvascular ECs appeared to be unaffected by human telomerase reverse transcriptase (hTERT) over-expression. 15 Since we are interested in the mutual impact of cell differentiation and telomerase activity, we generated an hTERT-over-expressing human coronary artery endothelial cell (hCAEC) line. Most interestingly, a comparative characterization of telomerized hCAECs and the corresponding native progenitor cells revealed various functional differences with regard to angiogenic and inflammatory responses, indicating that hTERT over-expression clearly affected EC characteristics, which is in contrast to earlier reports.
Materials and methods
Cell culture
Primary (PromoCell, Heidelberg, Germany) and immortalized hCAECs were both cultured in EC growth medium MV (ECGM MV) plus supplement mix (both PromoCell), 50 U/mL penicillin-G and 50 μg streptomycin in a humidified atmosphere (95% air/5% CO2) at 37°C. Primary hCAECs were used from passages 2–8 and hCAEC-hTERT were used from passages 12–25 (200 div). To passage ECs, the DetachKit (PromoCell) was used according to the manufacturer's recommendations. In addition, hTERT-transduced hCAECs were supplemented with 100 μg/mL G418 to maintain the purity of the transduced hCAECs. The cultures were used for subsequent assays when ECs reached confluence (5–7 d). G418 treatment for hTERT ECs was discontinued 24 h before the experiments.
Human skin fibroblasts (gift of L Grupp, NMI, Reutlingen, Germany) were grown in Dulbecco's modified Eagle's medium (Life Technologies, Karlsruhe, Germany) supplemented with 50 U/mL penicillin, 50 mg streptomycin, 2 mmol/L
Immortalization
Retroviral transduction was performed to achieve immortalization of the ECs. In this process we transfected subconfluent Phoenix Ampho B cells (gift of S Glock, NMI, Reutlingen, Germany) with the pQTERT plasmid for six hours using Lipofectamin™ reagent (Invitrogen, Karlsruhe, Germany). Phoenix Ampho B cells produced virus-containing supernatant one day after transfection. Target ECs in low passages were infected with virus-containing supernatant twice a day for two days.
Homogeneous cultures of hTERT-transduced hCAECs were obtained by treating transfected ECs with G418. An internal ribosomal entry site (Figure 1A) within the expression vector allowed co-translation of the target gene and a neomycin resistance gene. G418 (200 μg/mL) was added to (the normal) ECGM MV three days after the last infection to select for hTERT-transduced hCAECs. Whereas primary hCAECs died within 14 d in the presence of 200 μg/mL G418, pure hTERT–hCAEC cell cultures survived two weeks. Culture purity was maintained by adding 100 μg/mL G418 to the normal ECGM MV medium of hTERT–hCAECs.
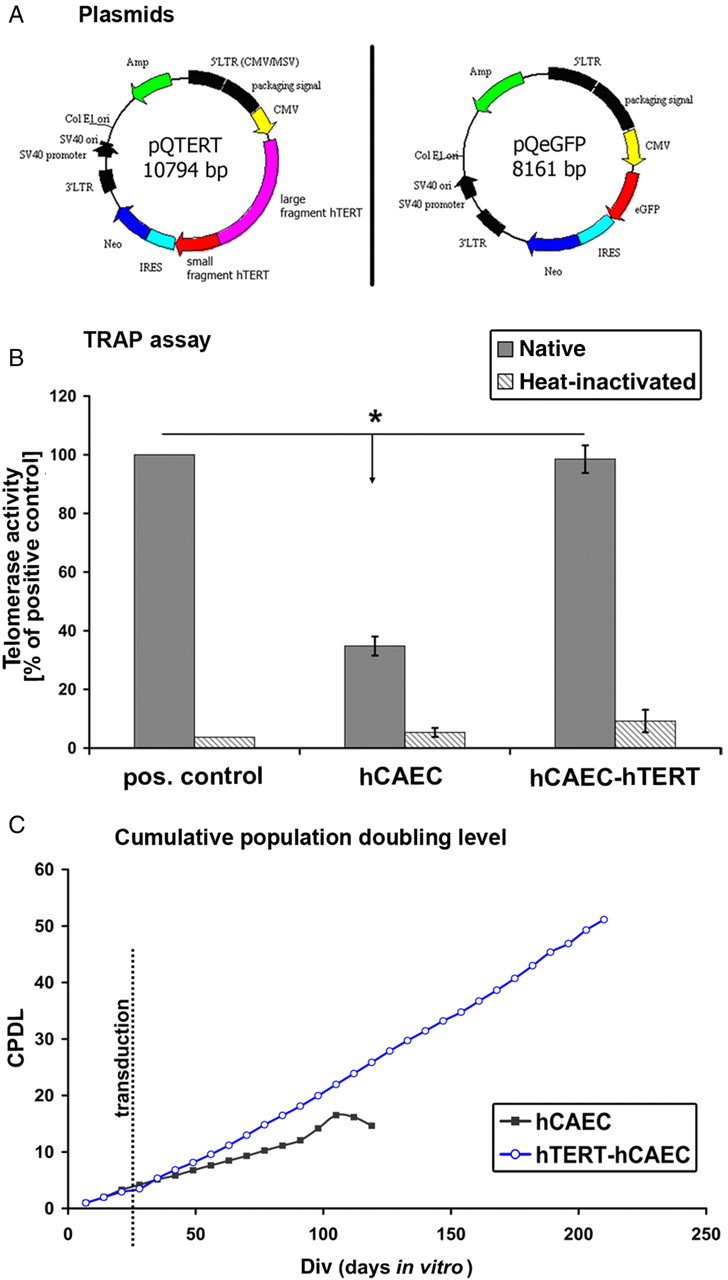
Plasmid structures and human telomerase reverse transcriptase (hTERT) transfection. Plasmid pQTERT (A, left panel) and the control plasmid pQeGFP (A, right panel). Plasmids contained two selection resistance genes for (1) ampicillin (AMP, bacterial selection) and (2) neomycin (Neo, eukaryotic cell selection). The expression of either hTERT or enhanced green fluorescent protein (eGFP) sequences was regulated by the internal CMV promoter (CMV = cytomegalovirus promoter). Both sequences were inserted into the multiple cloning site. Both plasmids contain an internal ribosomal entry site (IRES), which induces a co-translation of neomycin resistance and the target genes. Segments in black (5’LTR, 3’LTR, etc.) control virus translation and packaging of the plasmid-containing viruses. (B) TRAP assay. Results of the TRAP assay are normalized to a positive control. Human coronary artery endothelial cells over-expressing human telomerase reverse transcriptase (hCAEC-hTERT) displayed strong telomerase activity comparable to that of the positive control (pos. control), whereas naïve hCAECs had significant lower activity levels. No hTERT activity was detected after heat inactivation. (C) Cumulative population doubling level (CPDL) describes the life span of cells in culture. Primary hCAECs displayed stable CPDL until about 100 d in vitro (div). In contrast, hTERT-transduced hCAECs had unlimited (still ongoing) stable CPDLs. (*marks significance to positive control with P < 0.05) (A color version of this figure is available in the online journal)
Telomeric repeat amplification protocol assay
To analyze the over-expression of human telomerase in transduced ECs, we performed a telomeric repeat amplification protocol (TRAP) assay using the ‘Telo TAGGG Telomerase PCR ELISA’ kit (Roche, Penzberg, Germany) as described previously.
Permeability assay: fluorescein isothiocyanate-dextran flux across EC monolayers
Permeability measurement with a confluent EC monolayer on filter membranes as an interface between an upper and a lower culture chamber (Figure 2A) was performed as described previously. 18
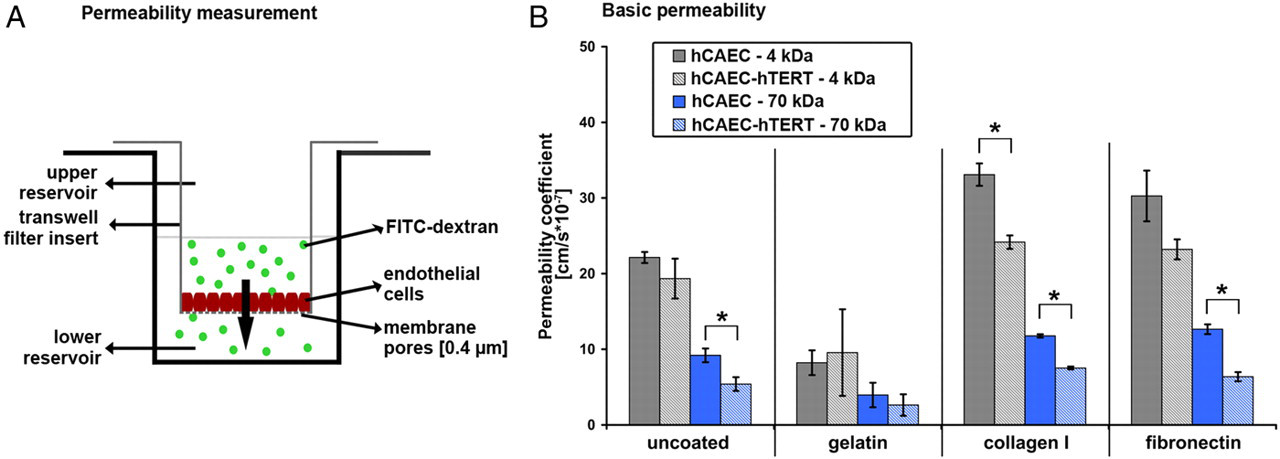
Barrier characteristics of cell monolayers. Experimental layout (A). Permeability measurements of 4 and 70 kDa fluorescein isothiocyanate (FITC)-dextran across monolayers of primary and human telomerase reverse transcriptase (hTERT)-transduced human coronary artery endothelial cells (hCAECs) grown on different extracellular matrix (ECM) components on transwell filters (B). Minor differences could be detected between the two cell types. After one hour, cells grown on gelatin showed lower permeability coefficients than those grown on the other surface coatings. (* marks significance between naïve and telomerized cells P < 0.05) (A color version of this figure is available in the online journal)
Uptake of low-density lipoprotein DiI-Ac-LDL
ECs were grown to confluence for 5–7 d on gelatin-coated 48-well plates for immunofluorescence and fluorescent-activated cell sorting (FACS) analysis. On the day of analysis, the cells were incubated with 10 μg/mL DiI-Ac-LDL in ECGM MV for four hours at 37°C and 5% CO2. 19 Afterwards, the cells were washed thoroughly with Hanks' Balanced Salt Solution (HBSS) and examined by fluorescence microscopy using a rhodamine filter (550 nm) (Axiovert, Carl Zeiss, Oberkochen, Germany). For FACS analysis, cells were trypsinized after DiI-Ac-LDL incubation, resuspended in HBSS and analyzed by FACS (FC500, Beckman Coulter, Krefeld, Germany). Measurements were performed at 514/550 nm.
FACS analysis of endothelial antigens
Cells (5 × 10⁴) were seeded in gelatin-coated T75 flasks and grown to confluence for 5–7 d. For FACS analysis, the cells were trypsinized, fixed with 2% paraformaldehyde, permeabilized and blocked with 1% bovine serum albumin (BSA)/0.1% Triton X-100 in phosphate-buffered saline (PBS) for 15 min. Primary and secondary antibodies (Table 1) were diluted in 1% BSA/0.1% Triton X-100 in PBS and incubated for 60 min at room temperature (RT) with 1 × 10⁵ cells. Afterwards, cell labeling was monitored using FACS (FC500, Beckman Coulter), counting 10,000 events per probe. Results were analyzed using CXP software (Beckman Coulter).
Antibodies. Primary and secondary antibodies and their applications/dilutions for the different analytical methods (immunofluorescence [IF], Western blotting [WB] and fluorescence-activated cell sorting [FACS]) are listed
vWF, von Willebrand factor; VEGFR‐2, vascular endothelial growth factor receptor 2; VE‐cadherin, vascular endothelial cadherin; PECAM-1, platelet endothelial cell adhesion molecule 1; ICAM-1, intercellular adhesion molecule 1; VCAM-1, vascular endothelial cell adhesion molecule 1
Migration assay
Cells (2 × 10⁴) resuspended in 200 μL ECGM MV (±suramin/VEGF) (Table 2) were seeded onto the inserts of transwell filters for 24-well plates (8 μm pore size, Corning, Darmstadt, Germany) and allowed to adhere to membranes for two hours. Afterwards, 600 μL medium (±test substances) was added to each bottom well and incubated overnight at 37°C and 5% CO2. The filters were then rinsed with PBS and fixed in 4% paraformaldehyde for 15 min at RT. The top side of the membrane was cleansed using prewetted cotton swabs. Subsequently, cell nuclei on the lower side of the filter membrane were stained with 4, 6‐diamidino‐2‐phenylindol (DAPI; Sigma‐Aldrich, St Louis, MO, USA) for 10 min and rinsed with PBS. The membrane was viewed with a fluorescence microscope (Axiovert, Carl Zeiss, Oberkochen Germany), and five randomly selected areas of the lower filter surface were documented.
Materials. Materials with used concentrations and expected effect
Tube formation
Forty-eight-well plates were covered with 100 μL of a 10 mg/mL Matrigel™ – medium dilution (Matrigel™ Basement Membrane Matrix, BD Biosciences, Bedford, MA, USA) and incubated at 37°C until gel formation took place. Then 1.5 × 10⁴ cells were seeded on top of the Matrigel™ gel. Analysis was performed as described previously. 18
FACS analysis of intercellular adhesion molecule 1 and vascular endothelial cell adhesion molecule 1 upregulation
ECs (2 × 10⁴) were seeded in gelatin-coated and cross-linked 48-well plates and grown to confluence for seven days. On the day of analysis, cells were incubated for four hours with 10 ng/mL tumor necrosis factor alpha (TNF‐α) in ECGM MV. After this, the cells were trypsinized using 0.1 % EDTA in PBS, centrifuged and washed with 0.1% NaN3 in PBS. The ECs were then incubated with fluorescence-labeled intercellular adhesion molecule 1 (ICAM-1) and vascular endothelial cell adhesion molecule 1 (VCAM-1) antibodies (Table 1) diluted in 3% BSA/0.1% NaN3 in PBS for 45 min at RT. After incubation the cells were centrifuged, washed with 0.1% NaN3 in PBS and immediately analyzed by FACS (FC500, Beckman Coulter), counting 3000 events per probe. Results were analyzed using CXP software (Beckman Coulter).
Impedance measurements
An electric cell substrate impedance-sensing set-up (ECISZΘ, Applied BioPhysics Inc, Troy, NY, USA) was used to measure and analyze the transendothelial electrical resistance (TER) of cell monolayers as described previously. 20 ECs were grown on a gelatin-coated and cross-linked electrode array for 5–7 d until they reached confluence. On the day of analysis ECGM MV was exchanged (350 μL) and baseline TER was measured for one hour. Subsequently, 50 μL ECGM MV ± test substances were applied to the cells.
Co-culture/in vitro angiogenesis model
Human ECs and skin fibroblasts (each 3 × 10⁴) were mixed and seeded into 24-well plates in ECGM MV (±test substances). This cellular co-culture was incubated for seven days at 37°C and 5% CO2 in a humidified atmosphere. Medium (±test substances) was replaced three times a week. On day 7 of co-culture, cells were washed with PBS, fixed with 2% paraformaldehyde (pH 7.4) for five minutes at RT, treated with 0.1% Triton X-100 and blocked with 3% BSA in PBS. Primary antibody (vascular endothelial [VE]-cadherin) diluted in 1% BSA/PBS was added and the cell–antibody mixture was incubated for 24 h at 4°C. Secondary antibody (1:300, Cy3-labeled, Dianova, Hamburg, Germany) was added, followed by incubation for one hour at RT. In addition, cell nuclei of fixed cells were visualized by incubation with DAPI. The wells were covered with PBS and examined microscopically (Axiovert, Carl Zeiss, Oberkochen, Germany).
Immunocytochemistry and Western blotting
ECs were seeded on gelatin-coated and cross-linked cover slips and grown to confluence for 5–7 d. Assays were performed as described previously 18 using the antibodies listed in Table 1.
Statistics
Results are depicted throughout as means ± standard error. Statistical analysis was performed using PRISM (GraphPad Software, La Jolla, CA, USA), Student's t-test and non-parametric Mann-Whitney test statistics. Statistical significance was set at P < 0.05. All experiments were performed three times in duplicate or triplicate.
Results
Overexpression of active hTERT in hCAECs
Viral infection of primary hCAECs was monitored optically using the pQeGFP plasmid (Figure 1A, right panel). We were able to detect a clear enhanced green fluorescent protein (eGFP) expression in more than 25% of all hCAECs two days after viral infection (data not shown). No eGFP signal could be detected in primary or control transduced hCAECs. To determine the expression of active hTERT in transduced hCAECs, we performed polymerase chain reaction-enzyme-linked immunosorbent assay combined TRAP assays (Figure 1B). Probes of hTERT-transduced hCAECs displayed hTERT activity similar to that of positive controls (98.5 ± 4.7% of positive control). As expected, primary hCAECs displayed only diminished levels (34.7 ± 3.2% of positive control). We verified the specificity of these results by analyzing heat-inactivated probes. Heat inactivation (85°C for 10 min) of all probes resulted in nearly complete loss of hTERT activity (Figure 1B). These data clearly demonstrate that viral transfection of hCAECs with the hTERT plasmid led to an over-expression of active and functional hTERT.
In addition, growth behavior analyses of primary and hTERT-transduced hCAECs showed that hTERT-transduced hCAECs have maintained linear cumulative population doubling levels (CPDLs) for nearly 200 d to date, whereas primary hCAECs displayed linear CPDLs for only 100 d, after which they started to de-differentiate and die (Figure 1C). In contrast, hTERT–hCAECs displayed no morphological changes during the cultivation period (see below).
hTERT-transduced hCAECs display intact endothelial barrier functions on gelatin coating
Endothelial barrier function of primary and hTERT-transduced hCAECs was analyzed by quantifying fluorescein isothiocyanate-dextran flux (MW 4 and 70 kDa) across endothelial monolayers grown on different substrates and calculating the resulting permeability coefficient (P E) (Figure 2A). Both primary and hTERT-transduced hCAECs displayed low and comparable P E when cultured on gelatin-coated filters. However, cultivation of both hCAECs resulted in different and diminished endothelial barrier properties when they were grown on other extracellular matrix proteins like collagen I or fibronectin, as indicated by higher P E values (Figure 2B). These analyses demonstrated that primary and hTERT-transduced hCAECs showed comparable barrier properties when cultured on gelatin coatings but slightly diminished barrier function on other coatings.
Unaffected acetylated low-density lipoprotein (DiI-Ac-LDL) uptake and endothelial marker expression
Whereas ECs take up acetylated LDL, fibroblasts do not. We analyzed the uptake of DiI-labeled Ac-LDL by immunofluorescence microscopy (Figure 3A) and FACS (Figure 3B). DiI-Ac-LDL staining was detected in the perinuclear regions of living primary and hTERT-transduced ECs (Figures 3Aa and Ac) in a punctuate pattern (Figures 3Ab and Ad). FACS analyses revealed >98% DiI-Ac-LDL-labeled telomerized and naive hCAECs whereas fibroblasts were not labeled. These data clearly demonstrate that nearly all of both types of ECs displayed similar strong Ac-LDL uptake.
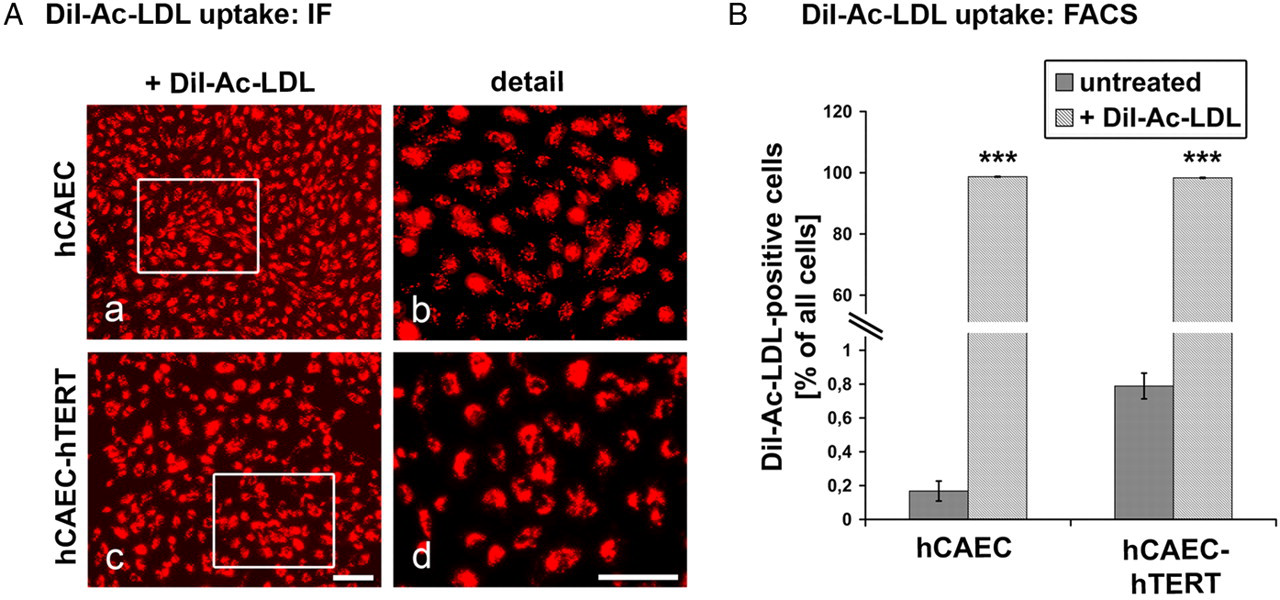
DiI-Ac-LDL uptake. Endothelial cell (EC) monolayers were treated with fluorescent DiI-Ac-LDL (red) and microscopically analyzed (A). Caged areas are enlarged in the same row, right column. Both human coronary artery endothelial cell (hCAEC) types showed a homogenous pattern of DiI-Ac-LDL labeling (a, c). Detailed visualization revealed a punctuate pattern in perinuclear regions (b, d). Fluorescence-activated cell sorting (FACS) analysis (B) resulted in more than 98 % positive primary and immortalized hCAECs after DiI-Ac-LDL labeling. (Note: the y-axis representing several orders of magnitude; *marks significance to untreated cells with P < 0.05; scale bars: 400 μm, enlarged details: 100 μm) (A color version of this figure is available in the online journal)
To make sure that over-expression of hTERT did not influence the expression of endothelial markers, we verified the expression of several relevant endothelial proteins by immunofluorescence microscopy (Figure 4A), Western blotting (Figure 4B) and FACS analysis (Figure 4C). von Willebrand factor (vWF)-specific punctuate pattern staining was evident in almost all cells of both cell types (Figures 4Aa and Ag). Moreover, both Western blotting (Figure 4B) and FACS analysis (Figure 4C) revealed vWF immunoreactivity. In addition, we detected vascular endothelial growth factor receptor 2 (VEGFR‐2) and Tie-2 (a receptor for angiopoetin) with all three methods (Figures 4Ab, Ah, Ae and Ak; Figures 4B–C). We also verified VE-cadherin (Figures 4Ad and Aj), claudin 5 (Figures 4Ac and Ai) and platelet endothelial cell adhesion molecule 1 (PECAM-1) (Figures 4Af and Al), all typical intercellular adhesion molecules. These three adhesion molecules displayed junctional localization only at points of direct intercellular contact (arrows in Figure 4A), underlining their important role in adhesion formation.
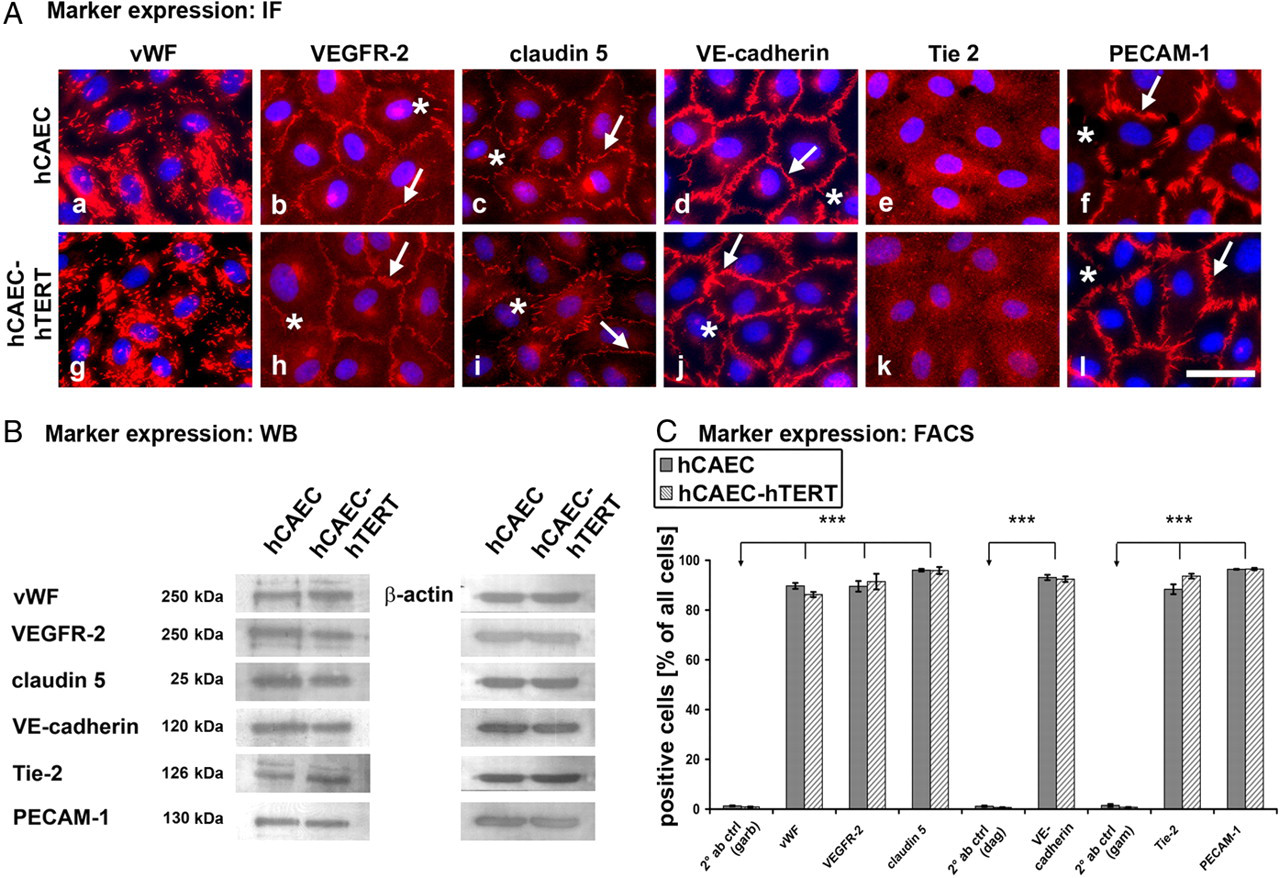
Cell type-specific antigen expression. Endothelial marker expression analysis by immunofluorescence microscopy (A), Western blotting (B) and fluorescence-activated cell sorting (FACS) (C). (A) Immunofluorescence microscopy displayed punctual von Willebrand factor (vWF) (a, g) and diffuse Tie-2 (e, k) staining. Vascular endothelial growth factor receptor 2 (VEGFR-2) was localized at cell borders and in clusters on cellular surface (b, h). Adhesion molecules (claudin 5, vascular endothelial [VE]-cadherin, platelet endothelial cell adhesion molecule 1 [PECAM-1]) were detected exclusively at the cell contact sites (arrows) of endothelial cell (ECs) excluding intercellular gaps (asterisk). (B) Western blot analysis verified the immunofluorescence data. FACS analysis (C) showed that both human coronary artery endothelial cell (hCAEC) cell types expressed high levels of all these endothelial markers, with more than 85% being positive. (*marks significance to specific 2° antibody control (Table 1); scale bars: 50 μm) (A color version of this figure is available in the online journal)
These data indicate that over-expression of hTERT does not influence the expression of typical endothelial markers.
Angiogenic potential of hTERT-transduced hCAECs
The effect of angiogenesis-inducing factor vascular endothelial growth factor (VEGF) on endothelial barrier function was quantified by measuring the TER of cells cultured on specific microelectrode arrays of the ECIS system (Figure 5A). The application of VEGF resulted in a transient endothelial barrier breakdown within 3.75 h in hTERT–hCAECs and within 4.9 h in primary hCAECs (80.8 ± 2.7% and 83.4 ± 2.4% of baseline TER, respectively) which persisted for nearly 25 h in primary hCAECs. In contrast, in hTERT–hCAECs the re-establishment of the endothelial barrier was observed at 37.75 h.
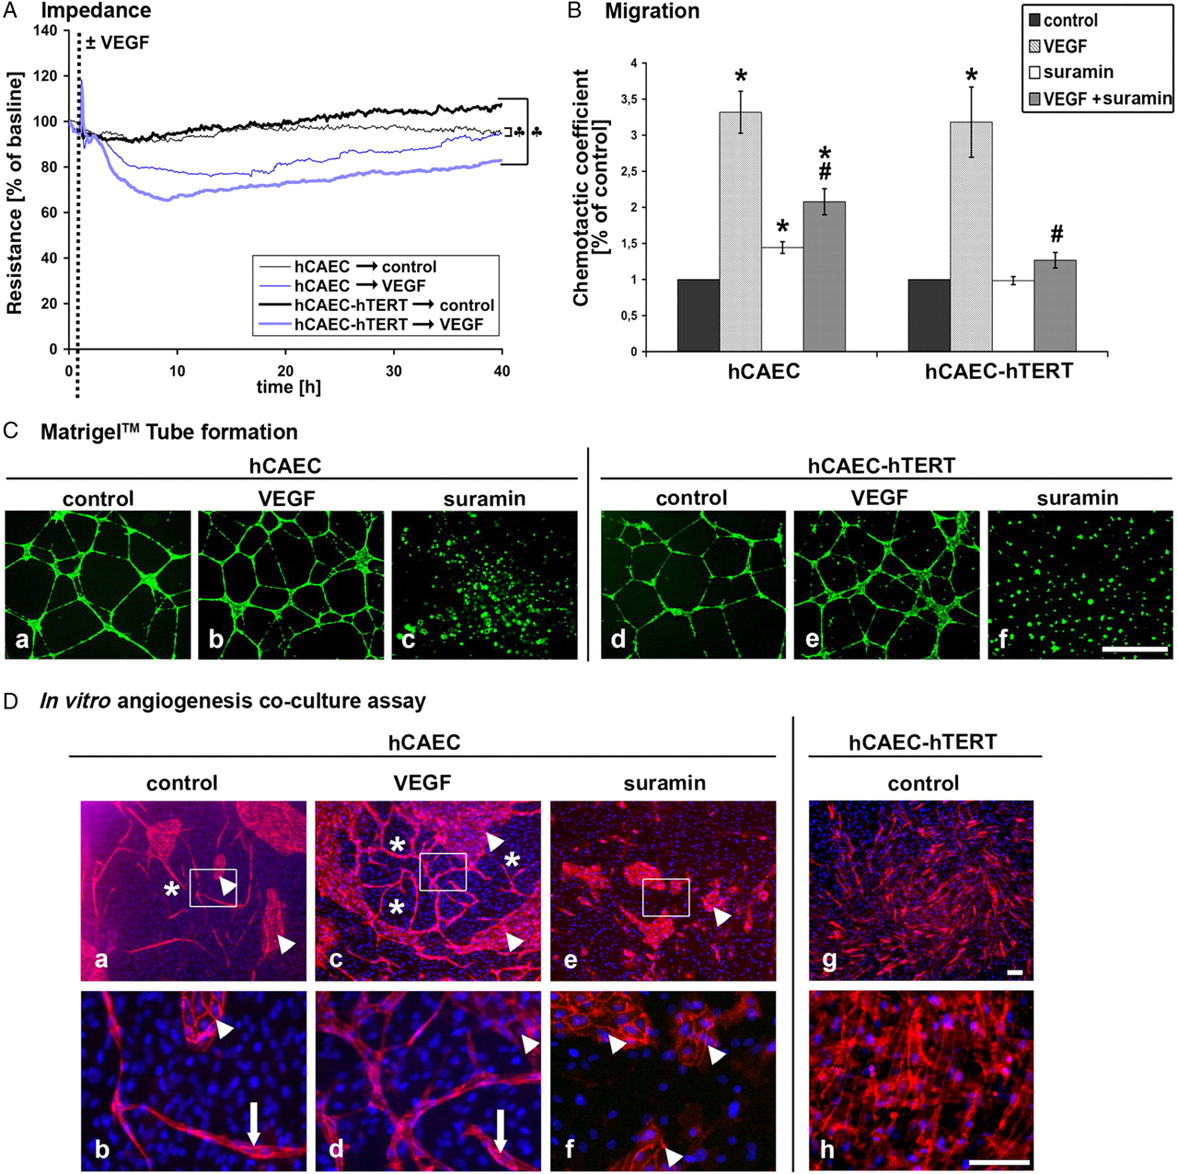
Angiogenic potential. Impedance measurements (A). Cells were cultured on microelectrodes, during which changes in the transendothelial electrical resistance (TER) were monitored. Both endothelial cell (EC) types displayed stable TER values under control conditions. The addition of vascular endothelial growth factor (VEGF) (arrow) resulted in a rapid and transient decrease of TER values. Resistance values of primary human coronary artery endothelial cells (hCAECs) reached control levels faster than those of human telomerase reverse transcriptase (hTERT)–hCAECs. Within 40 h both cell types reached non-significant TER control values (indicated by ‘♣‘). (B) Cell migration. Cell migration across transwell filters was quantified in the presence and absence of VEGF or suramin. The chemotactic coefficient was three-fold increased in VEGF-treated primary and hTERT–hCAECs. Suramin diminished VEGF-induced migratory effects. (*marks significance to control cells with P < 0.05; #marks significance to VEGF-treated cells with P < 0.05). (C) Endothelial tube formation. Cells were cultured on Matrigel™ and stained with calcein. Both hCAEC types displayed capillary tube formation under control (a, d) and VEGF-treated (b, e) conditions. Suramin-treated cells were not able to form capillary-like tubes on Matrigel™ (c, f), even though they were still viable (scale bar: 1 mm). (D) Co-culture angiogenesis assay. Fibroblasts and ECs were co-cultured for seven days, followed by fixation and staining for vascular endothelial (VE)-cadherin (red) and cell nuclei using DAPI (blue). Using primary hCAECs, control cultures displayed tube-like structures between endothelial cell islands (a). Enlarged control pictures showed potential lumen formation (b). VEGF enhanced vessel-like tube formation (c, d), whereas suramin completely abolished tube formation (e, f). hTERT-transduced hCAECs failed to develop tubular networks (g, h). (Scale bar: 100 μm) (A color version of this figure is available in the online journal)
A migratory potential must be activated by a chemoattractant in order to induce the migration of ECs or progenitor cells through the endothelial lining. To show this chemoattractant-induced ability of ECs, we used a transwell filter migration assay (Figure 5B). After inducing migration through transwell filter membranes by VEGF, we determined the chemotactic coefficient. VEGF-induced migration was comparable in primary and hTERT-transduced hCAECs and clearly different negative controls employing the antiangiogenic drug suramin. Interestingly, suramin by itself in the lower chamber displayed little or no pro-angiogenic effect in primary hCAECs (1.4 ± 0.1% of control) or in immortalized cells (1 ± 0.1% of control). However, when suramin was added to the upper chamber, VEGF-induced migration was significantly inhibited. In primary and hTERT-transduced hCAECs, the chemotactic coefficient was reduced to about 40% and 60% of VEGF levels, respectively, when treated with suramin.
The Matrigel™ tube formation assay is the most widely used angiogenesis test in vitro. When cultured on Matrigel™ both EC types formed capillary-like structures (Figures 5Ca and Cd). The addition of VEGF during incubation did not alter the tubular structure formation on Matrigel™ (Figures 5Cb and Ce). Moreover, the formation of tubes was completely abolished in both EC types by the addition of suramin (Figures 5Cc and Cf).
We also established a co-culture assay to test angiogenesis in a more in vivo-like paradigm. In this assay, fibroblasts and ECs were mixed and cultured together. Within two or three days, the cultures started to develop tube-like structures, forming a complex network within seven days. Staining with DAPI and VE-cadherin after one week demonstrated the existence of VE-cadherin-positive ECs and non-endothelial, VE-cadherin-negative fibroblasts. In primary hCAECs the endothelial tubular network consisted of monolayer islands (Figure 5D, arrowhead) and tubes (Figure 5D, asterisk). More detailed microscopic analysis suggested that some ECs had formed cavities similar to the lumina of blood vessels (Figures 5Db and Dd). Treatment of primary EC co-cultures with VEGF led to the formation of a more complex tubular network, indicating pro-angiogenic effects (Figure 5Dc). Much like control cells, VEGF-treated cells also formed tube-like structures (Figure 5Dd). The addition of suramin to primary EC co-cultures completely abolished the formation of endothelial tubes. However, endothelial monolayer regions were still detectable (Figures 5De and Df). Most surprisingly, co-cultures of hTERT–hCAECs and fibroblasts never gave rise to vessel-like tubes in this more complex angiogenesis assay. Moreover, hTERT–hCAECs formed a confluent monolayer of ECs on top of the monolayer of fibroblasts (Figures 5Dg and Dh), indicating that hTERT over-expression alters the ability of ECs to form tubular networks.
Inflammatory potential of hTERT-transduced hCAECs
Upregulation of intercellular adhesion molecules ICAM-1 and VCAM-1 at the EC surface is known to be an important step in the inflammation process. Therefore, we incubated confluent monolayers of primary and hTERT-transduced hCAECs with TNF‐α, and subsequently measured ICAM-1 and VCAM-1 expression by FACS analysis (Figure 6A). TNF‐α application resulted in a similar ICAM-1 surface expression in both EC types, whereas the upregulation of VCAM-1 differed significantly between primary and hTERT-transduced hCAECs. Endothelial inflammation is also characterized by a reduction of intercellular junctions accompanied by the loss of endothelial barrier integrity. Measuring the TER in the ECIS system, we found that pro-inflammatory cytokine exposure with TNF‐α decreased TER as expected (Figure 6B). Primary hCAECs retained stable TER values in pronounced contrast to immortalized hCAECs. For the latter, TER continued to decrease over 72 h until cell death became evident. In summary, primary and hTERT-transduced hCAECs displayed completely different responses to pro-inflammatory TNF‐α.
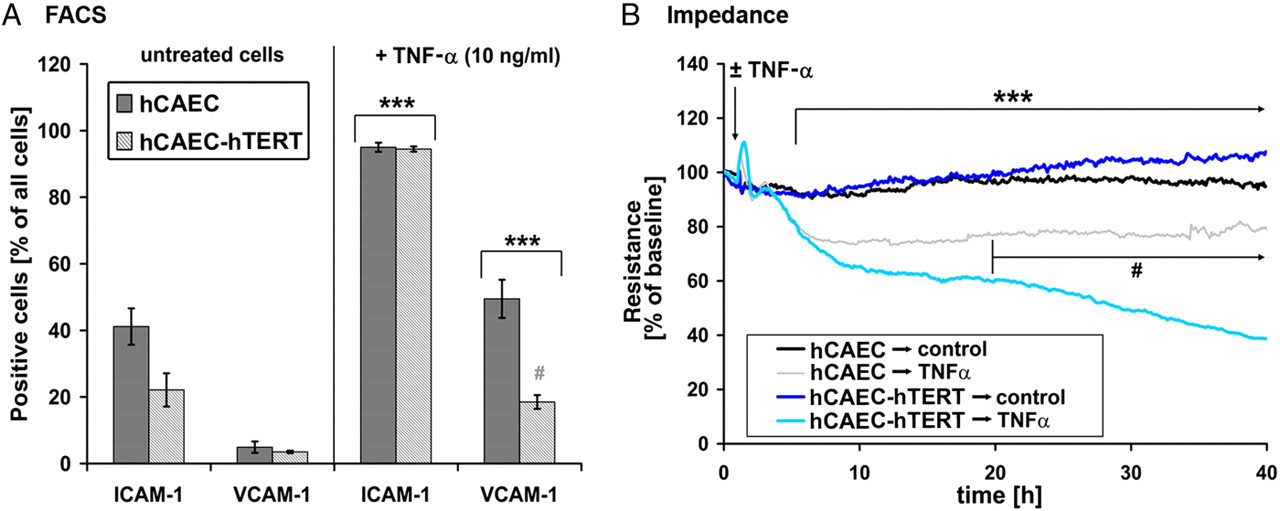
Inflammatory potential. (A) Upregulation of intercellular adhesion molecules. Cells were incubated in the presence or absence of 10 ng/mL tumor necrosis factor α (TNF‐α). Expression levels of intercellular adhesion molecule 1 (ICAM-1) and vascular endothelial cell adhesion molecule 1 (VCAM-1) were measured by fluorescent-activated cell sorting. Untreated cells expressed moderate levels of ICAM-1 and low levels of VCAM-1. Treatment of cells with TNF‐α resulted in a 3.5-fold increase in the number of ICAM-1-positive cells. VCAM-1 expression was increased 10-fold in primary hCAECs and 3.5-fold in human telomerase reverse transcriptase (hTERT)–human coronary artery endothelial cells (hCAECs). (B) Impedance measurement. Both cell types displayed stable transendothelial electrical resistance (TER) values under control conditions. Application of TNF‐α induced a rapid decrease in resistance for both hCAEC types within four hours. Twenty hours after treatment, primary cells displayed decreased but stable TER values, whereas hTERT–hCAEC resistance decreased continuously, ultimately leading to cell death. (*marks significant difference to untreated cells with P < 0.05; #marks significant difference to analogous primary cell data points with P < 0.05) (A color version of this figure is available in the online journal)
Discussion
The aim of this study was to investigate the impact of immortalization of hCAECs by hTERT over-expression on endothelial behavior.
Much as in earlier studies, we could demonstrate that viral transduction of target cells resulted in strong and prolonged over-expression of active hTERT. 21 Compared with other reports 6 in which primary ECs expressed telomerase only weakly, our primary target cells displayed relatively high baseline telomerase activity. The presence of growth factors such as FGF-2 in culture medium could explain this high activity, as suggested in reports by the Erusalimsky group. 22
One of the first steps in our study was to check primary and immortalized hCAECs for potential phenotypic alterations. Because a lack of the typical endothelial markers had been reported in several EC lines, 8 we analyzed six typical endothelial markers by immunofluorescence, FACS and Western blotting and were unable to detect any alterations in marker expression. Beside that, tightly regulated barrier properties are considered to be a valid parameter to describe the functional state of endothelium. 1 The P E determined in transwell filter experiments showed the same P E levels in naïve and immortalized cells that are reported in the literature. 23 In conclusion, over-expression of ectopic telomerase altered neither marker expression nor endothelial barrier functions.
In addition, we examined TNF‐α-induced changes of TER, since monocyte-macrophage-derived protein TNF‐α is involved in septic inflammation and subsequent endothelial hyperpermeability in vitro and in vivo. 24,25 Whereas primary hCAECs displayed decreased but stable TER values after TNF‐α treatment, immortalized hCAECs displayed continuously decreasing TER values and died. TNF‐α induces the production of reactive oxygen species (ROS), 26 which are causative for decreased telomeric integrity 27 and translocalization of nuclear telomerase 28 followed by increased sensitivity of aged cells towards apoptotic stimuli. 29 Moreover, it has been shown that TNF‐α treatment induces a dramatic loss of hTERT gene expression in CD34+- and leukemic cells. 30 Since TNF‐α treatment of naïve hCAECs did not result in cell death, as reported in other studies, 25 we assume that hTERT over-expression alters TNF‐α-induced interendothelial junction reorganization or signaling pathways (like RhoA, Rac 1, MAPK or cAMP), resulting in endothelial hyperpermeability. It will be the task of future studies to determine whether hTERT induces genomic alteration and whether TNF‐α induces (a) downregulation of hTERT gene expression and (b) ROS production.
TNF‐α-induced inflammation of the endothelium is normally accompanied by the upregulation of ICAM-1 and VCAM-1. As in an earlier comparative study of an EC line and the corresponding primary EC-type, our results show that hTERT–hCAECs display normal endothelial response. In contrast to Unger et al., 8 we performed true quantitative calculations rather than semi-quantitative estimations, which fail to identify the diminished upregulation of VCAM-1 of telomerized hCAECs.
Yet another important function of the endothelium is angiogenesis, which is crucial during embryonic development, organ formation and regeneration. Many pathological processes are linked to angiogenesis as well, including cancer, age-related macular degeneration or rheumatoid arthritis. In order to make valid investigations possible in these fields, it is essential to comprehensively characterize newly established immortalized cell lines. We tested different aspects of angiogenesis in vitro by performing migration assays and measuring endothelial barrier function. In addition, we analyzed angiogenesis using the Matrigel™ tube formation assay. We detected typical VEGF-pro-angiogenic as well as antiangiogenic suramin-induced effects in both EC types, suggesting that hTERT over-expression did not alter angiogenesis-related cell responses. However, in an in vitro organotypic blood vessel model, hTERT–hCAECs completely failed to form tubular networks, which had never been reported before. Furthermore, we can conclude that observed alterations were not a result of viral transduction because control experiments show that eGFP-transduced hCAECs were able to form tube-like structures (data not shown). This more complex assay implies the interaction of two different cells types: fibroblasts acting as mural cells and ECs, much like the situation in vivo. 31 While differences between the utilized mural cells have been shown, 32 tube formation was observed with all the primary ECs investigated so far. To our knowledge no comparable data on telomerized ECs have been reported to date. hTERT over-expression is likely to alter intracellular pathways that are necessary for vessel formation such as Rho-GTPase- 33 and NOTCH-signaling. 34
In summary, to our knowledge we are the first to report that cell differentiation and specific cell responses are altered in telomerase-over-expressing ECs. Though hTERT–ECs display the same marker expression, comparative barrier properties and similar migratory potential as naïve cells, more complex heterotypic cell–cell interactions such as vessel formation are severely compromised by over-expression of hTERT. Nevertheless, we cannot exclude, that lower levels of hTERT over-expression could be sufficient to extend the population life span without causing phenotypic changes with regard to angiogenic capacity and inflammatory responses.
Footnotes
ACKNOWLEDGEMENTS
We thank Dr Robert Weinberg (Whitehead Institute, Cambridge, USA) for kindly providing hTERT constructs. 35 We also thank E Tetling for technical support and D Blaurock as well as S McCurdy for the correction of the manuscript. This work was supported by the German Ministry of Education and Research (BMBF) #01GU0727.